Chapter 4. Infrastructure
Efficient network and innovation infrastructure are key pillars of business environment. Their accessibility, reliability and affordability are particularly critical for SMEs to compete in just-in-time and knowledge-intensive production systems, to raise their business profile and to scale up internal capacity. Yet, smaller firms are at disadvantage in accessing this infrastructure. They also weather infrastructure deficiencies less well than larger firms. This chapter presents recent developments in transport, energy, digital and R&D infrastructure across the OECD and emerging economies. It explains how network infrastructure has gained in reach, speed and sophistication, how global R&D capacity has grown, more concentrated but more open, and how these changes can affect future SME performance. The report also examines issues relevant to SME business, including increased network interdependency and cybersecurity, 5G deployment and technology adoption, micro-grids and energy decentralisation, shared mobility and the automation of transport systems. The chapter concludes with the main policy approaches adopted in countries to upgrade infrastructure, e.g. by addressing the investment gap, better co-ordinating multi-level government efforts, building smart cities and strategic public-private partnerships, or strengthening international co-operation, and to promote SME access to tomorrow’s infrastructure.
The statistical data for Israel are supplied by and under the responsibility of the relevant Israeli authorities. The use of such data by the OECD is without prejudice to the status of the Golan Heights, East Jerusalem and Israeli settlements in the West Bank under the terms of international law.
-
ICT are the primary area of infrastructure investment in many countries. ICT infrastructure has been gaining reach and speed. Mobile broadband connections expand exponentially as prices decrease. A new generation of 5G mobile networks is emerging with optimised capabilities for data transfer. SMEs are gradually moving towards high-speed broadband that is critical for their transition towards the next production revolution.
-
R&D infrastructure is highly concentrated but increasingly open. Although a massive deployment of new facilities is not expected in the near future, the digitalisation of science will facilitate greater access to scientific data and to more interdisciplinary and open platforms and premises, at the benefit of smaller R&D actors.
-
Transport infrastructure has grown in capacity, speed and sophistication. New technologies are likely to make freight transport more affordable for SMEs, as competition and innovation drive prices down and enable more tailored and diversified transport services. At the same time, the shipping crisis is likely to raise additional barriers to SMEs in needs for long distance freight.
-
Energy infrastructure is increasingly decentralised and low-carbon. The consolidation of renewable markets give SMEs alternatives for diversifying their energy portfolio. Combined with digital technologies, off-grid energy solutions (e.g. solar photovoltaics) and enhanced storage technologies (e.g. new batteries) improve flexibility and market opportunities.
-
Hyper-connectivity increases the vulnerability of the digital infrastructure. Security incidents have grown in sophistication, frequency and magnitude. Personal data breaches have also increased in scale. SMEs that process significant volumes of personal data are likely to adopt new digital security risk management principles.
-
Digitalisation also dramatically increases the interconnectedness of network infrastructure which in turn raises the risk of system failure. As a consequence governments adopt a whole-of-government approach in dealing with the complexity and interconnectedness of network infrastructure issues, the smart city being a common model and framework for policy making.
-
Efforts are made to pool resources through strategic public-private partnerships or to consolidate infrastructure through roadmaps and system-enabling interfaces. In some countries, SMEs receive targeted policy support aiming to raise their awareness on business opportunities or security issues or to involve them in collaborative research.
-
International co-operation on network infrastructure deployment and security is a key area of policy intervention.
Why is it important?

Network (logistics, energy, Internet) and knowledge infrastructure is the foundation of a dynamic business ecosystem. A well-functioning infrastructure ensures secure and cost-efficient access to strategic resources, including data and networks. Quality infrastructure is also critical for firms’ entry into distant markets and engagement in global value chains (GVCs). A recent study of the World Trade Organisation shows that logistics and infrastructure costs remain among the major challenges SMEs face in joining GVCs and lead firms within GVC face in finding suppliers (World Trade Organisation, 2016[2]).
Infrastructure is particularly critical for firms to compete in just-in-time production systems in which response time between suppliers and customers has substantially reduced (see the chapter 7 on access to innovation assets). And in increasingly knowledge-based economies, the digital, research and development (R&D) and innovation capacity that is developed at national and subnational levels has become a key driver of global competitiveness (OECD, 2015[1]).
However, as this chapter illustrates, smaller firms are at disadvantage in using the infrastructure that could enable them to raise their business profile and scale up internal capacity. They also weather deficiencies in infrastructure less well than larger firms (see the chapters 3 and 7 on market conditions and access to innovation assets).
Transport infrastructure is a key enabler of agglomeration and connectivity and can influence the decision of where to locate new enterprises. Past OECD work has shown that location choices and firm creation are positively affected by the connectivity of a neighbourhood to the expressway network (OECD, 2016[2]). In the case of the West Coast expressway in Korea, for example, micro manufacturing establishments with less than 10 employees are those who benefited the most from proximity. Likewise air connectivity can help attract foreign direct investment (FDI) and the most talented individuals who also tend to be the most internationally mobile (Oxford Economic Forecasting, 2006[4]) (OECD, 2018[3]). Transport infrastructure is an important issue for domestic connectivity, especially in large countries, and it is critical for reducing geographical inequalities.
However, logistics tend to cost more to SMEs than large enterprises. SMEs trade smaller cargos and at a more irregular frequency, which contributes to increase the fixed costs they incur for trading within and across borders. Logistics constraints are particularly acute in industries characterised by fast technological obsolescence, “no stock” supply chains, the transportation or transformation of perishable commodities, or seasonal or fashionable demand. And geographical distance tends to further accentuate cross-firm distortions in transport and logistics costs.
In addition to the relative extra costs they incur for logistics purposes, SMEs face difficulties in accessing efficient transport and storage services. Beyond roads, ports and airports, trade logistics include a wide range of services, from pick-up and collection to storage to transport to distribution, for which SMEs often rely on logistics providers as they lack information, experience and scale to handle the full process on their own.
Cross-country evidence shows that, for manufacturing firms, logistics costs as a share of revenues are on average more than twice higher for firms with less than 250 employees than for large firms with more than 1 000 employees (Handfield et al., 2013[4]). In Latin America, domestic logistics costs can add up to more than 42% of total sales for SMEs, as compared to 15-18% for large firms (WTO, 2016[5]).
Energy infrastructure matters for SME operations although smaller firms are typically less energy intensive and incur relatively lower energy costs in proportion of their overall costs. Improving energy efficiency could bring multiple benefits to SMEs, including reducing intermediary consumptions and costs, raising product quality and visibility, improving operations and workplace environment, gaining access to new markets, reducing vulnerability to energy price volatility or ensuing compliance with environmental standards (UNEP, 2010[6]; IEA, 2014[7]). Gains from energy efficiency improvements for SMEs are estimated from 10% to 30% of their energy demand (IFC, 2012[8]; Eurochambres, 2014[9]; Thollander and Palm, 2013[10]).
SME greening is likely to bring broader benefits in terms of environmental sustainability. The introduction of renewable energy technologies in the SME sector can contribute to reduce overall dependency on fossil fuels. Substitution could be all the more facilitated as SME lower energy intensity allows them using a greater range of technology mixes. It is estimated that, for several industrial applications, more than 50% of energy consumption can be provided through a portfolio of renewable sources, such as biomass, solar thermal system, geothermal or heat pumps. (IRENA, 2014[11]). Among the smart solutions suitable for SMEs are micro-grids that incorporate renewable sources of energy into conventional electricity grids with the help of information and communication technologies (ICT) for management and control purposes and enable small-scale energy production and management. The benefits of energy efficiency improvement differ across industries and value chain configurations (IEA, 2014[7]).
Yet, few SMEs engage efforts towards greater energy efficiency or low-carbon solutions. Less than 40% of SMEs in the EU adopt efficiency measures, while only 4% have a comprehensive and coherent approach to energy efficiency (EC, 2014[12]). Barriers to energy efficiency improvements and the deployment of renewable technologies in SMEs are manifolds. Energy savings are often not a top investment priority for small firms. Limited awareness, lack of skills and expertise for identifying and implementing energy projects as well as difficulties in financing them, especially the initial costs of technology integration, are frequent obstacles (IEA, 2015[13]; IRENA, 2014[11]). A lack of standardisation and regulation also limits the deployment of micro-grids (Wouters, 2014[14]).
ICT infrastructure is critical for sustaining digital diffusion among SMEs and SME participation in the next production revolution (see chapter 7 on access to innovation assets). Results of a sample survey of UK firms with low-speed and high-speed internet connection show that greater ICT intensity1 is positively related to firm level productivity (OECD, 2015[15]). Other studies on German and Irish firms pointed out that the use of broadband connections has a positive and significant impact on their innovation activity (Bertschek, Cerquera and Klein, 2013[16]; Haller and Lyons, 2015[17]). Recent OECD analysis also shows that catching up with the best performing countries in terms of high-speed internet could substantially increase productivity (Sorbe et al., 2019[18]).
Accessing high speed networks allows SMEs and entrepreneurs connecting to suppliers and customers, obtaining real-time information and providing real-time responses to fast-evolving markets and supply chains. High speed digital networks also enable smaller-scale businesses building digital capacity (e.g. through cloud computing services) without the upfront and maintenance investments they used to incur (Box 4.1). At a time when data access is more than ever strategic to the firm, the combined application of the Internet of Things (IoT), machine-to-machine communication and big data analytics open tremendous market opportunities (OECD, 2017[19]), (OECD, 2016[20]), that require high SME digital connectivity in order to provide their full benefits (see chapter 7 on access to innovation assets).
Fears of loss of control on data and mistrust around data integrity and security remain however major obstacles to CC adoption, SMEs showing more reluctance than large firms (OECD, 2017[21]).
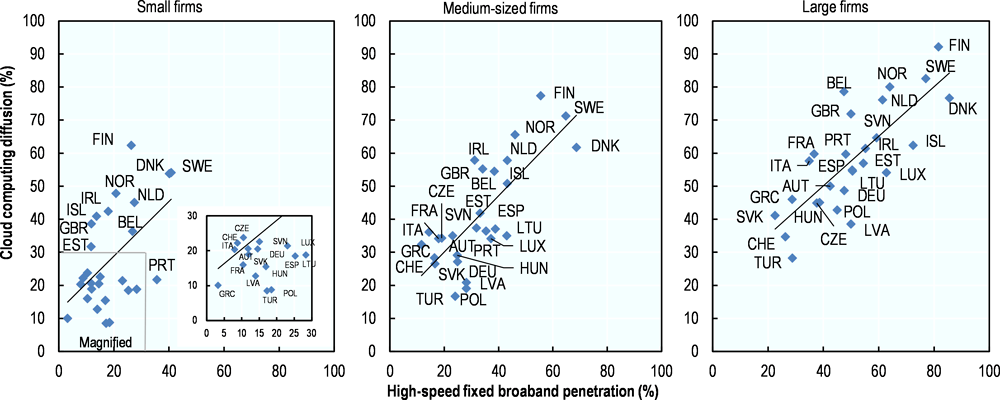
Firms of all size classes tend to purchase more cloud computing services when they also have access to enhanced broadband infrastructure (Figure 4.2), highlighting the importance of quality broadband networks for digital service accessibility and adoption. Whereas the digital gap, i.e. lower ICT access and use, increases as firms get smaller, the relation between CC diffusion and high-speed broadband penetration remains constant across all firm size classes.
Yet, SMEs lag in their high-speed broadband connections as compared to large firms (Figure 4.2). Despite wide variations across countries, business surveys on ICT use show a universal and growing connectivity gap as firms get smaller. The poorest penetration rates were observed in 2018 in Greece, Colombia2 and Italy where less than 10% of all firms with more than 10 employees were connected to fixed high-speed3 broadband in particular small firms. Small firms were however ten times more likely to be connected to fixed high-speed broadband in Sweden (41%%), Denmark (40%) or in Portugal (36%) than in Greece (3%). The digital gap between small and large firms was of over 1 to 5 in Iceland and over 1 to 4 in Estonia, Italy and the United Kingdom.
In addition to the barriers they face in terms of awareness, skills and finance for connecting to ICT infrastructure, SMEs often do not have the resources or expertise for effectively assessing cyber-risks and implementing appropriate prevention and management measures. As a consequence SMEs offer "smaller target" for cyber-attacks, with risks of a systemic contamination of complex digital systems. In addition, smaller firms may weather less well temporary losses of reputation, consumer trust or revenues they could incur following a digital security incident. On the positive side, SMEs that can demonstrate robust digital security and privacy practices may have a competitive edge in setting partnerships and business relationships with larger corporations.
R&D infrastructure is a key constituent of innovation ecosystems. It serves as a catalyst for attracting world-class researchers, business R&D centres, start-ups and international foreign direct investment (FDI) (OECD, 2016[20]). World-scale research infrastructure acts as platforms of international scientific co-operation and could become nodes within global innovation networks (OECD, 2015[1]). For instance a determinant criteria for European firms to invest in bio-based R&D is the availability of knowledge infrastructure (Suurs and Roelofs, 2014[22]).
Cloud computing (CC) offers new opportunities for SMEs to access online extra processing power or storage capacity, as well as databases and software, in quantities that suit and follow their needs. Overall, the first uses for which firms turn towards CC are email services and storage capacity, then accessing office software and hosting databases (OECD, 2017[23]). Consequently, CC also supports the diffusion of other technologies as well as new organisational or marketing practices (see chapter 7).
In addition to its flexibility and scalability, CC reduces costs of technology upgrading by exempting firms of upfront investments in hardware and regular expenses on maintenance, IT team and certification. In fact higher adoption rates of cloud computing are associated with lower intensities of ICT investment in equipment (Figure 4.1), firms moving towards an ICT management model that is more based on software acquisition and digital connectivity.

StatLink https://doi.org/10.1787/888933924457
Note: Investment in ICT material are gross fixed capital formation (GFCF) in computer hardware and telecommunications equipment, expressed as a % of GDP. Cloud computing data cover firms with 10 and more employees.
Sources: OECD (2019[24]), OECD National Account Database 2019, http://www.oecd.org/sdd/na/ (accessed on 12 February 2019); OECD (2019[25]), OECD ICT Access and Usage by Businesses Database 2019, http://stats.oecd.org/Index.aspx?DataSetCode=ICT_BUS (accessed 12 February 2019).
Source: OECD (2017[23]), OECD ICT Access and Usage by Businesses Database, https://stats.oecd.org/Index.aspx?DataSetCode=ICT_BUS (accessed on 18 July 2018).
Note: High-speed fixed broadband penetration rate is the percentage of businesses with a broadband download speed of at least 100Mbit/s. Cloud computing diffusion rate is the percentage of businesses that purchased cloud computing services in 2018. Firm size classes are defined by employment size. Small firms employ 10-49 employees; medium firms 50-249 employees and large firms more than 250 employees. Data for Japan are collected following a different methodology and exclude firms with less than 100 employees. Data for Switzerland are for 2015. Data for Iceland are for 2014 (CC) and 2013 (broadband).
Source: OECD (2019[25]), OECD ICT Access and Usage by Businesses Database 2019, http://stats.oecd.org/Index.aspx?DataSetCode=ICT_BUS (accessed 12 February 2019).
Whereas most SMEs lack both financial resources and skills for establishing and maintaining internal R&D capacity, nearby R&D facilities may be a gateway towards cutting-edge technologies and premises, and a medium for acquiring new data and scaling up scientific networks. Public research facilities in particular play a key role in bringing together public and private interests, resources and talents. E-infrastructure including e-libraries and databases can also assist in making R&D outcomes accessible to SMEs. Beyond facilities, labs and technology platforms, formal and informal R&D networks that bring together actors across disciplines, sectors and borders also contribute to consolidate R&D infrastructure, which may benefit SMEs.
Infrastructure capacity and performance: Recent trends
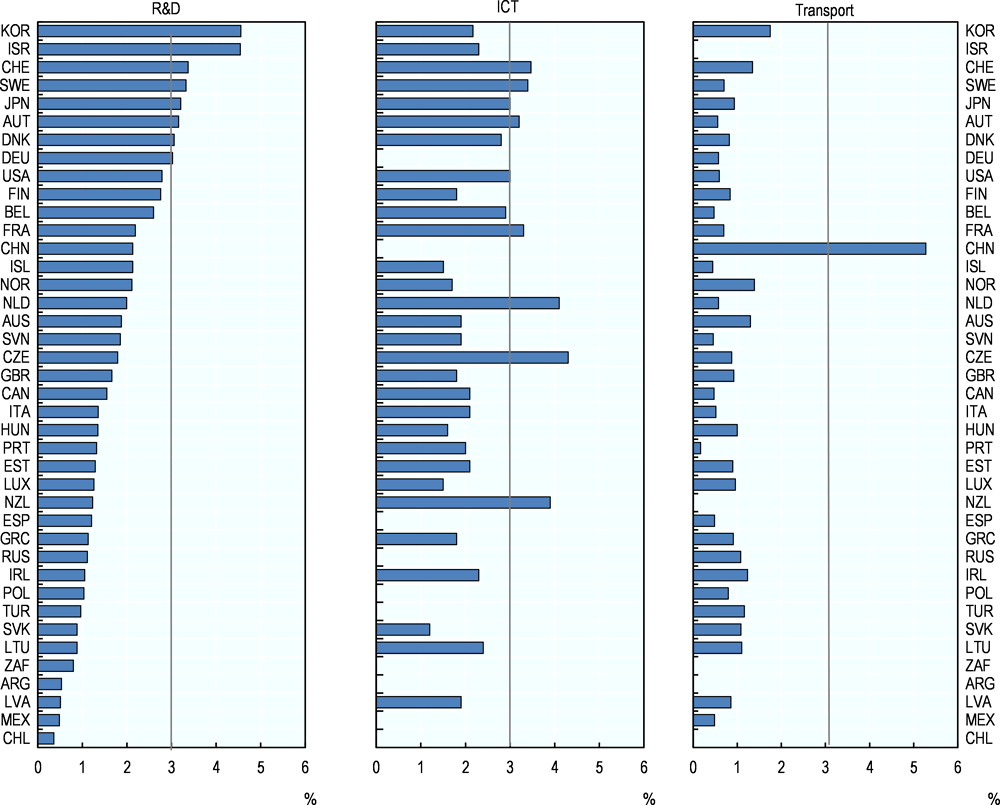
ICT are the primary area of infrastructure investments in most countries as per their intensity of expenditure on computer hardware, telecommunications equipment, and software and databases (Figure 4.3). The Czech Republic and the Netherlands invested more than 4% of their GDP in developing and expanding their ICT capacity in 2017. The intensity of ICT investments ranges from 1.2% (Slovak Republic) to 4.3% (Czech Republic) of GDP in the countries for which data are available.
Financial efforts on R&D were also significant, especially in top R&D performers such as Korea and Israel that spent more than 4.5% of GDP on R&D in 2017. But the intensity of R&D varies significantly across countries reflecting cross-country gap in R&D capacity. Apart from Israel and Korea, only Switzerland, Sweden, Japan, Austria, Denmark and Germany spent more than 3% of GDP on R&D in 2017. Most countries remain below a 2% threshold.
Notes: R&D investments are gross R&D expenditure (GERD). R&D data refer to 2017 except for Argentina Chile and Mexico (2016), Australia, New Zealand, Switzerland and South Africa (2015), and Austria (2018).
Transport investments are total inland transport investment, i.e. investment and maintenance expenditures on rail, road and inland waterways infrastructure, including expenditure on new construction and extension of existing infrastructure, reconstruction, renewal and major repairs. Transport data refer to 2016, except for the United States (2015), Switzerland (2014), Netherlands (2011) and Ireland (2007).
ICT investments are gross fixed capital formation in ICT material, including computer hardware and telecommunications equipment, and computer software and databases. Data for Iceland correspond to business investment in office machinery and computers. Data for Korea are OECD calculations based on detailed national Input-Output Tables supplied by the Bank of Korea and OECD Annual National Accounts SNA08. ICT data refer to 2016 except for Latvia, Norway and Spain (2014) and Iceland and Korea (2015).
Sources: OECD (2019[26]), OECD Main Science and Technology Indicators Database 2019, https://stats.oecd.org/Index.aspx?DataSetCode=MSTI_PUB; OECD (2019[27]), OECD International Transport Forum Database 2019, OECD, Paris; OECD (2019[24]), OECD National Account Database 2019, http://www.oecd.org/sdd/na/ (accessed on 12 February 2019).
The intensity of transport investments is more homogeneous across countries, ranging on average from 0.5% to 1.75% of GDP in 2016. China stands out as an exception with 5.27% of its GDP invested in inland transport development. Conversely, Slovenia (0.47%) and Iceland (0.44%) rank comparatively low.
If ICT followed by R&D remain the largest infrastructure investments in most countries, investment profiles vary across countries. Switzerland show high profiles on R&D (3.37%), ICT (3.47%) and transport (1.34%). Sweden combine high ICT and R&D investments. Denmark, Finland, Germany and Japan invest slightly more on R&D than ICT, whereas Israel and Korea invest 2% more of their GDP on R&D than ICT. In addition Korea has high investment profile on transport. Likewise, Australia and Norway spent over 1.3% of GDP on transport extension and construction.
ICT infrastructure is gaining reach and speed, but not without risk
Fixed and mobile broadband subscriptions have continued to increase in the OECD, reflecting their complementarity (Annex 4.1). But mobile broadband has expanded much faster (by a factor of more than 5 in seven years), worldwide subscriptions increasing from 824.5 million in 2010 to 4.8 billion end 2017 (ITU, 2018[28]). In parallel, fixed broadband subscriptions have increased by a factor of less than 2, reaching 1 billion end 2017 up to 532 million in 2010 (ITU, 2018[29]). In 2017, the OECD average penetration rate was 30%, with Switzerland (47%), Denmark (43%), France (43%) and the Netherlands (42%) heading the ranking (OECD, 2018[30]). But a clear slowdown in fixed subscriptions was noticeable as compared to previous years, especially in countries that had already achieved the highest penetration rates.
Prices in both fixed and mobile broadband have decreased and mobile plans are increasingly being priced based on data usage rather than telephony, mirroring the rapid increase in the demand for mobile data in the market (OECD, 2017[21]).
Speed has also improved. Mobile networks are upgrading to the 4th Generation (4G) and former 2G networks are progressively switched off (e.g. Telstra and AT&T in Australia and the United States in 2016; all 2G networks in Singapore in 2017; Canada and Switzerland between 2018 and 2021). The popularity of smartphones has prompted consumers to move gradually to 3G and 4G, the number of towers providing a 4G coverage continuing to increase.
In the meantime a new generation of 5G mobile networks is emerging with optimised capabilities for data transfer. The 5G technology has the potential to bring the IoT and data analytics developments to a new scale. Business applications are potentially significant as 5G provides a management and operational architecture for supporting the implementation of smart factories, the design of digital twins or fleet management (e.g. through enhanced real-time data exchange between several billion smart devices, remote control and automation, data analytics and predictive intelligence) (see chapter 7 on access to innovation assets).
The adoption of non-standalone 5G standards end 2017 gave the signal to the industry for a full-scale and cost-effective development of 5G networks, carriers worldwide announcing new deployment plans. Although the time when 5G will deliver its full benefits remains a way ahead (the hardware, infrastructure, chips, modems, phones, and antennas being still to be built)4 a new upgrading cycle has started. In July 2018 Nokia and T-Mobile (Deutsche Telekom) signed a landmark 5G deal for USD 3.5 billion with the ambition to supplying America with the hardware and end-user 5G technology, software, and services.5 Ericsson signed up a similar deal with T-Mobile in September, foreshadowing that the 5G battle has kicked off between the big names in telecoms.6
Offers of fixed broadband at 1 Gigabit/sec are also increasingly common across OECD countries, particularly where the fibre or upgraded cable broadband networks are available (OECD, 2017[21]). Drivers of the fast deployment of high-speed infrastructure include population density (e.g. in high density countries or urban areas) and high competition between operators. In fact, Internet service providers are increasingly diversifying their offers beyond the usual cable-TV set-top box, for instance by proposing new video and gaming contents. Shifting business models are however likely to severely challenge municipal and publicly-owned networks that use to bridge the digital gaps in remote regions, cities or smaller towns and which business model is more oriented towards providing utility-like infrastructure than services.
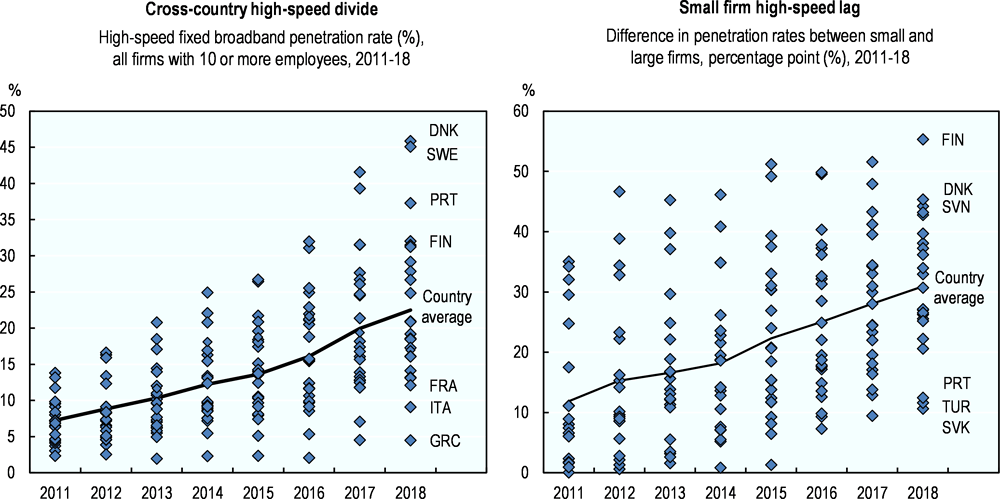
Firms are increasingly moving towards high-speed fixed broadband (Figure 4.4). Business demand for high-speed infrastructure has been stimulated by more affordable access prices and the market prospects of a vibrant Apps economy. Business surveys on ICT access and usage show that on average 23% of European firms with 10 or more employees had high-speed connection in 2018, up from 7% in 2011. However these numbers hide wide and growing disparities.
Note: High-speed fixed broadband penetration rate is the percentage of businesses with a broadband download speed of at least 100Mbit/s.
Source: OECD (2019[25]), OECD ICT Access and Usage by Businesses Database 2019, http://stats.oecd.org/Index.aspx?DataSetCode=ICT_BUS (accessed 12 February 2019).
The cross-country digital divide in terms of high-speed broadband adoption has enlarged in the current decade. While high-speed infrastructure remains in the infancy in Greece and Italy with little new deployment over the period, Denmark, Sweden and Finland have consolidated their advance, Spain, Portugal and the Netherlands have caught-up and Austria, the Czech Republic and France have lost pace in digital developments.
In the same period, cross-firm digital divide has also enlarged, with smaller firms loosing ground in the transition. Fixed high-speed broadband penetration rates have increased faster among large firms than among smaller firms in all European countries for which data are available. The largest gaps were recorded in Finland, Denmark and Slovenia where 82%, 86%, 59% of large firms have high-speed connection in 2018 as compared to 26%, 40% and 15% of small firms respectively.
In addition, hyper-connectivity makes digital infrastructure more vulnerable. The increasing connectivity of data-intensive activities adds layers of complexity, volatility and dependence on existing infrastructures and processes (OECD, 2017[21]). In particular, as digital services are increasingly connected and extending beyond the reach of a single jurisdiction and control institution, the risks of systemic failures are likely to grow and new governance challenges for businesses and governments to emerge.
Digital security incidents appear to be increasing in terms of sophistication, frequency and magnitude of influence. Incidents, including viruses (malware), phishing7 and social engineering,8 or denial of service (DoS)9 attacks, can disrupt the availability, integrity or confidentiality of information and information systems. Malicious attacks may be initiated by criminal organisations that have become increasingly active in the domain, or for the purposes of industrial digital espionage or government offensive intelligence. If viruses remain the most common type of cyberattacks, the DoS attacks are growing rapidly both in terms of the number of incidents and their sophistication.
All incidents are however not malicious and unintentional breaches in privacy could also result from misuses of personal data, e.g. due to an employee’s inadvertence, or accidental losses of data. Personal data breaches have increased in terms of scale and profile in recent years (OECD, 2017[21]).
Although large and small organisations have been subject to more frequent and severe cyberattacks, converging evidence indicates that the risk and frequency of the incidents increases with firm size (and the intensity of ICT use). UK survey data of 2015 showed that the most common security incidents faced by SMEs were infection from viruses or malware (63% of SMEs surveyed), attacks by an unauthorised outsider (35%) and staff-related breach (27%). Major risks relate to processing payment and confidential data. Also, in some sectors such as health, law or finance, SMEs will tend to process significant volumes of personal data (OECD, 2016[31]).
With the IoT, the risk of security incidents is likely to increase, the IoT components becoming both targets of attacks and channels for disrupting physical systems. As the IoT bridges the digital and the physical world, cyberattacks could increasingly alter the functioning of control and monitoring systems (e.g. self-driving cars, medical devices etc.) or defence and security systems and disrupt the supply of essential services (e.g. electricity, heating, water, finance, transport), with lethal consequences.
Similarly the risk of online fraud is poised to grow with the rise of e-commerce practices; and privacy risks are to amplify with the proliferation of big data and the use of data analytics for mining data.
As a consequence, SME ability to include digital security risk management in their operational protocols will become increasingly important for their integration into the global economy. In addition, SMEs that are well-aware of the risks incurred and prompt to implement appropriate solutions would contribute to strengthen resilience to systemic failure.
R&D capacity is increasing worldwide but in more concentrated and open infrastructure
Scientific research depends on latest technological developments and increasingly expansive research infrastructure. While this has long been the case in physics, the situation is new in other research areas, such as the social sciences and humanities. These expenses cover the deployment and maintenance of large international infrastructure and experimental facilities, such as telescopes or synchrotrons, biobanks and high performance computer centres, but also smaller-scale technology platforms, libraries and information archives.
Global R&D capacity has doubled in the last 15 years (OECD, 2016[20]). Two main factors are behind this remarkable expansion. First is a continuous increase in business R&D expenditure, especially during times of economic growth. Second is rising capacity in new geographical areas, especially China that roughly doubled its share of world R&D every ten years since early 1990s.
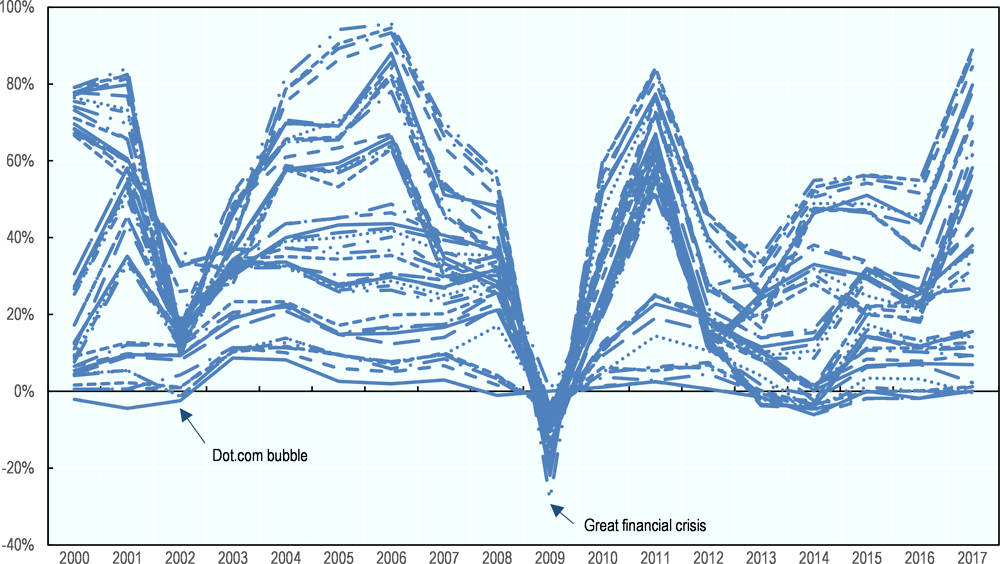
Global R&D capacity keeps expanding driven by a sharp rebound in business investment in 2017 (Figure 4.5). World business R&D has experienced a seventh consecutive year of growth as economic conditions and market prospects improved. Business R&D is now 28% higher than before the great crisis and firms accounted for the first time in 2017 for more than 70% of all the R&D performed in OECD countries (OECD, 2019[26]). Some high-performing countries have however showed weaker performance with decreasing business expenditure on R&D (BERD), including Australia (-5.2% annually between 2013 to 2015), and Canada (-4.9% and -0.1% in 2016 and 2017 after several years of decline). At +10.4% (2016) and +8.1% (2017), R&D expenditure by Chinese companies remains extremely dynamic albeit subdue as per historical standards (+16.9% before the great financial crisis).
However the share of BERD that is dedicated to finance capital investment is decreasing in many countries (OECD, 2019[26]). In fact, most of BERD serves to cover salary expenses and labour costs and a small share of the total is used for capital investment (Figure 4.6). This share varies significantly across countries. In catching-up economies, firms tend to earmark a larger share of BERD to capital investment. Yet in most countries and at various stages of R&D development, R&D capital costs have been increasing more slowly than labour costs between 2007 and 2016, reflecting the influence of several factors on salaries, including higher demand for research skills globally and a closing wage gap in emerging economies.
Business R&D capacity remains highly concentrated in a few firms, a few sectors and a few regions. 2 500 large companies invested in 2017-18 for a total of EUR 734.6 billion in R&D, i.e. about 90% of world’s business-funded R&D. 36% of total industrial R&D is performed by the top 50 companies and 48% by the top 100. A few sectors, ICT, health and automotive industries account for 75% of total spending (EC, 2018[32]) (OECD, 2019[26]). And R&D resources are also highly spatially concentrated, often in capital city regions (OECD, 2018[33]).
Source: OECD (2019[26]), Main Science and Technology Indicators, https://stats.oecd.org/Index.aspx?DataSetCode=MSTI_PUB (accessed on 03 October 2018).
A massive deployment of new R&D infrastructure is not expected in the near future. There are several factors that limit future private and public investments on R&D. First mitigated growth prospects are likely to weigh on BERD and future investment will increasingly be absorbed into labour costs rather than capital expansion as R&D systems become more sophisticated; all the most as rising competition for talents puts an upward pressure on research wages. Second, public R&D budgets are likely to plateau around current levels (OECD, 2016[20]).
A new use of research infrastructure is however possible, at the benefits of smaller actors. The digitalisation of science will facilitate greater access to scientific data. Open data has the potential to make research system more effective by reducing duplication and enabling the same data to be used and re-used by different actors and generate more research. Under the combined effects of open science, digital technologies and greater accessibility of data and knowledge, citizen science or “do-it-yourself science” initiatives are to keep multiplying, citizens conducting their own experiments or even maintaining their own facilities or sharing publicly-accessible facilities (OECD, 2016[20]).
Transport networks have grown in density, speed and sophistication.
The transport sector is in constant evolution (Box 4.2). Developments remain closely related to economic activity and international trade, oil price fluctuations playing also a role. Preference between different modes of freight is also determined by the type of commodities transported and the distance to cover.

Note: R&D capital costs include land and buildings, machinery and equipment, capitalised computer software and other intellectual property products. Data refer to 2015 except for Canada (2017), Argentina, Chile, China, the Czech Republic, Iceland, Japan, Korea, Mexico, Norway, the Russian Federation and Spain (2016), France (2014) and South Africa (2013). Data for business R&D intensity refer to 2017 except for Argentina, Chile and Mexico (2016) and Australia, New Zealand, South Africa and Switzerland (2015).
Source: OECD (2019[34]), OECD Research and Development Statistics Database, www.oecd.org/sti/rds (accessed on 08 March 2019).
Transport infrastructure has spread and densified, as roads and rails reached new areas and airports grew in size or scope. A representation of international freight routes including roads, rail, sea and air (Main policy approaches and recent policy developments
Typically, market and system failures discourage large-scale investments and partnerships that would be needed for strengthening and maintaining quality infrastructure.
Governments play a key role as coordinator, helping the various stakeholders adopt a common vision and design a comprehensive strategy. They serve as facilitator in building public-private partnerships, implementing system-enabling instruments (e.g. interfaces, platforms) or setting standards, etc. They encourage and steer international cooperation. Some of these initiatives particularly target SMEs.
Adopting a whole-of-government approach…
Infrastructures conjure an association of physical networks for transportation, communication and utilities. These diverse networks are becoming more and more interconnected, as they facilitate the flow of people, goods, resources and information deeply influencing the structure of cities and metropolitan regions as well as of nation states. In a broader sense today’s “infrastructure space” extends from the grids of pipes and wires to the pools of microwaves beaming from satellites and the shared global standards that allow them to be connected to each other (Easterling, 2014[35]).
For instance, logistics beyond transportation or trade facilitation is now part of a broader agenda that includes services, the development of facilities, infrastructure, and spatial planning. As they increasingly look at logistics not only from the perspective of reducing trade costs at the border, but for the many positive externalities this large sector can bring to the economy and environment, governments are confronted to a complex set of reforms and measures to implement. As a result, many countries have engaged in comprehensive strategy exercises, with a strong focus on strengthening public-private dialogue and private sector participation in infrastructure development (OECD, 2017[36]; ITF, 2017[37]).
Special challenges also affect geographically distributed infrastructures that are often decentralised administratively and financially.
In such a vast and complex space, a whole-of-government approach including ministries, departments and agencies across different levels of jurisdiction becomes necessary in order to take account of interrelated effects and cross-cutting and diverging interests (Table 4.1). Governments also adopt more participative forms of governance, with small businesses increasingly involved in policy debate and policy making process, e.g. through public consultations or multi-stakeholders discussion mechanisms.
… Working at subnational level…
Subnational governments, cities, towns, and regions, play a vital role in the infrastructure landscape and regional and municipal infrastructural policies are likely to grow in relevance. Subnational governments (SNGs) investment represents on average 57% of total public infrastructure investment in OECD countries and 40% at a global level. While strengthening quality infrastructure is a joint challenge and responsibility of all levels of government, subnational governments are actually responsible for policy design and implementation in key areas for SMEs, such as transport, energy, water and sanitation, or broadband etc.
Public investment is on the decline in the OECD area since the 1980s (Allain-Dupré, Hulbert and Vincent, 2017[38]). In many OECD countries, this long-run downward trend is related to the increased focus of public investment on operation and maintenance as infrastructure itself was already well-developed. This also reflects a change in investment, from infrastructure to intangibles, and the fact that public-private partnerships (PPPs) are not counted as public investment. Hence, despite a temporary increase during the 2008-09 crisis, public investment has reached historically low levels in many OECD countries, and particularly in the EU. Likewise, subnational governments have decreased their capital expenditures after 2010 as subnational budgets served as adjustment variable for more general fiscal consolidation. Results of a 2015 OECD survey to 255 SNGs shows that road transport was the sector most impacted by resource gap, particularly for small municipalities (85%), and public transport for large SNGs (i.e. large cities and regions).
The room for increasing subnational infrastructure investment remains limited due to ongoing changes in SNG expense structure (Figure 4.7). Expenditures related to social benefits and intermediate consumption have been growing fast over the past decade, while revenues have maintained, reducing the fiscal space for SNGs to invest.
Given their changing cost structure, SNGs would need to diversify their traditional sources of financing if they are to support future investment in infrastructure. Yet, such diversification, through private funding, PPPs or financial markets (e.g. via inter-municipal borrowing agencies) remains very limited at the subnational level. Among the various reasons that can explain this deficit of private funding are the complexity of, and technical and legal capacities required for, using PPPs, as well as a lack of knowledge within SNGs of the variety of financial mechanisms available, and a lack of coordination across SNGs to pool financial resources and engage in innovative financing mechanisms.
In 2014, the OECD adopted a ‘Recommendation of the Council on Effective Public Investment across Levels of Government’, which focuses on multilevel governance challenges and ways to overcome them (Box 4.2). Major areas for improving SNG practices included long-term planning for infrastructure investment, multi-level governance and co-ordination, co-ordination of investments across sectors (e.g. transport, broadband, water, spatial planning etc.) and monitoring and evaluation. Regulatory frameworks and procurement procedures were also identified among the hurdles facing SNGs when implementing infrastructure projects.

Note: OECD countries except Australia and Chile. Turkey: 2011 instead of 2012 and 2013. Based on OECD National Accounts 2015.
Source: Allain-Dupré, D., C. Hulbert and M. Vincent (2017[38]), “Subnational Infrastructure Investment in OECD Countries: Trends and Key Governance Levers”, https://dx.doi.org/10.1787/e9077df7-en.
Since inception in 2014, 39 countries have officially adhered to the OECD Recommendation of the Council on Effective Public Investment across Levels of Government (OECD, 2014[39]).
Five years after its adoption, a majority of countries have adopted integrated investment strategies and implemented mechanisms to co-ordinate public investments across levels of governments. A number of countries have adopted policies to promote a result-oriented investment strategies. However, only few countries have implemented mechanisms to assess upfront the long-term impacts of public investments.
Further efforts are needed to minimise future detrimental social and environmental impacts that infrastructure investments may have. Countries also need to further strengthen their fiscal frameworks to ensure they are better adapted to the objectives pursued. More efforts are also needed to improve the regulatory framework – reducing regulatory burden and ensuring greater regulatory coherence – to foster both public and private investments.
Source: OECD (2014[39]), Recommendation of the Council on Effective Public Investment Across Levels of Government, http://www.oecd.org/regional/regional-policy/Principles-Public-Investment.pdf.
… Building smart cities
In the last decade the concept of Smart Cities has taken ground in the policy debate. Smart cities use digital technologies to support real-time data production, automated utility systems and digital communication tools, with the objective of making critical urban infrastructure components and services more efficient and interconnected (OECD, 2016[40]). Smart cities function as complex systems (Fu and Peng, 2013[41]) designed around six ‘smart’ dimensions: economy, government, mobility, environment, living and people. Therefore many smart city policy interventions are cross-cutting (e.g. introducing e-bikes reduces energy consumption and pollution, improves mobility, and sustains healthier lives).
The potential of smart cities for fostering entrepreneurship is increasingly recognised, with evidence of higher degrees of entrepreneurship in smart cities and the positive impact of high quality ICT infrastructure on attracting entrepreneurs. While the presence of ICT infrastructure is still the basic requirement for digital economies and smart cities to develop, innovations are gradually moving from purely physical infrastructure projects to hybrid and digital infrastructure (e.g. e-government) (Table 4.1).
Investing in infrastructure and strategic public-private partnerships
Governments need to invest more and better on infrastructure. It was estimated that approximately USD 95 trillion would be needed in public and private investments in energy, transport, water and telecommunications infrastructure at global level between 2016 and 2030 in order to support growth and sustainable development (OECD, 2017[42]). Considering the tight fiscal context, mobilising private sources and building PPPs could help narrow the infrastructure gap.
Public-private partnerships are long-term contractual agreements between the government and a private partner whereby the latter typically finances and delivers public services using a capital asset (e.g. transport or energy infrastructure, hospital or school buildings). The private party may be tasked with the design, construction, financing, operation, management and delivery of the service for a pre-determined period of time, receiving its compensation from fixed unitary payments or tolls charged to users (OECD, 2013[43]). This definition includes both “pure” PPPs (where the main source of revenue is government payments) and concessions (where the main source of revenue is user fees).
Yet, despite a growing proportion of infrastructure services that has been delivered through PPPs in the last decade, PPP-based infrastructure investment are still moderate (OECD, 2018[44]). Most OECD countries report that less than 5% of public sector infrastructure investment took place through PPPs between 2015 and 2018 and PPPs are unevenly used across the world, with lower-income countries lagging behind in that respect. However, albeit of lower average value, PPPs at subnational level are more frequently implemented than at national level.
Governments also provide facilities for R&D, innovation and knowledge transfer (Box 4.2).
Deploying interfaces and platforms
Innovative activities by SMEs can be stimulated through the establishment and sharing of facilities which provide a physical environment for the exchange of knowledge and expertise. They can contribute effectively to knowledge transfer, networking, information dissemination and collaboration among the undertakings and other organisations in innovative clusters.
Clusters’ technological premises, facilities and activities can be developed and financed by industrial partnerships supported by public institutions, with the aim of expanding access to a variety of contributors who otherwise risk being excluded from the innovation process. SMEs could gain access to technologies that they could not afford independently, raising their competitive potential and allowing the whole system to benefit from their innovative contributions (OECD, 2017). Moreover, SMEs operating in clusters might be able to benefit from other agglomeration effects, such as improved access to a pool of skilled labour or capital, as their innovative efforts can become more visible to capital venture investors.
The cooperation among industry and academia include the joint use of research equipment through the institution of common corporate research centres. These centres allow SMEs that would not be able to finance an internal research facility to leverage cutting-edge research equipment, techniques and manpower from universities and public research institutes, thus greatly strengthening their technological capacity.
Another emerging area where governments can provide the platforms to operate is the access to super-computing capabilities by researchers and industry players. This allow them to fully leverage the potential of Big Data. As the infrastructures needed could be extremely expensive, governments have financed and supported public-private research networks in the development and establishment of such facilities, allowing academics, researchers and SMEs in particular to access them for research purposes (Table 4.2).
Promoting SME access to network and knowledge infrastructure
Encouraging SMEs to access key network infrastructure is a policy objective that is mainly addressed through information and awareness campaigns, capacity building initiatives and financing measures.
As regards energy infrastructures, much of the potential lies in promoting the use of energy-efficient systems and the replacement of defective and polluting technologies by new, renewable and smart sources of energy and heat (IEA, 2015[13]).
Possible information measures include the promotion of best practices within each industrial sector and benchmarking information useable by SMEs (IEA, 2011[45]; IEA, 2015[13]).
Capacity building measures cover the promotion of easy-accessible energy audit services realised by qualified engineers, trainings of in-house personnel as well as peer-to-peer experience sharing, participative seminars and workshops (ibid.) (Figure 4.2).
Financial measures are also necessary to tackle the lack access to finance for SMEs, including trainings aiming to develop viable projects and the promotion of financial products for energy-related projects (Table 4.2).
As regards digital infrastructure, a particular focus is being given to promoting digital security among SMEs. In a 2017 OECD survey, 82% of the countries reviewed saw digital security risk awareness by SMEs as a specific objective. However, only 46% of them have developed specific incentives (rewards and/or sanctions) for promoting digital security risk management. Japan and Korea provide tax incentives for companies that invest in digital security products (OECD, 2017[21]).
As regards R&D infrastructure, policy makers support SME and start-up access to frontier know how and state of the art technologies by financing and sustaining incubators and accelerators in regions or sectors with high innovation potential, by boosting the effectiveness of high performing incubators, and by providing access to top quality research and technical talent through secondments of national or international expert advisers (Table 4.2).
Strengthening international co-operation
Recent important changes in the field of energy have been observed in the policy domain and enhanced international co-operation. The Paris Climate Agreement and the adoption of the Sustainable Development Goals (SDGs) by the United Nations gave a strong policy signal for an imperative transition towards a low-carbon economy. Policy commitment has translated into renewed energy technology policy agenda with a focus given to mission-oriented innovation, a new momentum for investments in renewables, better alignment of policies and policy mixes for a low-carbon transition, and increased international co-ordination as to leverage the mix of technologies that are required to achieve a 2oC Scenario.
R&D is another area of active international policy co-ordination.
-
As part of the EU multiannual financial framework (MFF) (2021-27), the European Commission proposed in 2018 an EUR 100 billion allocation to Horizon Europe, a 7-year scientific research programme fostering frontier research, innovation and open science within the European Union. Horizon Europe plans the creation of a European Innovation Council (EIC) and a one-stop shop for innovative firms and start-ups. The programme builds on the previous success of Horizon 2020, which favoured excellence in research through the European Research Council (ERC) and the Marie S.-Curie formation actions and fellowships.
-
The European Commission’s proposal for the 2021-27 MFF also includes EUR 9.2 billion investments in the first Digital Europe programme, with the objective of reinforcing Europe’s strategic digital capacities in high-performance computing, artificial intelligence, cybersecurity and advanced digital skills.
References
[38] Allain-Dupré, D., C. Hulbert and M. Vincent (2017), “Subnational Infrastructure Investment in OECD Countries: Trends and Key Governance Levers”, OECD Regional Development Working Papers, No. 2017/05, OECD Publishing, Paris, https://dx.doi.org/10.1787/e9077df7-en.
[16] Bertschek, I., D. Cerquera and G. Klein (2013), “More bits - more bucks? Measuring the impact of broadband Internet on firm performance”, http://www.dice.hhu.de/fileadmin/redaktion/Fakultaeten/Wirtschaftswissenschaftliche_Fakultaet/DICE/Discussion_Paper/086_Bertschek_Cerquera_Klein.pdf.
[35] Easterling, K. (2014), Extrastatecraft: The Power of Infrastructure Space, Verso.
[32] EC (2018), 2018 EU Industrial R&D Investment Scoreboard, European Commission, http://iri.jrc.ec.europa.eu/scoreboard18.html (accessed on 03 October 2018).
[12] EC (2014), Progress Report on Energy Efficiency in the European Union, European Commission.
[9] Eurochambres (2014), Smart Energy for Growth: SME Actions on Energy Efficiency Powered by Chambers of Commerce and Industry, Eurochambres.
[41] Fu, W. and P. Peng (2013), “A discussion on smart city management based on meta-synthesis method”, Management Science and Engineering, Vol. 8/1, pp. 68-72, https://doi.org/10.3968/j.mse.1913035X20140801.4404.
[17] Haller, S. and S. Lyons (2015), “Broadband adoption and firm productivity: Evidence from Irish manufacturing firms”, Telecommunications Policy, https://doi.org/10.1016/j.telpol.2014.10.003.
[4] Handfield, R. et al. (2013), “Trends and strategies in logistics and supply chain management”.
[13] IEA (2015), Accelerating Energy Efficiency in Small and Medium-sized Enterprises: Powering SMEs to Catalyse Economic Growth, OECD/IEA, https://www.iea.org/publications/freepublications/publication/SME_2015.pdf.
[7] IEA (2014), Capturing the Multiple Benefits of Energy Efficiency, OECD/IEA, http://www.iea.org/publications/freepublications/publication/Multiple_Benefits_of_Energy_Efficiency.pdf.
[45] IEA (2011), 25 Energy Efficiency Policy, OECD/IEA.
[8] IFC (2012), Study on the Potential of Sustainable Energy Financing for Small and Medium Enterprises in China, International Finance Corporation, http://www.ifc.org/wps/wcm/connect/39ecf5004ff94de2acc8ff23ff966f85/China+SME+Report+for+web.pdf?MOD=AJPERES.
[11] IRENA (2014), Renewable Energy in Manufacturing: A Technology Roadmap for REmap 2030, International Renewable Energy Agency, http://www.irena.org/-/media/Files/IRENA/Agency/Publication/2014/IRENA_REmap-2030-Renewable-Energy-in-Manufacturing.pdf.
[37] ITF (2017), ITF Transport Outlook 2017, OECD Publishing, Paris, https://doi.org/10.1787/9789282108000-en.
[28] ITU (2018), The State of Broadband 2018: Broadband Catalyzing Sustainable Development, https://www.itu.int/dms_pub/itu-s/opb/pol/S-POL-BROADBAND.19-2018-PDF-E.pdf (accessed on 03 October 2018).
[29] ITU (2018), World Telecommunication/ICT Indicators Database, December, https://www.itu.int/en/ITU-D/Statistics/Pages/publications/wtid.aspx.
[26] OECD (2019), Main Science and Technology Indicators, OECD, Paris, https://stats.oecd.org/Index.aspx?DataSetCode=MSTI_PUB (accessed on 03 October 2018).
[46] OECD (2019), OECD Broadband Database 2019, OECD, Paris, www.oecd.org/sti/broadband/oecdbroadbandportal.htm (accessed on 02 November 2019).
[25] OECD (2019), OECD ICT Access and Usage by Businesses Database 2019, OECD, Paris, http://stats.oecd.org/Index.aspx?DataSetCode=ICT_BUS (accessed on 12 February 2019).
[27] OECD (2019), OECD International Transport Forum Database 2019, OECD, Paris.
[24] OECD (2019), OECD National Accounts Database 2019, OECD, Paris, http://www.oecd.org/sdd/na/ (accessed on 12 February 2019).
[34] OECD (2019), OECD Research and Development Statistics Database, OECD, Paris, http://www.oecd.org/sti/rds (accessed on 08 March 2019).
[3] OECD (2018), International Migration Outlook 2018, OECD Publishing, Paris, https://doi.org/10.1787/migr_outlook-2018-en.
[30] OECD (2018), OECD Broadband Statistics Database, OECD, Paris, https://doi.org/oecd.org/sti/ict/broadband.
[33] OECD (2018), OECD Regions and Cities at a Glance 2018, OECD Publishing, Paris, https://doi.org/10.1787/reg_cit_glance-2018-en.
[44] OECD (2018), Subnational Public-Private Partnerships: Meeting Infrastructure Challenges, OECD Multi-level Governance Studies, OECD Publishing, Paris, https://dx.doi.org/10.1787/9789264304864-en.
[42] OECD (2017), Investing in Climate, Investing in Growth, OECD Publishing, Paris, https://dx.doi.org/10.1787/9789264273528-en.
[21] OECD (2017), OECD Digital Economy Outlook 2017, OECD Publishing, Paris, https://dx.doi.org/10.1787/9789264276284-en.
[23] OECD (2017), OECD ICT Access and Usage by Businesses Database, OECD, Paris, https://stats.oecd.org/Index.aspx?DataSetCode=ICT_BUS (accessed on 18 July 2018).
[36] OECD (2017), Small, Medium, Strong. Trends in SME Performance and Business Conditions, OECD Publishing, Paris, https://doi.org/10.1787/9789264275683-en.
[19] OECD (2017), The Next Production Revolution: Implications for Governments and Business, OECD Publishing, Paris, https://doi.org/10.1787/9789264271036-en.
[31] OECD (2016), “Managing Digital Security and Privacy Risk”, OECD Digital Economy Papers, No. 254, OECD Publishing, Paris, https://doi.org/10.1787/5jlwt49ccklt-en.
[20] OECD (2016), OECD Science, Technology and Innovation Outlook 2016, OECD Publishing, Paris, https://doi.org/10.1787/sti_in_outlook-2016-en.
[2] OECD (2016), Road Infrastructure, Inclusive Development and Traffic Safety in Korea, OECD Publishing, Paris, https://doi.org/10.1787/9789264255517-en.
[40] OECD (2016), The Smart City Vision and Green Growth in Bandung, OECD, Paris.
[15] OECD (2015), “Development of high speed networks and the role of municipal networks”, Working Party on Communication Infrastructures and Services Policy.
[1] OECD (2015), The Innovation Imperative: Contributing to Productivity, Growth and Well-Being, OECD Publishing, Paris, https://doi.org/10.1787/9789264239814-en.
[39] OECD (2014), Recommendation of the Council on Effective Public Investment Across Levels of Government, OECD, Paris, http://www.oecd.org/regional/regional-policy/Principles-Public-Investment.pdf.
[43] OECD (2013), Government at a Glance 2013, OECD Publishing, Paris, https://dx.doi.org/10.1787/gov_glance-2013-en.
[47] OECD/ITF (2016), Capacity to Grow - Transport Infrastructure Needs for Future Trade Growth, Corporate Partnership Board Report, https://doi.org/10.1787/24108871.
[18] Sorbe, S. et al. (2019), “Digital Dividend: Policies to Harness the Productivity Potential of Digital Technologies”, OECD Economic Policy Paper, No. 26, OECD Publishing, Paris, https://doi.org/10.1787/273176bc-en.
[22] Suurs, R. and E. Roelofs (2014), Biobased Investment Climate in the Netherlands and Europe: Summary Results Quick Scan, TNO, http://www.industrialbiotech-europe.eu/https://www.tno.nl/downloads/Biobased%20economy.pdf (accessed on 21 September 2018).
[10] Thollander, P. and J. Palm (2013), An Interdisciplinary Perspective on Barriers, Energy Audits, Energy Management, Policies, and Programmes: Improving Energy Efficiency in Industrial Energy Systems, Springer-Verlag.
[6] UNEP (2010), PRE-SME - Promoting Resource Efficiency in Small & Medium Sized Enterprises, United Nations Environment Programme, http://www.stenum.at/media/documents/UNEP%20PRE%20SME%20Industrial%20training%20handbook.pdf.
[14] Wouters, C. (2014), “Towards a regulatory framework for microgrids - The Singapore experience”, Sustainable Cities and Society, pp. 22-32.
[5] WTO (2016), World Trade Report 2016: Levelling the Trading Field for SMEs, World Trade Organization, https://www.wto.org/english/res_e/booksp_e/world_trade_report16_e.pdf.
Fixed broadband allows connecting to the Internet though fixed phone or cable lines and can support faster and more data-intensive exchange of information, especially where the fibre optic technology is available. Fixed broadband is for instance more adapted to the use of supercomputing capacity (e.g. R&D), ultrafast data transfer (e.g. gaming, video) or dense urban areas with higher density of individual connections.
Mobile broadband is portable and allows users to connect to the Internet from any smart device and from anywhere where Wi-Fi connections are available. Mobile broadband is a flexible and sometimes more affordable solution for accessing the Internet (e.g. no need for investing in a computer, pay-as-you-go deals, enhanced mobility for traveling or working etc.). In some areas, 4G speeds exceed those of local fixed broadband. Mobile broadband has been determinant for the rise of the sharing economy via a proliferation of mobile applications and services. It is also at the core of the future developments of the Internet of Things (IoT).
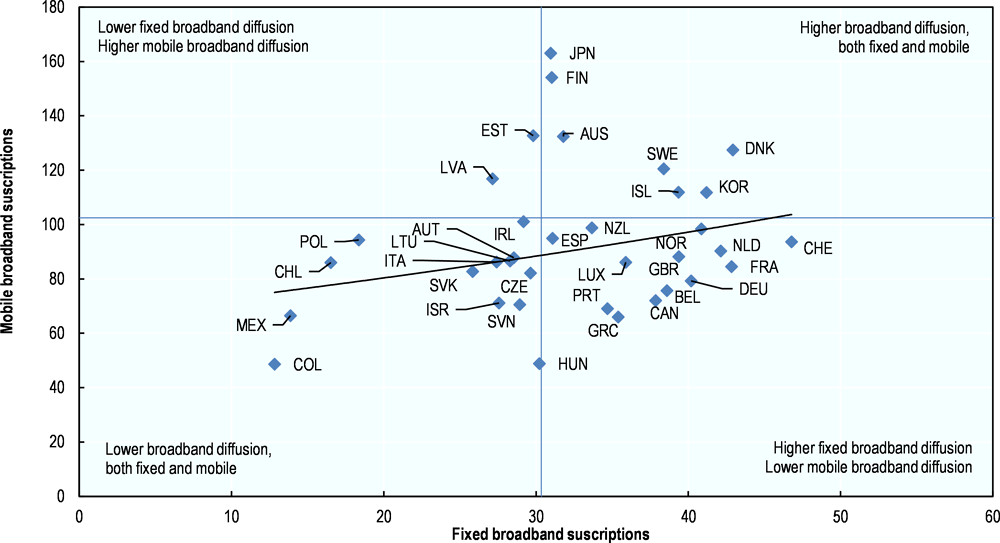
Source: OECD (2019[46]), OECD Broadband Database 2019, www.oecd.org/sti/broadband/oecdbroadbandportal.htm (accessed on 11 February 2019).
Fixed and mobile broadband are complementary. In a sense, all wireless technologies are extensions of fixed networks. For instance, higher penetration rate of fixed broadband networks are likely to improve the proximity to Wi-Fi coverage. In fact, users maintain both fixed and mobile subscriptions and substitute Wi-Fi for fixed connection when at home or at work as to ensure an access to technology at any point in time (OECD, 2017[21]).
Yet current infrastructure capacity restraints the potential of cellular networks for substituting fixed broadband. Smartphones are more and more data-demanding and much more than what mobile telephony was before. Such a substitution would require cellular networks to increase speeds and data allowances up to meet the needs of enough users for them to give up their fixed connection.

Source: OECD/ITF (2016[47]), Capacity to Grow - Transport Infrastructure Needs for Future Trade Growth, https://doi.org/10.1787/24108871.
Notes
← 1. As measured by fixed broadband subscriptions per 100 inhabitants.
← 2. For Colombia data refer to 2016.
← 3. Connections ensuring a minimum download speed of 100Mbit/s.
← 4. https://www.theverge.com/2018/6/15/17467734/5g-nr-standard-3gpp-standalone-finished, https://www.itproportal.com/news/first-worldwide-5g-standard-approved/ and https://www.ecnmag.com/article/2018/05/what-happens-now-5g-standards-are-set (accessed on 30 September 2018).
← 5. https://www.reuters.com/article/us-telecoms-5g-nokia-t-mobile-us/nokia-t-mobile-us-agree-3-5-billion-deal-worlds-first-big-5g-award-idUSKBN1KK1IK, https://www.theverge.com/2018/7/30/17630042/t-mobile-nokia-5g-deal-three-billion-dollars-hardware-software-networking (accessed on 30 September 2018).
← 6. https://www.ft.com/content/21e34e74-bcf0-11e8-94b2-17176fbf93f5 (accessed on 12 February 2019).
← 7. Phishing is a cyberattack making use of emails and clones of legitimate websites for collecting personal information such as usernames, passwords or credit card details.
← 8. Social engineering refers to technics of psychological manipulation aiming to get confidential information. Phishing is an example.
← 9. DoS incidents affect an organisation by flooding its online service or bandwidth with spam requests, knocking it offline for hours or days, http://arstechnica.com/security/2015/11/pay-or-well-knock-your-site-offline-ddos-for-ransom-attacks-surge (accessed 01 October 2018).