Chapter 4. Australia
Support to agriculture
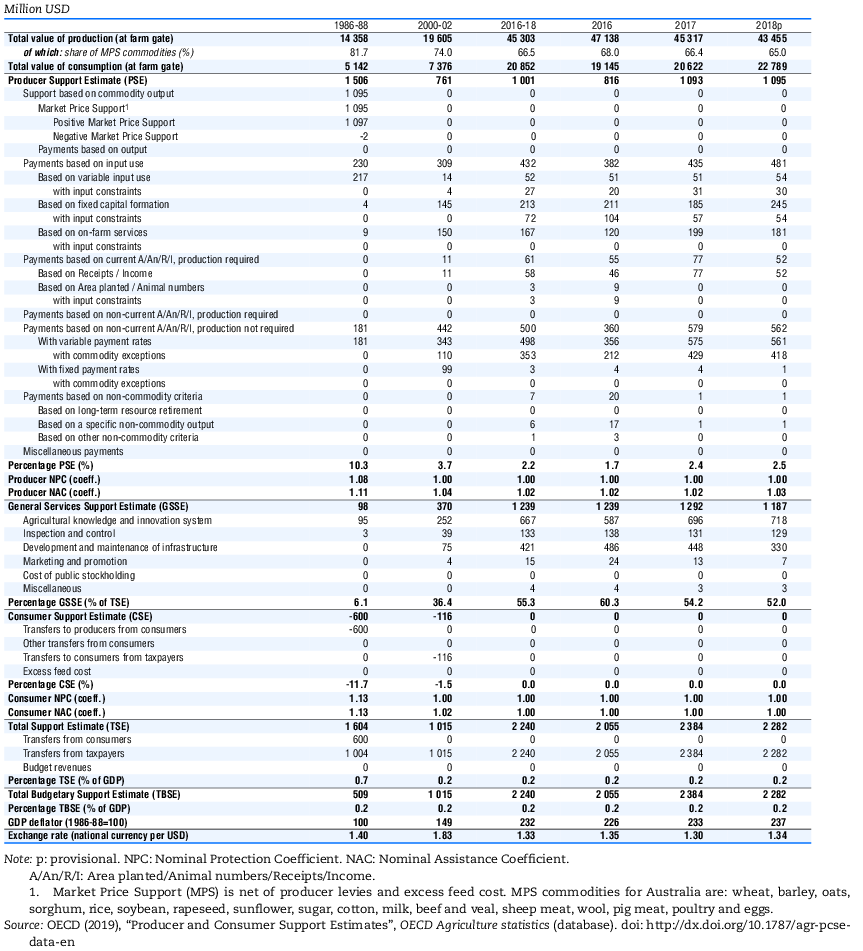
Australia’s support to agricultural producers continues to be amongst the lowest in the OECD, estimated around 2% of gross farm receipts for the period 2016-18, with total support to agriculture (TSE) representing around 0.2% of GDP. Typically, total support to Australian agriculture is roughly split between support directly to producers (PSE) and general services support (GSSE).
Australia no longer uses any policy measures that convey market price support to its producers, meaning that domestic prices for its main agricultural outputs are at parity with world prices. Of the support that is provided directly to producers, around 44% was provided in the form of subsidies to input use in 2018. Much of this relates to measures that provide subsidies for upgrading on-farm water infrastructure to help reduce environmental externalities, and payments that seek to help producers deal better with droughts and other natural adverse events through loans offered at concessional interest rates. The bulk of the remaining producer support is directed towards risk and environmental management, with programmes like income tax averaging arrangements, farm management deposits and other environmental programmes accounting for 51% of the PSE.
Australia has developed an extensive agricultural knowledge and innovation system. In fact, knowledge and innovation services accounts for 60% of GSSE expenditure – support to develop and upgrade infrastructure (28%) represents the bulk of the remainder. Over time, coupled with the move away from producer support, the share of general services in total support has increased from 6% in 1986-88 to 52% in 2018.
Main policy changes
In 2018, the Government announced a range of initiatives that aim to increase the agricultural sector’s resilience to drought. The Australian Government appointed a Coordinator-General for Drought to provide advice on developing a long-term drought resilience and preparedness strategy, and a new National Drought Agreement was signed between the Commonwealth and the states and territories, continuing to shift the policy framework towards prioritising long-term preparedness, sustainability, and resilience and risk management.
The Government also concluded a review into the Australian Standards for the Export of Livestock (ASEL). This review recommended mandatory animal welfare outcomes, better reporting and increased transparency of exporter performance, and the institution of penalties when requirements for shipping live animals are not met on export voyages.
A mandatory code of conduct is being developed for the dairy sector, in response to a multi-year inquiry by the Australian Competition and Consumer Commission (ACCC) into the state of competition in the sector. The inquiry concluded that there are some market competition issues within the industry, particularly in relation to the dynamics between producers and processors.
Australia continued to strengthen its international trade linkages in 2018 through the implementation or signing of various trade agreements. The largest of these was the Comprehensive and Progressive Trans-Pacific Partnership (CPTPP) – an agreement between Australia and 10 other countries, which entered into force on 30 December 2018.
Assessment and recommendations
-
Following continuous and significant progress on policy reform since the mid-1980s, Australia provides low levels of support to its agricultural sector, including negligible use of policy measures that provide the most distorting forms of support. The remaining support programmes target risk management, environmental conservation and provision of general services.
-
Drought policy continues to evolve, as the country’s drought situation continued to intensify in 2018. The new National Drought Agreement signed in December 2018 prioritises long-term preparedness, sustainability, and resilience and risk management. However, at least through 2018, some state and territory governments continued to employ measures that may encourage risk-taking by producers, including the provision of fodder transport subsidies, water transport subsidies, and other ad hoc payments. The more unified approach embodied in the National Drought Agreement is a welcome development to end the sometimes contradictory incentives and better achieve long-term sustainability in the sector.
-
Ensuring farm economic viability in the face of resource constraints – particularly with respect to water – remains the greatest challenge to Australia’s agricultural sector going forward. Recent water reforms have helped to ensure that the scarcity of water is conveyed to producers through pricing mechanisms, and current investments are targeting better water use efficiency at both the farm level and in wider water management basins. Nevertheless, policymakers should continue to evaluate future projects cautiously to ensure that they take into account longer-term climatic projections and do not incentivise maladaptive behaviour that may worsen conditions for the sector’s future.
-
Although there is wide acknowledgement that a changing climate affects Australia’s farmers, the sector’s role in contributing to climate change through emissions remains relatively overlooked in terms of policy response. Some abatements have been purchased through the Emissions Reduction Fund, but a more systematic approach may be needed in future.
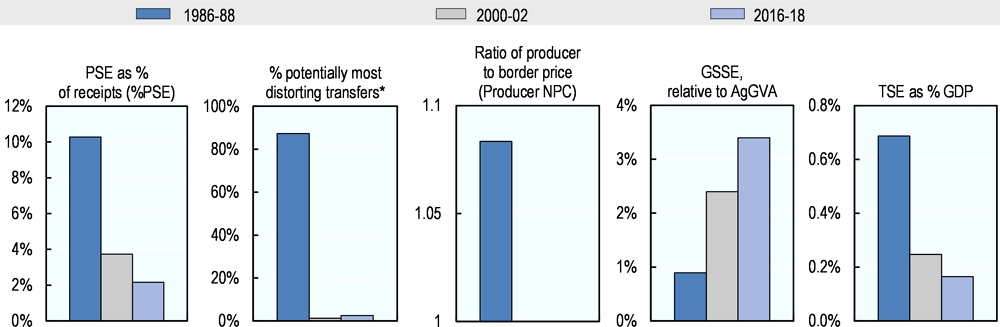
Note: * Share of potentially most distorting transfers in cumulated gross producer transfers.
Source: OECD (2019[1]), “Producer and Consumer Support Estimates”, OECD Agriculture statistics (database), https://doi.org/10.1787/agr-pcse-data-en.
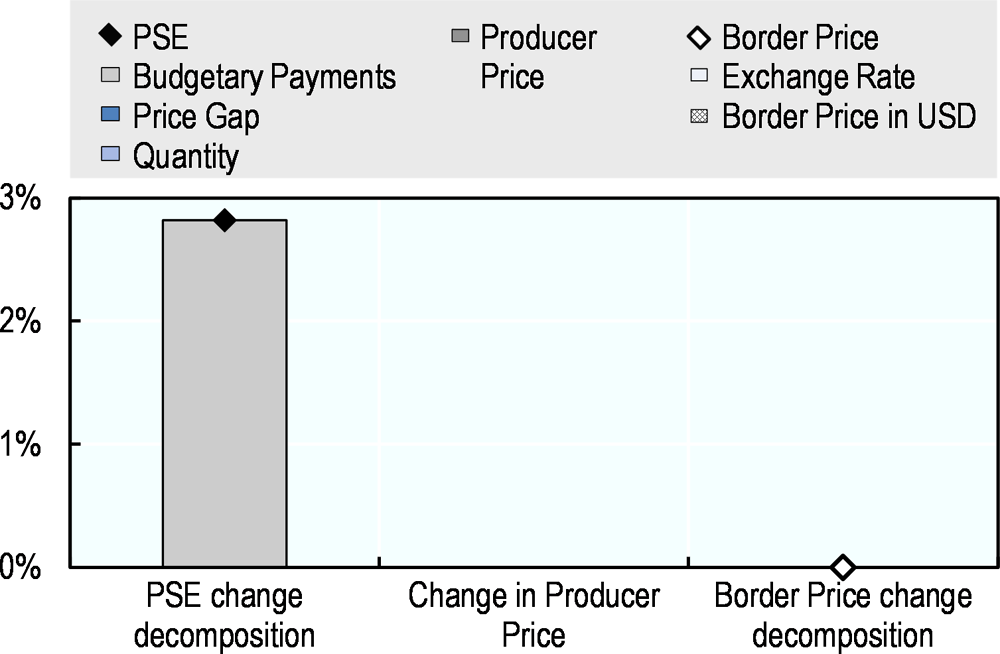
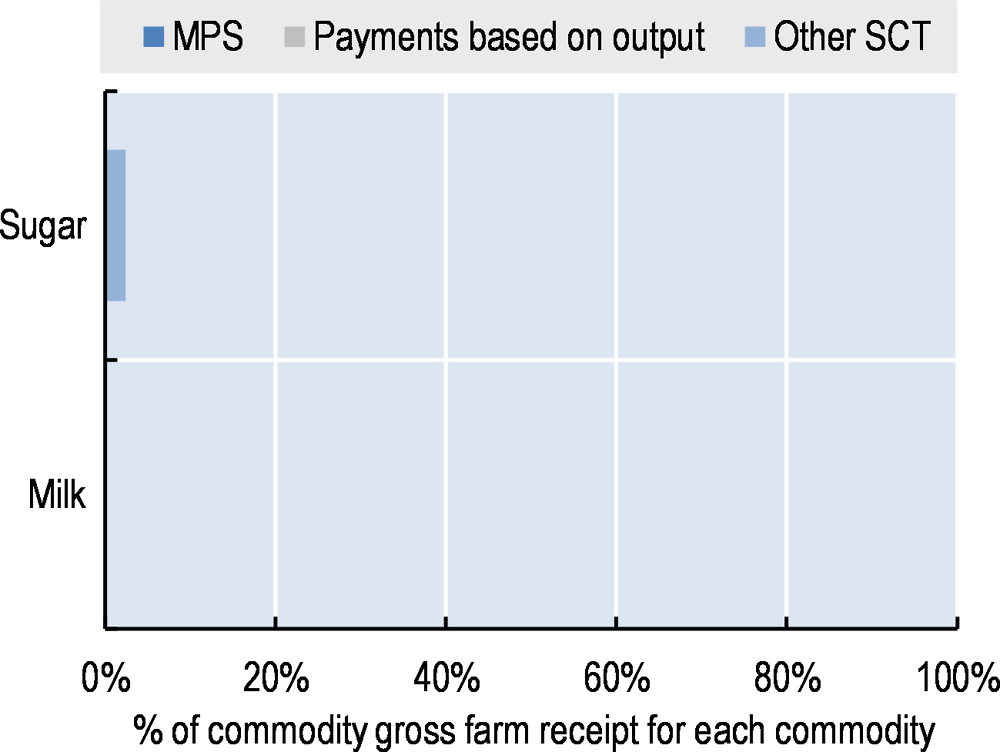
Support to producers (%PSE) has declined gradually over the long term. During 2016-18, support is estimated at 2.2% of gross farm receipts, well below the OECD average (Figure 4.1). The share of potentially most distorting support is low, and now represents a very small share of the already low PSE. Prices received by Australian farmers are on par with international prices, with only sugar producers receiving single commodity transfers (SCT) related to capital subsidies to reduce environmentally detrimental run-off (Figure 4.3). Overall, the value of farm support increased by 3% in 2018, largely due to an increase in spending on higher-efficiency on-farm water infrastructure (Figure 4.2). This limited change in the overall spending level, coupled with a decline in farm receipts between 2017 and 2018, resulted in a slight increase in the %PSE (Table 4.1). Expenditures for general services (GSSE) have generally increased over time, but they fell slightly between 2017 and 2018. Total support to agriculture as a share of GDP has declined significantly over time, with GSSE expenditure representing the majority of support (around 55% from 2016-18).
Source: OECD (2019[1]), “Producer and Consumer Support Estimates”, OECD Agriculture statistics (database), https://doi.org/10.1787/agr-pcse-data-en.
Source: OECD (2019[1]), “Producer and Consumer Support Estimates”, OECD Agriculture statistics (database), https://doi.org/10.1787/agr-pcse-data-en.
Contextual information
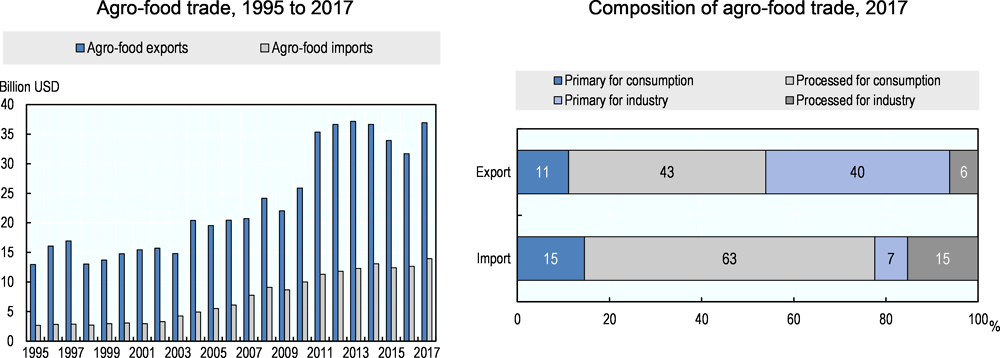
Australia is the world’s 14th largest economy (in 2018) and the sixth largest country by land area, accounting for 10% of all land in the countries included in this report. While ancient and low fertility soils characterise a large share of the total landmass, Australia nevertheless is an important producer and exporter of agricultural products. Agriculture’s share of the economy, both in GDP and in employment, has been falling over time, a trend that has continued in recent years. However, overall, agricultural exports remain significant and accounted for around 16% of total exports in 2017 (Table 4.2).
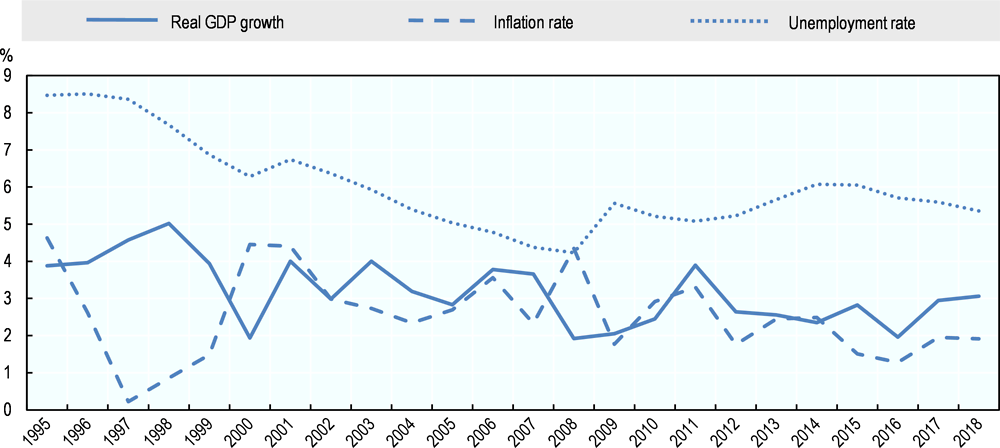
Australia has enjoyed positive economic growth for the past 27 years. In addition, the country has a GDP per capita nearly double the average level of the countries covered in this report (Table 4.2), relatively low unemployment levels and low and stable inflation (Figure 4.4). Australia maintains a positive and growing agro-food trade balance. Around half of Australia’s agro-food exports target final consumption (around 54%) – that is, they are delivered directly to foreign consumers – with the other half exported as intermediate goods that are further processed in overseas markets (Figure 4.5). Australia imports primarily final goods for domestic consumption (around 78% of all agro-food imports). This indicates that domestic food processors are not reliant on imported intermediates for their own production activities, largely due to the ability to source competitively-produced domestic inputs.
Sources: OECD statistical databases; World Bank, WDI and ILO estimates and projections.
Note: Numbers may not add up to 100 due to rounding.
Source: UN Comtrade Database.
Over the 2006-15 period, total factor productivity (TFP) growth in Australia (2.0% per year) outpaced the world average (1.5%), driven by continued structural adjustment and the uptake of innovative technologies and practices in the sector (Figure 4.6). Nevertheless, average TFP growth slowed compared to 1991-2000, partly due to the increasing impact of climate change on the sector (Table 4.3). Water availability is a particularly limiting factor (agriculture is responsible for 27% of all water abstractions), which may be exacerbated by climate change.
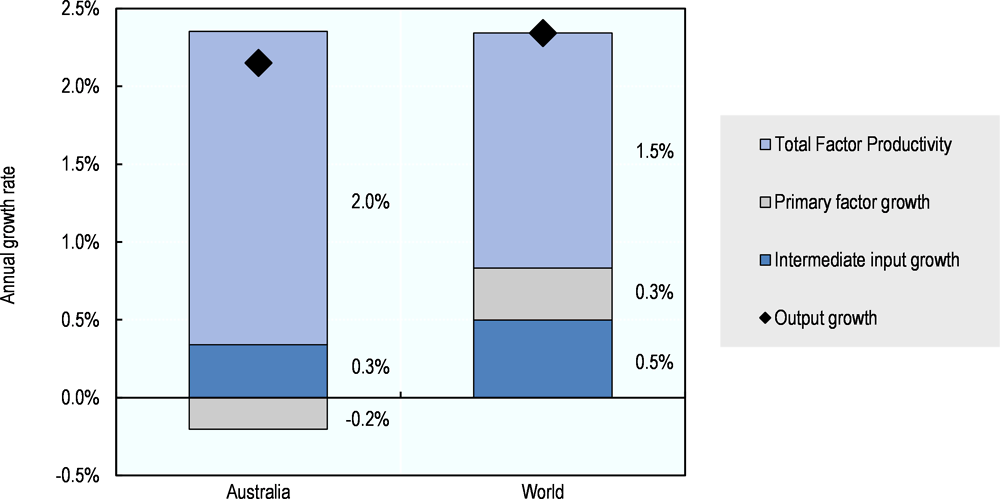
Note: Primary factors comprise labour, land, livestock and machinery.
Source: USDA Economic Research Service Agricultural Productivity database.
Description of policy developments
Main policy instruments
Australia’s agriculture sector remains strongly market oriented with domestic and international prices aligned for all of its major production activities. Support to agriculture is provided through a mix of direct budgetary outlays and taxation concessions. Budget-financed programmes are used to incentivise investments to improve preparedness in the face of risk (weather and market) through concessional loan schemes along with farm household income support during periods of hardship. Direct support is also provided to upgrade on-farm infrastructure with the aim of improving natural resource use and environmental management. Tax concessions form part of the policy approach aimed at helping producers manage production and market risk through allowing them to smooth their incomes and also provide further incentives for on-farm preparedness-related investments.
With a low level of direct government support to producers and no permanent farm subsidy scheme, research and development (R&D) programmes are a major component of Australian support to agriculture. Rural research and development corporations (RDCs) are the Australian Government’s primary vehicle for supporting rural innovation and drive agricultural productivity growth. RDCs are a partnership between the government and industry created to share the funding and strategic direction setting for primary industry R&D, investment in R&D and the subsequent adoption of R&D outputs. A levy system provides for the collection of contributions from farmers to finance RDCs, and the Australian Government provides matching funding for the levies, up to legislated caps.
Australia has negligible tariff protection on imports of agriculture and food products; however, it has in place a number of sanitary and phyto-sanitary (SPS) arrangements to manage pest and disease risks that could harm the sector. These SPS arrangements mean that a number of import restrictions are in place for agricultural products from certain regions across the globe. Australia’s agricultural trade policy is directed towards seeking further market opening in multilateral, bilateral and regional trade agreements.
Australia has eleven comprehensive free trade agreements in force, both regional and bilateral, with New Zealand (ANZCERTA 1983), Singapore (SAFTA 2003), Thailand (TAFTA 2005), the United States (AUSFTA 2005), Chile (AClFTA 2009), the ASEAN-Australia-New Zealand Free Trade Area (AANZFTA 2010), Malaysia (MAFTA 2013), Republic of Korea (KAFTA 2014), Japan (JAEPA 2015), the People’s Republic of China (ChAFTA 2015), and the Comprehensive and Progressive Agreement for Trans-Pacific Partnership (CPTPP 2018).
While no specific policy instruments for agriculture have been developed in response to the 2016 Paris Agreement on Climate Change, Australia has in place a number of policies that include agriculture and will contribute to it meeting its commitment to reduce GHG emissions – including from land-based sectors such as agriculture – by 26-28% by 2030 compared to the 2005 levels, as defined in the Australian Nationally Determined Contribution (NDC). In Australia, the Department of the Environment and Energy leads the development of domestic climate change policy issues across the Australian Government. Australian policy directed towards agriculture seeks to address both adaptation and mitigation, and to develop policy responses that maintain or enhance productivity, profitability and food security.
Australia’s approach to cut emissions across the economy includes the Emissions Reduction Fund (ERF). Under this plan, the government purchases emission reductions from actors in the economy across a range of sectors. For large non-agricultural emitters, a ‘safeguard mechanism’ exists to keep a facility’s emissions within baseline levels which is enforceable by the Clean Energy Regulator under a range of graduated enforcement options ranging from advice to fines to forced corrective actions (Australian Government, 2016[4]). For agriculture, the ERF builds on the Carbon Farming Initiative, a scheme where farmers and land owners were able to earn carbon credits by storing carbon or reducing greenhouse gas emissions on their land. Once registered under the Carbon Farming Initiative, the credits could be sold to those wishing to offset their emissions (Australian Government, 2014[5]).
The ERF is a voluntary scheme that is open to farmers, land managers and other sectors, and allows stakeholders to seek funds (incentives) to undertake emission reductions, avoidance and carbon sequestration (capture and storage of carbon) projects. The methods approved under the ERF must meet strict integrity requirements including in relation to additionality. Under the scheme, landowners and businesses (including farmers) who adopt approved ERF methods can generate Australian Carbon Credit Units, which can be sold, either to the government through a competitive reverse auction, in which sellers engage in price bidding, or to third parties, to provide alternative or additional income streams, while benefitting the environment. The scheme does not set limits on agriculture and is entirely voluntary for the sector.
So far, eight ERF auctions have been held. From these auctions, the Australian Government has contracted a total of 193 million tonnes of abatement compared to estimated annual emissions of 536 million tonnes in the year ending in September 2018. Roughly 9% of these abatements (18.1 million tonnes) was contracted specifically in the agricultural sector, relative to the sector’s annual emissions of 70.3 million tonnes in the year prior to September 2018 (Australian Government Clean Energy Regulator, 2019[4]).
However, despite the integrity requirements in place, a number of studies have questioned the ability of the scheme to deliver additional carbon abatement relative to what may have occurred anyway (Burke, 2016[5]; Freebairn, 2016[6]) and for the funded projects to deliver on their intended reductions. Nevertheless, of the 193 million tonnes contracted in all sectors to date, about 38 million tonnes has been delivered, exceeding scheduled amounts. Much of this rests on the issues around the asymmetric information that exists between the government and private actors. The approach also shifts the burden of emission reduction costs to the government and away from the sectors which generate the emissions themselves.
In 2017, the Australian Government reviewed its climate change policies to ensure that they remain effective in achieving Australia’s international obligations – including the Paris Agreement on Climate Change. As a result of this review, the government plans to develop a long-term emissions reduction strategy by 2020. The strategy will explore the emissions reduction opportunities and implications across all major sectors of the economy (Department of the Environment and Energy, 2017[7]). Because agriculture is a major source of both direct emissions (due to enteric fermentation, emissions from soils, and field burning of agricultural residues) and indirect emissions (conversion of forested land to other uses) (Department of the Environment and Energy, 2018[8]), future climate policies may impact the sector to a greater extent than in the past.
Domestic policy developments in 2018-19
With the country’s drought situation intensifying in 2018, the Australian Government announced a range of initiatives that aim to increase the agricultural sector’s resilience to drought. In December 2018, a new National Drought Agreement was signed between the federal government and the states and territories. The agreement replaced the earlier 2013 Intergovernmental Agreement on National Drought Program Reform, with the intent of continuing to shift the policy framework towards prioritising long-term preparedness, sustainability, and resilience and risk management (DAWR, 2018[9]). In addition, in August 2018, a Coordinator-General for Drought, supported by the Joint Agency Drought Taskforce, was appointed to provide advice to the Australian Government on developing a long-term drought resilience and preparedness strategy (among other tasks). With an eye toward improving preparedness for future events, in November 2018, the government introduced the Future Drought Fund Bill 2018 to Parliament (the bill will need to be reintroduced in the new Parliament in 2019). The Future Drought Fund is a long-term investment fund that will provide a sustainable source of funding for drought resilience projects, including infrastructure development and initiatives that promote the adoption of new technology and improve environmental and natural resource management on farms.
An independent review of the Farm Household Allowance (FHA) was undertaken in the second half of 2018. The panel provided its final report to Government in February 2019. The review examined the effectiveness of the programme in supporting farm families confronting hardship (including as a result of drought), and gave recommendations for improvements. The report was publicly released on 1 May 2019.
Support for 15 rural Australian communities impacted by water recovery in the Murray-Darling Basin was made available through the Murray-Darling Basin Economic Development Program – one component of the new “Basin Plan Commitments Package”. Launched in January 2018, the programme provides up to AUD 20 million over four years to fund economic development projects in the eligible communities. The eligible communities are highly dependent upon agriculture for their economic livelihoods. As such, changes to water availability as a consequence of the Murray-Darling Basin Plan have had non-trivial knock-on effects for these communities in terms of farm sector employment.1 In response, funded projects under the programme will create employment opportunities and enhance community resilience by improving their ability to manage current and future economic challenges (DAWR, 2019[10]).
In April 2018, a final report on the state of competition in the Australian dairy industry was released by the Australian Competition and Consumer Commission (ACCC – an independent statutory authority responsible for the promotion of competition and fair trade in markets in Australia), ending a multi-year inquiry (ACCC, 2018[11]). The report’s major findings included:
-
Processors have significant bargaining power over farmers, and as a consequence, processors have a disproportionate level of discretion to pass on risk to farmers.
-
Contracting arrangements between processors and farmers are favourable to processors, including by limiting the ability of farmers to switch between processors and hampering transparency in milk pricing.
-
Most regional markets for the acquisition of raw milk are concentrated or highly concentrated, such that further consolidation is likely to exacerbate the poor bargaining position of farmers.
-
Supermarkets in turn have a strong bargaining power over processors, enabling them to negotiate low wholesale prices and reduce the profit margins of processors – as a result, even if retail milk prices were to rise, it is unlikely that farmers would benefit.
Given their findings on the state of competition, price transparency and contracting practices in the industry, the ACCC made various recommendations to promote improved supply chain dynamics that would foster more efficient production and supply of dairy products in Australia. Many of these recommendations stressed the importance of simpler and more transparent contracting agreements between farmers and processors.
In anticipation of the report’s release, the dairy sector developed a voluntary code of conduct that came into effect in June 2017 (OECD, 2018[12]). This code was an industry-based attempt to resolve issues around contracting and pricing between dairy farmers and processors, and was adopted by most major processors and a number of farmer representative organisations. However, the ACCC determined that a voluntary code was not sufficient to address the identified market issues, and instead recommended the institution of a mandatory code of conduct. The government is currently developing this mandatory dairy code of conduct, and it is expected to come into force in 2020.
In January 2019, the Australian Government unveiled the Rural Intelligence Platform – a new software designed to integrate data from multiple sources to facilitate the comprehensive assessment and monitoring of rural land for improved decision-making. For example, the platform can inform calculations of the risks associated with certain investments or management decisions. The platform will bring together information from the Commonwealth Scientific and Industrial Research Organisation (CSIRO) and the Bureau of Meteorology (among others) to track land changes in farming regions, incorporating machine learning and artificial intelligence in its assessments and forecasting tools. The system is designed to give farmers better access to data and technologies for long-term decision-making purposes.
There is also ongoing work in the areas of livestock welfare and traceability. In 2017, the Department of Agriculture and Water Resources commissioned a review of the Australian Standards for the Export of Livestock (ASEL), with the goal of ensuring that animal welfare standards for livestock are both up-to-date and adequate to manage risks to animal health and welfare during live animal export by sea and air. The review was undertaken in stages. First, an independent scientific review was completed in May 2018, which recommended that mandatory mortality reporting requirements, voyage success and risk parameters for livestock export should be based on a range of welfare measures, rather than mortality rates as is currently the case. In response to the independent scientific review, the government is reviewing current methods for Heat Stress Risk Assessment (HSRA), with the goal of providing improved guidance on how to move from a risk assessment framework based on mortality to one based on the risk of the animal becoming affected by heat. In the second stage of the process, a review of the Australian Standards for the Export of Livestock was released in September 2018. This review recommended that ASEL mandate animal welfare outcomes – not merely processes – and increase transparency to improve enforcement of said outcomes. Moreover, the review recommended that exporters should pay penalties when welfare outcomes are not achieved, or when the exporters otherwise do not comply with ASEL requirements (ASEL Review Technical Advisory Committee, 2018[13]). Implementation of the review’s recommendations will be carried out in consultation with industry (DAWR, 2018[14]).
The government is currently developing a National Traceability Framework. Beginning in November 2017, an assessment of the current state of traceability systems for the primary agricultural commodities was carried out, along with a review of global drivers for the future of traceability. The findings of the initial assessment will inform the development of the Framework, with the goal of enhancing the integrity of government and industry systems that enable tracing of agricultural production and products both backward and forward along entire supply chains. The final National Traceability Framework and Action plan are expected to be released in mid-2019 (DAWR, 2019[15]).
Trade policy developments in 2018-19
In December 2017, a new export regulation, the Export Control Bill 2017, was introduced into the Australian parliament. This legislation was drafted in response to a 2015 review of the country’s export framework, which concluded that the existing export legislation could lead to inefficient export procedures, increase transaction costs, and delay the clearance of agricultural goods for export, potentially reducing the competitiveness of Australia’s agricultural export sector. The proposed legislation seeks to consolidate existing export rules defined in 17 different Acts into one Bill, thereby streamlining regulations, reducing the potential for redundant procedures, and lowering the cost of complying with export controls. The Department of Agriculture and Water Resources is currently drafting updated rules and reviewing its export systems to identify improvements to operational controls in line with the new Act. Subject to the Bill being passed, the government plans to implement the new law by April 2020.
Australia concluded negotiations for various FTAs in 2018, with the largest of these being the Comprehensive and Progressive Trans-Pacific Partnership (CPTPP). Australia signed the agreement – along with the 10 additional member countries – in March 2018. The CPTPP then entered into force on 30 December 2018 for Australia, Canada, Japan, Mexico, New Zealand and Singapore. It subsequently entered into force for Viet Nam on 14 January 2019, and will enter into force for the remaining member countries 60 days after they ratify the agreement. This agreement contains a number of provisions on agriculture, with expanded market access for a range of products in the various member countries, including reduced Japanese beef tariffs; new access to dairy products into Japan, Canada, and Mexico; and the elimination of all tariffs on sheep meat, cotton, and wool (DFAT, 2019[16]).
Australia also concluded negotiations for several other agreements in 2018, but which have yet to enter into force. These include the Peru-Australia Free Trade Agreement (PAFTA), the Indonesia-Australia Comprehensive Economic Partnership Agreement (IA-CEPA), and the Australia-Hong Kong Free Trade Agreement. These agreements are expected to advance economic integration between the signatory countries in addition to improving market access. The agreements secure tariff reductions or new quotas for some of Australia’s most important agricultural exports, including beef, sheep meat, dairy, and sugar (DFAT, 2018[17]; DFAT, 2018[18]; DFAT, 2018[19]).
Australia is currently engaged in a further seven FTA negotiations. These include two individual bilateral FTA negotiations with India and the European Union. In addition, there are five plurilateral FTA negotiations underway – the Gulf Cooperation Council (GCC), the Environmental Goods Negotiations (undertaken in conjunction with 45 other WTO member countries), the Pacific Alliance Free Trade Agreement, the Regional Comprehensive Economic Partnership Agreement (RCEP) and the Trade in Services Agreement (TiSA) (DFAT, 2018[20]).
References
[11] ACCC (2018), Dairy Inquiry: Final Report, Australian Competition and Consumer Commission, Canberra, https://www.accc.gov.au/system/files/1395_Dairy%20inquiry%20final%20report.pdf.
[13] ASEL Review Technical Advisory Committee (2018), Review of the Australian Standards for the Export of Livestock: Sea Transport - Final Report, Department of Agriculture and Water Resources, Canberra, http://www.agriculture.gov.au/SiteCollectionDocuments/animal/review-asel-sea-transport-final-report.pdf (accessed on 4 April 2019).
[2] Australian Government (2016), The Safeguard Mechanism - Overview, Department of the Environment and Energy, Canberra, http://www.environment.gov.au/system/files/resources/8fb34942-eb71-420a-b87a-3221c40b2d21/files/factsheet-safeguard-mechanism.pdf (accessed on 29 March 2019).
[3] Australian Government (2014), Emissions Reduction Fund White Paper, https://www.environment.gov.au/system/files/resources/1f98a924-5946-404c-9510-d440304280f1/files/erf-white-paper.pdf (accessed on 1 April 2019).
[4] Australian Government Clean Energy Regulator (2019), Auction December 2018, http://www.cleanenergyregulator.gov.au/ERF/Auctions-results/december-2018 (accessed on 29 March 2019).
[5] Burke, P. (2016), “Undermined by Adverse Selection: Australia’s Direct Action Abatement Subsidies”, CCEP Working Paper, No. 1605, Crawford School of Public Policy, The Australian National University, https://doi.org/10.2139/ssrn.2783542.
[10] DAWR (2019), Murray–Darling Basin Economic Development Program - Department of Agriculture and Water Resources, http://www.agriculture.gov.au/water/mdb/programs/basin-wide/edpgrants (accessed on 29 March 2019).
[15] DAWR (2019), National Traceability Project, http://www.agriculture.gov.au/market-access-trade/traceability-project (accessed on 13 March 2019).
[9] DAWR (2018), National Drought Agreement, http://www.agriculture.gov.au/SiteCollectionDocuments/ag-food/drought/drought-policy/national-drought-agreement.pdf (accessed on 13 March 2019).
[14] DAWR (2018), Review of the Australian Standards for the Export of Livestock (ASEL), http://www.agriculture.gov.au/animal/welfare/export-trade/review-asel (accessed on 13 March 2019).
[8] Department of the Environment and Energy (2018), Quarterly Update of Australia’s National Greenhouse Gas Inventory: September 2018, http://www.environment.gov.au/system/files/resources/4391288e-fc2b-477d-9f0b-99a01363e534/files/nggi-quarterly-update-sept-2018.pdf (accessed on 1 April 2019).
[7] Department of the Environment and Energy (2017), 2017 Review of Climate Change Policies, http://www.environment.gov.au/system/files/resources/18690271-59ac-43c8-aee1-92d930141f54/files/2017-review-of-climate-change-policies.pdf (accessed on 1 April 2019).
[16] DFAT (2019), CPTPP Outcomes at a Glance, https://dfat.gov.au/trade/agreements/in-force/cptpp/outcomes-documents/Pages/cptpp-outcomes-at-a-glance.aspx (accessed on 13 March 2019).
[19] DFAT (2018), Australia-Hong Kong Free Trade Agreement: Outcomes at a Glance, https://dfat.gov.au/trade/agreements/not-yet-in-force/a-hkfta/Pages/a-hkfta-outcomes.aspx (accessed on 13 March 2019).
[20] DFAT (2018), Australia’s Free Trade Agreements (FTAs), https://dfat.gov.au/trade/agreements/Pages/trade-agreements.aspx (accessed on 13 March 2019).
[18] DFAT (2018), Indonesia-Australia Comprehensive Economic Partnership Agreement: Outcomes, https://dfat.gov.au/trade/agreements/not-yet-in-force/iacepa/Pages/ia-cepa-key-outcomes-for-australia.aspx (accessed on 13 March 2019).
[17] DFAT (2018), PAFTA Outcomes: Goods Market Access, https://dfat.gov.au/trade/agreements/not-yet-in-force/pafta/pafta-outcomes/Pages/pafta-outcomes-goods-market-access.aspx (accessed on 13 March 2019).
[6] Freebairn, J. (2016), “A Comparison of Policy Instruments to Reduce Greenhouse Gas Emissions”, Economic Papers, Vol. 35/3, pp. 204-215, https://doi.org/10.1111/1759-3441.12141.
[21] Murray-Darling Basin Authority (2018), Southern Basin Community Profiles, Basin Plan Evaluation, https://www.mdba.gov.au/publications/mdba-reports/southern-basin-community-profiles.
[1] OECD (2019), “Producer and Consumer Support Estimates”, OECD Agriculture statistics (database), https://doi.org/10.1787/agr-pcse-data-en.
[12] OECD (2018), Agricultural Policy Monitoring and Evaluation 2018, OECD Publishing, Paris, https://dx.doi.org/10.1787/agr_pol-2018-en.
Note
← 1. For example, published profiles for the Southern Basin communities estimate that Basin Plan factors led to a 10-25% contraction in farm employment for most communities between 2001-16 (Murray-Darling Basin Authority, 2018[21]).