
1. General assessment of the macroeconomic situation
The war in Ukraine has generated a major humanitarian crisis affecting millions of people. The associated economic shocks, and their impact on global commodity, trade and financial markets, will also have a material impact on economic outcomes and livelihoods. Prior to the outbreak of the war the outlook appeared broadly favourable over 2022-23, with growth and inflation returning to normality as the COVID-19 pandemic and supply-side constraints waned. The invasion of Ukraine, along with shutdowns in major cities and ports in China due to the zero-COVID policy, has generated a new set of adverse shocks. Global GDP growth is now projected to slow sharply this year to 3%, around 1½ percentage points weaker than projected in the December 2021 OECD Economic Outlook, and to remain at a similar subdued pace in 2023 (Table 1.1). In part, this reflects deep downturns in Russia and Ukraine, but growth is set to be considerably weaker than expected in most economies, especially in Europe, where an embargo on oil and coal imports from Russia is incorporated in the projections for 2023. Commodity prices have risen substantially, reflecting the importance of supply from Russia and Ukraine in many markets, adding to inflationary pressures and hitting real incomes and spending, particularly for the most vulnerable households. In many emerging-market economies the risks of food shortages are high given the reliance on agricultural exports from Russia and Ukraine. Supply-side pressures have also intensified as a result of the conflict, as well as the shutdowns in China. Consumer price inflation is projected to remain elevated, averaging around 5½ per cent in the major advanced economies in 2022, and 8½ per cent in the OECD as a whole, before receding in 2023 as supply-chain and commodity price pressures wane and the impact of tighter monetary conditions begins to be felt. Core inflation, though slowing, is nonetheless projected to remain at or above medium-term objectives in many major economies at the end of 2023.
The uncertainty around this outlook is high, and there are a number of prominent risks. The effects of the war in Ukraine may be even greater than assumed, for example because of an abrupt Europe-wide interruption of flows of gas from Russia, further increases in commodity prices, or stronger disruptions to global supply chains. Inflationary pressures could also prove stronger than expected, with risks that higher inflation expectations move away from central bank objectives and become reflected in faster wage growth amidst tight labour markets. Sharp increases in policy interest rates could also slow growth by more than projected. Financial markets have so far adjusted smoothly to tighter global financial conditions, but there are significant potential vulnerabilities from high debt levels and elevated asset prices. Challenges also remain for many emerging-market economies, from rising food and energy prices, the slow recovery from the pandemic, high debt, and the potential for capital outflows as interest rates rise in the advanced countries. Risks also remain from the evolution of the COVID-19 pandemic: new more aggressive or contagious variants may emerge, while the application of zero-COVID policies in large economies like China has the potential to sap global demand and disrupt supply for some time to come.
The substantial economic costs of the war, elevated uncertainty, and the forthcoming embargo on coal and seaborne oil imports from Russia in Europe add to the challenges already facing policymakers from rising inflationary pressures and the imbalanced recovery from the pandemic:
Faced with an adverse supply shock of uncertain duration and magnitude from higher commodity prices, monetary policy should remain focused on ensuring well-anchored inflation expectations. This calls for a differentiated response across the major advanced economies. The case for a relatively quick normalisation is particularly strong in the United States, Canada and many smaller European countries, where the recovery in demand from the pandemic is well advanced and broad-based inflation pressures were already apparent ahead of the recent commodity price surge. Removing accommodation more gradually is appropriate in economies where core inflation is lower, wage pressures remain modest and the impact of the conflict and the future embargo on growth is greatest. Further policy rate increases are likely to be needed in many emerging-market economies to help anchor inflation expectations and avoid destabilising capital outflows.
Temporary, timely and well-targeted fiscal measures, where feasible, provide the best policy option to cushion the immediate impact of the commodity and food price shocks on vulnerable households and companies and provide support for refugees from the war. Many countries have appropriately slowed plans for gradual fiscal consolidation in the aftermath of the pandemic, at least until 2023, but consolidation should not be delayed where demand pressures are clearly apparent in inflation. Over the medium and long term, the conflict in Ukraine is raising new fiscal priorities, including accelerated investment in clean energy and higher defence spending, reinforcing the need for a thorough reassessment of the composition of the public finances. Credible fiscal frameworks with strong national ownership can help to provide clear guidance about the medium-term trajectory of the public finances and mitigate concerns about debt sustainability.
The pandemic and the war in Ukraine have exposed many longstanding structural weaknesses, which have been felt unequally across households, firms and countries. Effective and well-targeted reforms are needed to boost resilience, revive productivity growth, address persisting inequality and accelerate reductions in carbon emissions. International co-operation will need to be preserved to improve prospects for sustainable and equitable longer-term growth by keeping markets open to trade, helping developing countries overcome the COVID-19 pandemic and reduce debt burdens, and enabling more ambitious and effective collective actions on climate change.
The war has underlined the vulnerability of energy and food security given the dependence of many countries on exports from Russia or Ukraine. Substantial, but not complete, diversification of energy sources can be achieved relatively quickly in some countries, as highlighted by the plans for oil and gas imports set out by the International Energy Agency. Providing regulatory and fiscal incentives to move towards alternative energy sources and invest in innovation and infrastructures are both important steps to help develop clean energy supply and spur energy efficiency. Some progress in this direction has been made in recent public investment plans but more needs to be done to meet the commitments made at COP26. Food security has also become a more pressing concern given the acute risk of economic crises in some developing economies and sharp increases in poverty and hunger. To monitor and mitigate such risks, all countries must provide the assistance necessary to facilitate the planting of new crops, including in Ukraine, tackle logistical barriers limiting the supply of food to countries most at risk, and refrain from export restrictions on food and other agricultural products.

The Russian invasion of Ukraine is a humanitarian crisis affecting millions of people. Beyond the tens of thousands of deaths and injuries, close to 7 million people have already been forced to flee Ukraine to other countries in Europe, and an even greater number have been displaced within the country. The war is also a severe economic shock, above all in Ukraine itself, but also in Russia, the neighbouring region, and even in more distant parts of the world (OECD, 2022a).
The effects of the war are being felt through many channels. Large output declines in Russia and Ukraine directly shrink global economic activity and reduce demand for output from other countries. This effect is relatively modest, given the limited direct role of Russia and Ukraine in global activity and trade, but could still reduce global growth this year by over ¼ percentage point at market prices and by close to ½ percentage point in PPP terms.1
The major influence of Russia and Ukraine on the global economy is via their role as important suppliers in a number of commodity markets. Together they account for about 30% of global exports of wheat, 15% for corn, 20% for mineral fertilisers and natural gas, and 11% for oil. In addition, global supply chains are dependent on Russian and Ukrainian exports of metals (see below) and inert gases. The prices of many of these commodities increased sharply after the onset of the war, even in the immediate absence of any significant disruption to production or export volumes (Figure 1.1).
The surge in commodity prices and the possible disruptions to production will have significant consequences for many economies, particularly emerging-market and developing economies (Box 1.1). A particular concern is that a cessation of wheat exports from Russia and Ukraine could result in serious food shortages in many developing economies. There would be an acute risk not only of economic crises in some countries but also humanitarian disasters, with a sharp increase in poverty and hunger. The food supply shock could be compounded by fertiliser shortages and price rises, with Russia and Belarus major suppliers in many countries, putting agricultural output next year and perhaps beyond under stress.
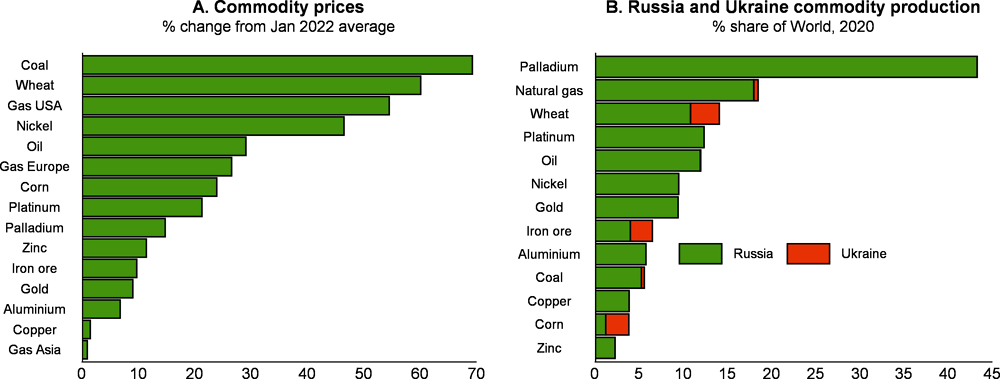
Note: Data in Panel A are based on an average of daily prices between February 24 2022 and June 1 2022 for all commodities apart from wheat and corn, which are based on average prices over March-May 2022.
Source: Refinitiv; International Energy Agency; OECD Agricultural Outlook database; World Bank; and OECD calculations.
The war and the sanctions on Russia are also causing disruptions through financial and business linkages.2 Sanctions placed on Russia have targeted selected individuals and banks, reduced access to foreign capital and frozen access to the foreign exchange reserves held by the Central Bank of Russia (CBR) in Western economies. Bans have also been imposed on some exports to Russia. As a result, the CBR has tightened monetary policy and imposed capital controls, and risk premia on Russian sovereign debt have widened. Selective export bans and delays and difficulties in making international payments are disrupting trade – Russian imports have plummeted since the start of the war – and could result in formal defaults on dollar-denominated Russian debts, with US banks now prohibited from handling US dollar payments from Russia. Financial market conditions around the world have also tightened, including in many economies in Central and Eastern Europe with relatively strong business ties with Russia. Air and sea traffic have been disrupted (see below) and many multinational companies have suspended operations in Russia.
The refugee flows caused by the war will result in additional public expenditure in the short term in host countries, although this will be offset over time as refugees enter the labour force, helping to alleviate some labour market pressures. The number of people who have already fled Ukraine since the start of the war is several times greater than the annual flow of asylum-seekers into Europe at the height of the Syrian refugee crisis in 2015-16. Supporting the refugees from Ukraine involves upfront spending on housing, food, medical assistance and childcare and schooling, along with assistance to help those who stay to enter the labour market. The scale of the spending challenge is difficult to predict due to uncertainty about the number of refugees, the length of time they will stay, and which country they may move to. An illustrative estimate, using current support for refugees, points to a minimum expenditure in European Union (EU) countries of around 0.2% of EU GDP (Box 1.2). This spending could be covered by the resources already made available in various EU funds.
Energy imports by the European economies from Russia are set to fall sharply in 2023. The EU has agreed an embargo on coal imports from Russia, to take effect in August, and an embargo on seaborne oil imports from Russia to begin in 2023. In addition, some countries have, or will, bilaterally end imports of gas and pipeline imports of oil from Russia this year, and Russia has halted gas exports to a few EU member states. These changes are incorporated in the baseline projections. A Europe-wide end to most oil imports from Russia brings challenges, with petroleum products (including crude oil) accounting for over one-third of total energy use in the EU. Even if alternative supplies can be found on world markets at higher prices and shortages avoided, as assumed in the baseline projections, the embargo is projected to push up inflation and weaken growth, particularly in Europe. The challenges in adjusting to the embargo, the risks of possible adverse supply-side effects and the impact of an additional EU embargo on gas imports from Russia are discussed further below.
The disruptions in commodity markets brought about by the war in Ukraine will likely have strong economic and social impacts on emerging-market economies. Current accounts, and through them the income of the private and public sectors, are being affected by soaring commodity prices, to the benefit of net commodity exporters and the detriment of net importers. In addition, the available quantities of certain commodities are also under strain. Agricultural commodities are of particular concern on this count, since Russia and Ukraine are two major suppliers of cereals and fertilisers.
Current account effects
The current account effects of the commodity price shock depend on countries’ net export positions and the size of the price shocks for individual commodities. Both aspects – variation in net exports and the magnitude of the price shock – tend to be larger for energy commodities than for food or metals. An illustrative estimate of the potential annual gains (or losses) from the abrupt price changes that have been observed since the outbreak of the war in Ukraine is shown in Figure 1.2. For each country and commodity, the average net exports-to-GDP ratio over 2015-19 is multiplied by the respective price shock since the invasion of Ukraine, with the effects aggregated by broad commodity categories.1 The use of a five-year period helps to minimise the potential sensitivity of the results to exceptional events, such as droughts or strikes.2 These calculations isolate the impact of trade of selected commodities and do not incorporate possible changes in consumption patterns in response to price changes, or in non-commodity trade that could affect aggregate saving-investment balances. Hence, the depicted gains or losses should not be regarded as estimates of expected changes in overall current account balances.
Colombia, Indonesia, Russia and Saudi Arabia, all large energy exporters, gain from improvements in their terms of trade. In contrast, Bulgaria, India, Thailand and Türkiye could suffer significant losses.3 Bulgaria and Romania benefit from the sharp rise in wheat and maize prices, and Chile from higher metals prices, but these fall short of the costs from rising energy prices. Rising food prices are likely to yield moderate gains to Argentina, but sizeable income losses in Egypt and Tunisia.
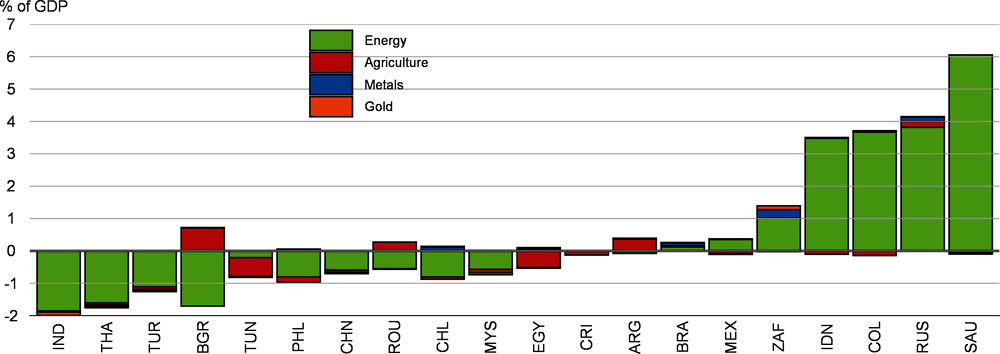
Note: The illustrative effects reflect the impact of the sharp rise in commodity prices following the war in Ukraine applied to the average commodity-level net exports-to-GDP ratio during 2015-19. The commodity price shock used in the analysis is the percentage difference in the average price of selected commodities over the period from February 24 to June 1 relative to the average price in January 2022. The selected commodities include natural gas, oil, coal, wheat, maize, nickel, platinum, palladium, iron ore, aluminium, zinc, copper and gold. Net energy exports are computed using IEA volume estimates converted to values using world prices. Oil and coal prices are based on Brent spot prices and Australian steam coal spot prices, respectively. For natural gas, regional prices – for Europe, Asia and America – are used. Europe covers Bulgaria, Egypt, Romania, Russia, Tunisia and Türkiye; Asia covers China, India, Indonesia, Malaysia, the Philippines and Thailand, plus South Africa; and America covers Argentina, Brazil, Chile, Colombia and Costa Rica. Net export values of agricultural commodities and metal commodities (in USD) are taken from FAO statistics and from UN Comtrade, respectively. These calculations exclude the impact of commodity price changes on consumption and non-commodity trade that also affect annual changes in the current account balance.
Source: OECD Economic Outlook 111 database; FAO; IEA; Refinitiv; UN Comtrade; World Bank; and OECD calculations.
Emerging-market economies face risks of significant disruptions in agricultural trade
In addition to price effects, the war can also reduce the quantities available on world markets. Russia and Ukraine are two major suppliers of agricultural commodities, especially cereals and fertilisers. Highly disaggregated customs data, covering nearly 5 000 distinct products, help to show which particular markets are most at risk of disruption, and which customers are most exposed to a reduction in production in Russia and Ukraine.
War-related disruptions are particularly likely for cereals and vegetable oils. Russia and Ukraine accounted for about 30% of global exports of durum wheat and meslin and wheat in 2020, 15% of maize, and one-quarter of barley and other cereals (Figure 1.3). Ukraine is also the world’s biggest exporter of vegetable oils (sunflower seed and safflower) and, together with Russia, supplies half of the global market. Overall, the supply of these agricultural commodities is remarkably concentrated, with the five biggest suppliers covering more than half of the world export market, and almost to 80% in some cases. Such a high degree of concentration limits the scope for substitution to other producers in the short run, making these products particularly vulnerable to shocks.
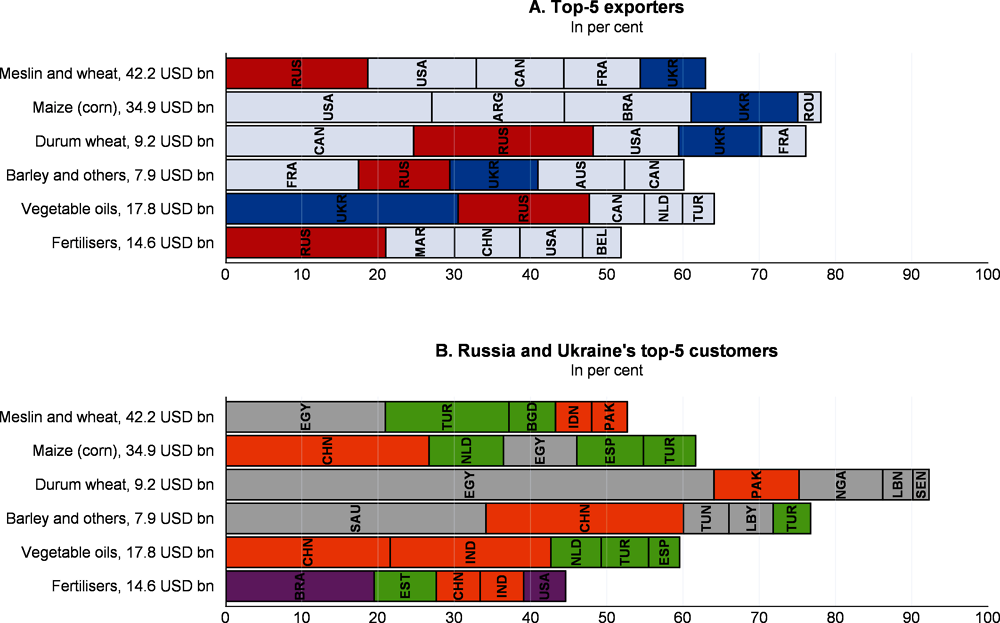
Note: Panel A shows the share of the largest 5 exporting countries as a proportion of total world exports of each commodity. Panel B shows the proportion of Russian and Ukrainian exports bought by the five largest customers for each commodity. The colour indicates the region to which the country buying the Russian or Ukrainian exports belongs: green for Europe, orange for Asia, purple for Americas and grey for Africa and Middle East. The value in USD bn represents global export flows recorded in 2020 for each item (i.e. the size of the market).
Source: BACI database from CEPII; and OECD calculations.
Some countries in Africa and the Middle East, and Central Asia are relatively exposed, particularly if they have low domestic production. Egypt buys two-thirds of the durum wheat exported by Russia and Ukraine, Türkiye one-fifth of the meslin and Saudi Arabia one-third of barley and other cereals. Lower-income countries that are the most dependent on Russian and Ukrainian supply will be the hardest hit and disruptions could threaten food security in those countries (Figure 1.4).
Possible disruptions in the supply of fertilisers could add further pressures (Figure 1.4, Panel D). Russia is a major supplier of fertilisers, as natural gas is a key input in this industry, and accounted for 20% of world exports for some fertilisers in 2020, with a global trade market of USD 15 billion.4 Russia is also one of the five biggest exporters of ammonia and natural calcium phosphates, two components mainly used in the production of fertilisers. Many countries from Central Asia as well as some advanced economies in Northern Europe, are among those most reliant on Russia for their imports of fertilisers. A few African countries are also highly exposed. Shortages of crops and fertilisers would put serious strain on agriculture worldwide.
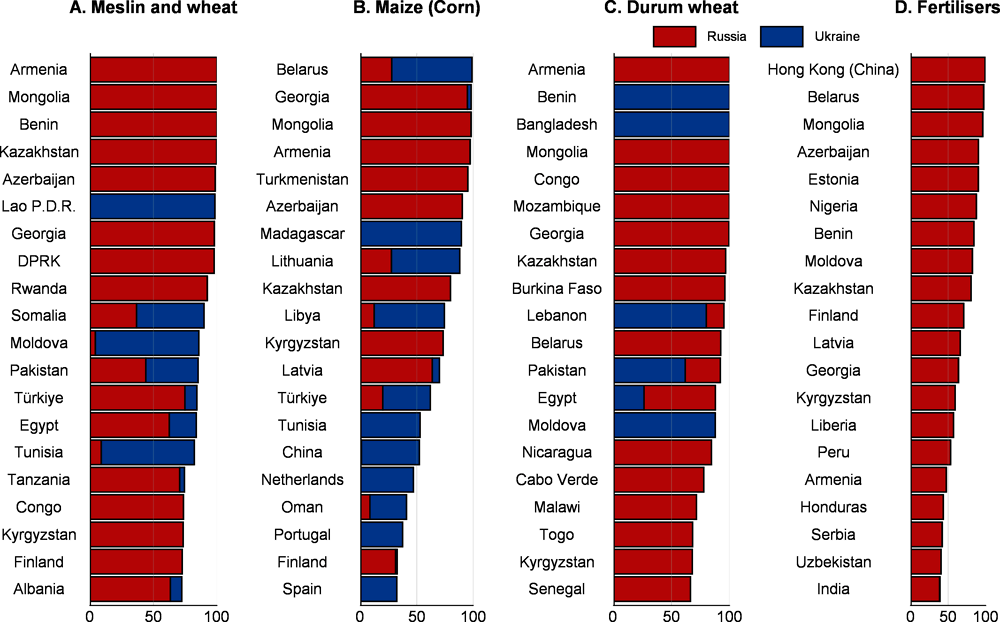
Note: Fertilisers correspond to the aggregation of five products defined at the HS 6-digit level as follows: nitrogenous fertilisers (HS310280), fertilisers containing nitrogen, phosphorus and potassium (HS310520), fertilisers containing mono-ammonium phosphate and di-ammonium phosphate (HS310540), fertilisers containing nitrates and phosphates (HS310551) and fertilisers, mineral or chemical (HS310230).
Source: BACI database (CEPII); and OECD calculations.
← 1. Potential shifts in countries’ net exporting positions at the level of each commodity in response to the price shock or to changes in external demand could alter these illustrative results, but are not taken into account. For natural gas, the prices in the region a country belongs to are used to compute the effects on the current account balance.
← 2. More recent years have not been considered due to the impact of the pandemic (2020-21) or incomplete data (2021).
← 3. The estimated current account gains for Russia should be regarded as an upper bound as Russian oil has been traded at a discount – implied by the positive spread between Brent and Urals spot prices for oil – since the outbreak of the war.
← 4. The group of fertilisers plotted on Figure 1.4 aggregates five separate categories of fertilisers.
There has been an unprecedented outflow of refugees from Ukraine
The war in Ukraine has generated a historic outflow of people fleeing the conflict, unseen in Europe since World War II. The Syrian conflict raged for two years before the number of refugees abroad reached three million in 2015-16, whilst this number was reached in less than 3 weeks for the war in Ukraine. By May 18, according to data from the UNHCR, more than 6.2 million people had fled Ukraine and an additional estimated 8 million were internally displaced. About 5.3 million Ukrainian refugees have reached the European Union. Close to 3.4 million Ukrainians crossed into Poland, almost 930 000 into Romania, 615 000 into Hungary and 427 000 into the Slovak Republic.
This humanitarian crisis cannot be compared easily with previous ones, notably the 2015-16 humanitarian crisis in Europe. Key differences include the large pre-conflict Ukrainian diaspora and its role in the immediate reception of Ukrainian refugees; the pre-existing visa facilitations for Ukrainian nationals in Europe which greatly expedite orderly cross border movements; and the different socio-demographic characteristics of the current refugee inflow, which overwhelmingly consists of children and women with relatively high formal education levels. There has also been an exceptional mobilisation of institutions and host communities in OECD countries.
Daily outflows from Ukraine increased rapidly in the first days of the conflict, peaking at 200 000 in early March, but have now stabilised at around 50 thousand per day. The State Border Guard Service of Ukraine has reported that more than 1.8 million Ukrainians have returned to the country since the start of the war, although this figure may include short-term cross-border movements.
A growing number of refugees are now moving to other OECD countries. OECD estimates suggest that, by May 13, EU countries not bordering Ukraine have already received more than 2 million Ukrainians since February 24. In particular, Germany registered about 610 000 Ukrainians, the Czech Republic 335 000, Spain 135 000 and Italy 113 000. Beyond Europe, more than 28 000 Ukrainians arrived in Israel, 25 000 in Canada and about 37 000 in the United States.
The general mobilisation in Ukraine prevents most men aged 18 to 60 from leaving the country. As a result, very few working age men have left the country so far. Available data for Poland, according to the Office of Foreigners, show for example that out of the one million registrations by end-April, 48% of arrivals were minor children and 92% of the adults were women. Similar numbers are observed in Lithuania. Countries further from the Ukrainian border report a slightly lower share of children, between 32% (France and Greece) and 40% (the Czech Republic and Belgium).
Available information from host countries suggests that a relatively high share of Ukrainian refugees are tertiary educated, in contrast to other refugee groups. Overall, they also have higher levels of education than the general Ukrainian active population (34% of whom were tertiary educated in 2019). In Spain for example, 60% of registered Ukrainians above 16 years old have a tertiary diploma, 25% have a professional qualification, 11% have upper secondary education, and less than 1% are without any education.
A first assessment of the labour market impact of the Ukrainian refugee inflow in Europe
The Ukrainian refugees may make a sizeable contribution to the EU labour market. Their socio-demographic profile, the support they are receiving from the Ukrainian diaspora and host communities and the relatively modest monthly income support available in most countries (see below) all encourage labour force participation. The EU has also provided Ukrainian refugees with immediate and unrestricted access to the labour market.
OECD estimates suggest that as of end-April, there could be 2.3 million Ukrainian refugees aged 20 to 64 in Europe.1 Estimates of possible employment and participation rates by the end of 2022 can be derived using the educational structure observed in Spain, and observed employment and participation rates for refugee women in Europe with less than 5 years of duration of stay, or European third-country migrant women with less than 2 years of duration of stay (Figure 1.5). These point to between 850 thousand and 1.1 million entries to the EU labour market of Ukrainian migrant women aged 20-64, with between 602 and 917 thousand in employment.
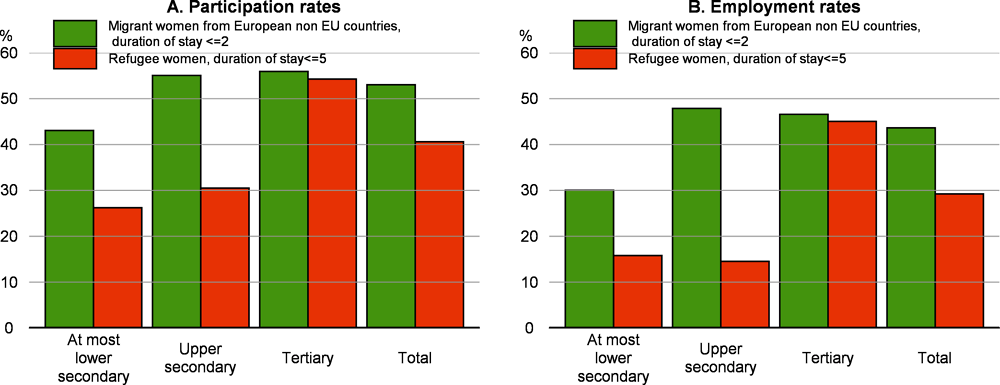
Note: Calculations based on the observed employment and participation rates of migrant women in the EU from non-EU European countries aged 20-64 who have remained for two years or less, and female refugees in EU countries aged 20-64 who have remained for five years or less. Based on data for 2014 and 2019 respectively.
Source: OECD calculations.
These numbers may seem large but should be put in the perspective of the size of the EU labour market (327 million working age population and 240 million employed workers) as well as of regular permanent migration flows (1.3 million new permanent immigrants from non-EU countries in 2019). They can also be compared to temporary migration flows from third countries. For instance, before the COVID-19 pandemic, Poland alone was receiving annually more than one million seasonal and temporary foreign workers, most of whom were from Ukraine. Much of this annual flow will probably be replaced by Ukrainian refugees.
The labour market integration of Ukrainian women may be slower than anticipated due to language barriers, uncertainty about their length of stay and delays in integrating Ukrainian children in the education system. Currently, many children are maintaining some links with the Ukrainian education system via online solutions. This may prevent their single mothers or guardians from immediately seeking work.
How much might the reception of Ukrainian refugees cost in Europe?
All EU countries provide financial support to beneficiaries of temporary protection to cover basic needs, but levels and mechanisms vary widely across countries. Monthly financial allowances also vary within countries, depending on whether refugees are hosted in a reception centre or not, whether they have access to food on site or not and, most importantly, depending on the family composition of the household. Differences in the monthly allocation for single refugees in accommodation provide an indication of the scope of cross-country differences (Figure 1.6). The total per capita cost might also be lower than in 2015-16 because there are no costs from asylum applications, because Ukrainian refugees are mostly concentrated in host countries with a cost of living below the EU average, because access to integration services is more limited and because of the higher proportion of minor children.
A provisional calculation based on the refugee population from Ukraine at the end of April, indicates that the cost for the direct financial support provided to Ukrainian refugees in the EU, including for housing, could be around EUR 17 billion in 2022. This does not include the broader costs for education, health and integration measures. Based on the age structure of the refugee population, these could collectively be just over an additional EUR 9 billion in the ten months of 2022. The reception cost can be compared to the funds made available by the decision of the EU Council in early April. This made it possible for Member States to redirect up to EUR 17 billion from European Structural and Investment Funds (ESIF), the Fund for European Aid for the Most Deprived (FEAD) and the 2022 tranche of the EU recovery plan (EU-REACT) to assist the refugees.

Note: For Ireland, the amount has been estimated at half the amount provided to people who do not benefit from publicly funded accommodation. Data for Austria, Hungary, Italy and Norway are for people in centres with meals provided.
Source: OECD calculations.
← 1. These calculations assume that only one third of the re-entries in Ukraine are durable returns, that the demographic composition of the refugee population varies slightly between bordering countries (50% children) and the rest of the EU (33% children) and that 94% of the adult refugee population is working age.
Activity indicators have moderated and confidence has been hit
Most economies experienced strong economic growth in 2021, as rising vaccination coverage and improved treatments mitigated the severity of the pandemic, and policy support and favourable financial conditions helped demand to rebound. Labour market slack was steadily reduced in all the major OECD economies, in some cases taking employment rates above pre-pandemic peaks. The economic disruptions from the wave of infections brought by the Omicron variant in late 2021 and the early months of 2022 generally proved mild in most countries, but global GDP growth more than halved in the first quarter of 2022, with output declining in several advanced economies.
High-frequency data are now showing some of the adverse effects of the war on activity and prices. Global mobility has continued to improve, but global industrial production, retail sales and car sales all declined in March and April (Figure 1.7, Panels A and B). Survey evidence also suggests that the war and the health-related restrictions in China are having a sizeable impact on business activity and confidence (Figure 1.7, Panels C and D). Indicators of business confidence and output have fallen sharply in China, reflecting the lockdowns in many cities and ports, and declines have also occurred in Russia and a number of major European economies, including Germany. Consumer confidence indicators had already begun to weaken ahead of the war, especially in the United States, but tumbled further in March, particularly in Europe, and declined further in April and May. In Russia, air traffic has slowed considerably, with around one-third fewer commercial flights from major airports since the war began, and prices have risen sharply. By late April, consumer prices were around 11% higher than at the start of February. Taken together, these indicators suggest that global GDP growth could be very weak in the second quarter of 2022.

Note: Data in Panel A are PPP-weighted aggregates. The retail sales measure uses monthly household consumption for the United States and the monthly synthetic consumption indicator for Japan.
Source: Google LLC, Google COVID-19 Community Mobility Reports, https://www.google.com/covid19/mobility; Markit; OECD Main Economic Indicators database; Refinitiv; and OECD calculations.
The downturn in consumer confidence is likely to be related to the squeeze on real household incomes coming from the acceleration in inflation as well as higher uncertainty. In most OECD economies, real household disposable income was already declining on a year-on-year basis in the last quarter of 2021, despite strong employment growth, and in many that decline is estimated to have continued in the first quarter of 2022. This partly reflects the phasing out of transfers associated with the pandemic, especially in countries like the United States and Canada where such payments were large, as well as the erosion of real wages. Economy-wide real hourly wage growth is now negative in most OECD economies (Figure 1.8).3 The additional increases in energy prices seen since the start of the war in Ukraine are pushing headline year-on-year inflation well ahead of the inflation rates expected at the time of collective bargaining to set wage rates in 2022.
The impact of rising inflation on real incomes has not been uniform across households (Brainard, 2022).4 The increase in expenditure resulting from recent food and energy price changes represents a larger proportion of total spending for lower-income households (Figure 1.9), and those households have limited scope to offset this by drawing on savings or reducing discretionary expenditures.5 This is one reason why governments in many OECD countries have taken action to cushion recent rises in energy prices (see below).
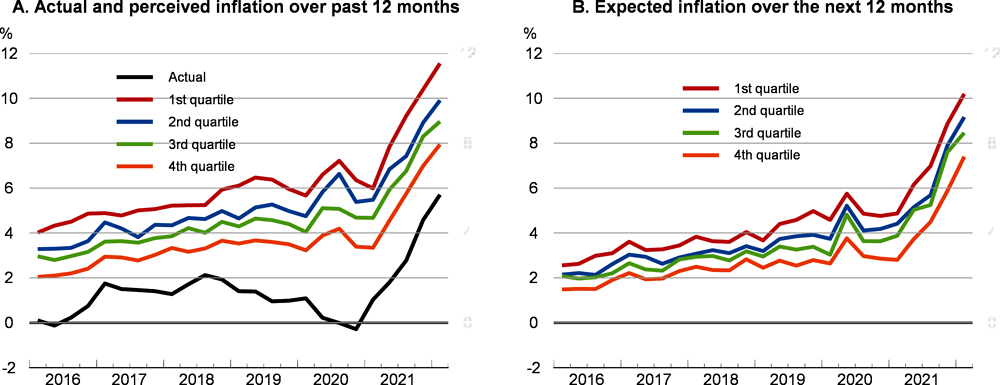
The difference between the degree of inflation experienced by many households and the official measure may be one explanation for the persistent difference between household survey measures of inflation and actual inflation in the euro area (Figure 1.10), with perceived and expected inflation highest amongst the lowest income quartile. Over and above the actual budget shares of different items, perceived inflation is also influenced by those prices which are most salient for consumers, such as electricity bills in Europe, gasoline in the United States, or common food items (Georganas et al., 2014; D’Acunto et al., 2021). These items are encountered regularly, relatively homogeneous (facilitating price comparisons over time) and make up a significant share of household expenditure. With such prices being among those registering the largest increases over the past eighteen months, perceptions of inflation have risen sharply since 2020 and run ahead of the measured rate for many people. This increase could place upward pressure on wage bargains over the coming year.
The COVID-19 pandemic has complicated the interpretation of labour market conditions, but it has become increasingly clear that labour markets in most OECD economies are now relatively tight. The OECD-wide unemployment rate is back to the lowest level in the past two decades and nominal wage growth has picked up in the United States and a few other countries to levels that are high by pre-pandemic standards. Most OECD economies are now experiencing labour shortages (Causa et al., 2022), with sharp increases in vacancies even in countries that favoured job retention schemes (Figure 1.11). Large declines in international migration since the onset of the pandemic have also contributed to labour shortages in some countries.

Source: OECD Economic Outlook 111 database; and OECD calculations.
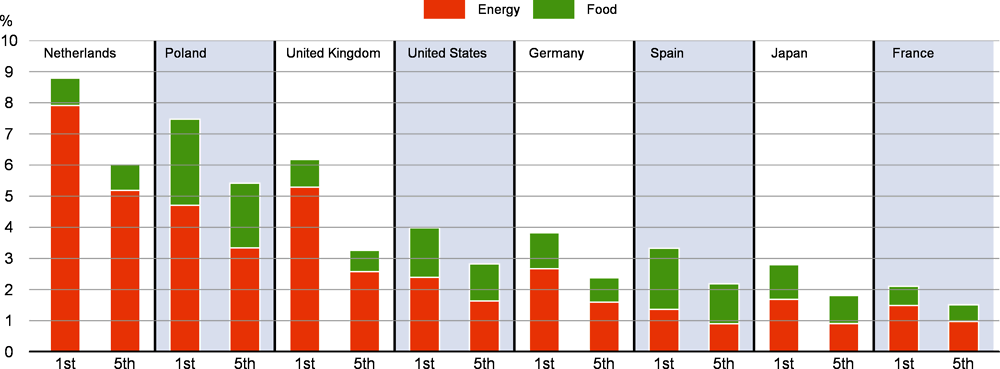
Note: Estimated impact of the year-on-year increases in energy and food prices in April 2022, using consumer basket weights in 2019 for the United States and Japan, and 2015 for other countries. Data are ranked according to the first quintile (20% of households with the lowest income). Energy corresponds to natural gas, electricity and other fuels, and includes motor fuels as well for the United States. Food corresponds to food products and non-alcoholic beverages.
Source: Bureau of Economic Analysis; Statistics Bureau of Japan; Eurostat; and OECD calculations.
Note: Job vacancy rates (i.e. vacancies as a share of employment) are on a quarterly basis and seasonally adjusted, with the exception of Canada.
Source: Australian Bureau of Statistics (AUS); Statistics Canada (CAN); DARES (FRA); Office for National Statistics (GBR); Central Bureau of Statistics (ISR); US Bureau of Labor Statistics (USA); and Eurostat (OECD-EU).
Financial market conditions have tightened significantly
Faster and more extensive policy interest rate rises in advanced and emerging-market economies and the war in Ukraine have led to a substantial tightening of global financial conditions. In particular, volatility has increased significantly in equity, bond and foreign exchange markets (Figure 1.12), equity prices have declined, government bond yields have risen and most currencies have depreciated against the US dollar.
Weaker growth prospects and higher bond yields have weighed on equity markets in most advanced countries, including the United States. Strong exposure to the conflict region has added to downward repricing in the euro area and most Eastern European economies (Figure 1.13, Panel A). Equity prices have risen in a few commodity-exporting economies, as well as in Türkiye, but recent COVID-19 outbreaks and continuing vulnerabilities of highly leveraged real estate companies have hit equity markets in China.
Government bond yields have increased in most countries since January (Figure 1.13, Panel B). In the United States, the yields on 10-year nominal and inflation-adjusted government bonds have risen by around 1 percentage point over this period. The rise in 10-year nominal yields has been somewhat higher in the euro area, and sovereign bond spreads have widened within the area. Nominal yields have also risen in the major emerging-market economies.6 In contrast, yields have hardly increased in Japan, reflecting lower inflationary pressures, yield curve control and no immediate sign of policy tightening.

Note: Implied volatility as measured by the VIX index can be interpreted as the market expectation of risk (future volatility) and is derived from at-the-money call option prices (interpolated) using the Black-Scholes formula. For more recent data, the Cox-Rubinstein binomial method is used for American-style options. The MOVE index is a yield curve weighted index of the normalised implied volatility on 1-month Treasury options which are weighted on the 2, 5, 10 and 30 year contracts.
Source: Refinitiv; and OECD calculations.
Corporate bond spreads (relative to government benchmark bonds) have increased since early 2022 but remain moderate by historical standards in the major advanced economies, reflecting generally healthy corporate balance sheets. However, bank credit default swap spreads have risen markedly, likely reflecting concerns about weakening growth prospects.
The US dollar has appreciated since the onset of the war in Ukraine, partly reflecting the faster anticipated pace of policy interest rate increases in the United States relative to most other advanced economies, especially Japan (Figure 1.13, Panel C). With a few exceptions due to idiosyncratic factors, such as Argentina, the currencies of most major commodity-producing emerging-market economies have either appreciated or depreciated only slightly against the US dollar since January.
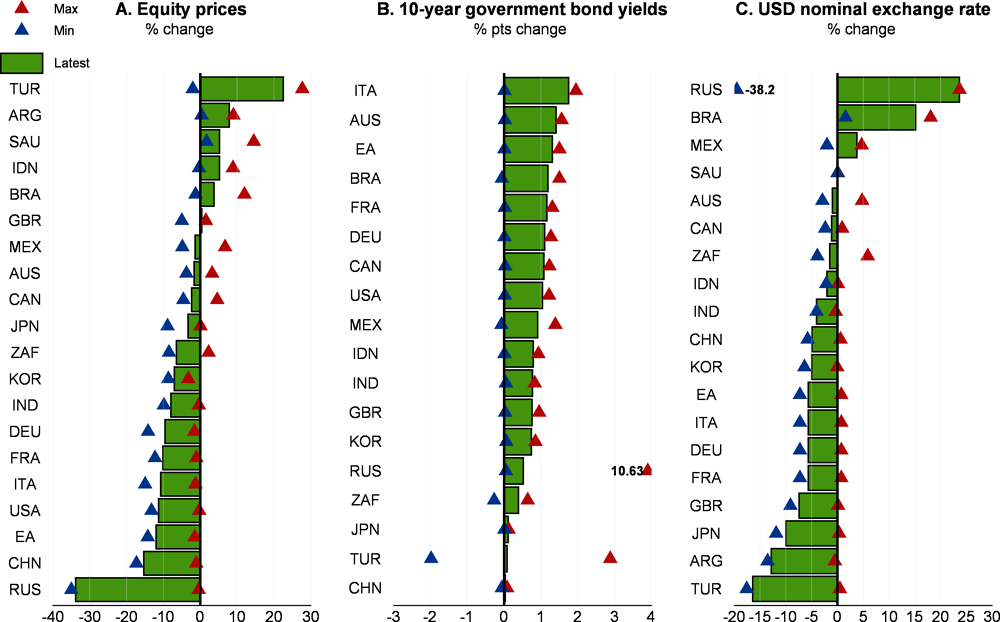
Note: “Latest” refers to the change between the average of January 2022 and the latest available data up to June 1. “Maximum” and “Minimum” refer to the largest increases or falls relative to the average of January 2022. Based on a 10-day average of daily observations.
Source: Refinitiv; and OECD calculations.
Trade momentum is easing and supply chain pressures remain acute
Global merchandise trade, container port traffic and air freight traffic indicators were all expanding in early 2022 (Figure 1.14, Panel A), prior to the war. International travel was also gradually recovering, other than in the Asia Pacific region where widespread border closures and restrictions remained. War-related disruptions curbed this trend in March, with a particularly sharp downturn for air freight. Global new export orders have also weakened, with declines in China, the euro area and Japan (Figure 1.14, Panel B).
Bottlenecks in international freight remain high, and are being accentuated by the Ukraine war and the shutdowns in China. Supplier delivery times rose in many countries in March and April but eased slightly in May. Indicators of freight waiting times and shortages of intermediate goods have also increased (Figures 1.15 and 1.16). The easing of pandemic lockdowns and sanitary restrictions, combined with the normalisation of demand in many regions, is helping to reduce demand-supply mismatch in maritime transport, with shipping costs down from their peaks in late-2021. However, the war has resulted in the diversion of freight from routes that have become non-viable towards others which are already over-stretched and very expensive. With parts of the Black Sea and Sea of Azov unpassable, maritime companies have closed lanes and suspended shipping services. Rail and airspace over Ukraine and Russia have also been shut off, limiting capacity. Commercial air travel and freight traffic by air and sea are being rerouted to avoid Russian air space and ports, becoming more expensive (due to higher insurance rates and longer routes) or ceasing altogether. Container loads in major Russian ports have also declined by 50% compared to a year ago and have stopped in the Ukrainian port of Odessa since early March. The war also risks exacerbating crew shortages, as nearly 15% of international freight crews in 2021 were Russian or Ukrainian.

Source: CPB Netherlands Bureau for Economic Policy Analysis; Institute of Shipping Economics and Logistics; IATA; Markit; and OECD calculations.

Additional disruptions have arisen as a result of the impact of the strict zero-COVID strategy in China. Though air and ocean ports are being kept operational (with workers often remaining on site), lockdowns in Shanghai and other big cities have created labour shortages that affect truck companies, reduce ground handling capacities, and ultimately slow operations in ports. Air traffic has also declined sharply.

Source: IFO; and OECD calculations.
Inflation pressures have broadened further
Inflation has been increasing worldwide for more than a year (Figure 1.17, Panel A), with the headline measure of inflation currently above central bank objectives in most economies, particularly outside Asia. Apart from special cases of very high inflation, such as Türkiye and Argentina, headline inflation has increased particularly rapidly in Central and Eastern Europe, Latin America, the United States and the United Kingdom.
Large increases in food and energy prices since mid-2020 have pushed up headline inflation in all economies, even though the increases have not been uniform.7 More recently, the increase in inflation has gone well beyond energy and food in most countries. Core inflation (excluding food and energy) has increased in almost all advanced economies (Figure 1.17, Panel B), even where the recovery from the pandemic is not complete. As with headline inflation, core inflation has increased particularly sharply in Central and Eastern Europe. The distribution of price changes has also shifted considerably. In the United States, the euro area and the United Kingdom, the prices of at least half the items in the inflation basket rose at annual rates above 4% over the year to April (Figure 1.18).
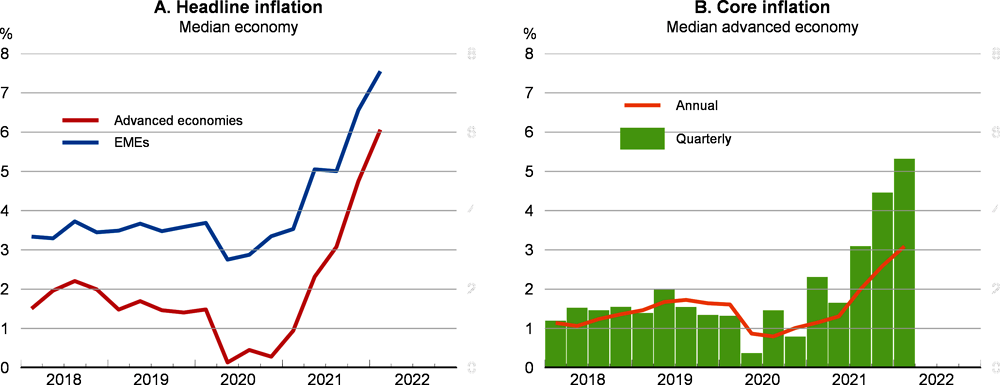
Note: Headline and core inflation based on the personal consumption expenditures deflator in the United States, harmonised consumer prices in the euro area economies and the United Kingdom, and national consumer prices in other countries. In Panel B, the quarterly numbers are quarter-on-quarter percentage changes at an annualised rate.
Source: OECD Economic Outlook 111 database; and OECD calculations.
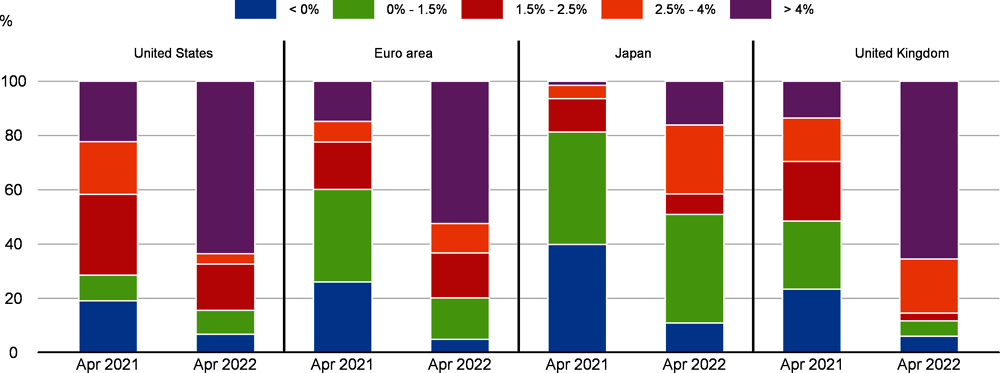
Note: The figure shows the distribution of the annual percentage change in the prices of the different goods and services in headline consumer price inflation. Headline inflation based on the personal consumption expenditures deflator in the United States, harmonised consumer prices in the euro area and the United Kingdom, and national consumer prices in Japan.
Source: Bureau of Economic Analysis; Statistics Bureau of Japan; Eurostat; Office for National Statistics; and OECD calculations.
Differences in the severity of the pandemic, the structure of economic activity, the extent of labour shortages and policy responses to the pandemic all help to account for cross-country differences in inflation. Particularly strong fiscal measures in response to the pandemic in the United States helped produce a strong cyclical recovery by pushing household incomes well above their pre-pandemic level. With expenditure on some services constrained by the pandemic and the associated restrictions, more of the rebound in consumption was directed to goods, where supply-chain constraints have been strongest, and was reflected in rapidly rising goods prices (OECD, 2021a; Boone, 2022; Jordà et al., 2022). In contrast, policies in many European economies focused on job preservation, with disposable incomes largely kept at their pre-pandemic level. This led to a slower recovery in consumption with smaller differences between goods and services spending. In Japan, large reductions in mobile phone price plans have helped to keep inflation low.
The patterns of price increases over the past two years suggest that pandemic-related effects account for a sizeable share of the recent increase in headline inflation (Figure 1.19). Prices declined in some of the service sectors most impacted by public health containment measures in the first phase of the pandemic, followed by large price increases as economies reopened. Similarly, the deep recessions in the spring of 2020 triggered sharp falls in the prices of oil and gas, which led many producers to shut down production and curb exploration. The rapid rebound in economic activity thus quickly met supply constraints in energy, contributing to the sharp increases in energy prices since that time.8 A variety of supply constraints associated with the pandemic also meant that goods production could not keep pace with the rebound in demand for goods. As a result, inflation for goods excluding food and energy was generally weak in the first half of 2020 but unusually strong over the past 18 months. In contrast to energy, goods and COVID-affected services, categories of services like financial services or communications, less obviously directly affected by the pandemic, have experienced relatively stable rates of inflation, but with some upward drift, especially in North America (Figure 1.19).

Note: Data are for the personal consumption expenditures deflator for the United States; the consumer price index for Canada and Japan; and the harmonised consumer price index for the euro area, Germany and the United Kingdom. The attribution of different service activities to “COVID-affected” or “non-COVID-affected” depends on the categorisation of services within each jurisdiction’s index, but follows a number of general principles, including the notion that services involving travel by the service receiver and/or requiring that the provider and the receiver of the service both be physically present would be classified as “COVID-affected”. Thus, for example, passenger transport, package holidays, hotel accommodation, restaurants, cinemas, concerts, personal care services and dental services would all be included in “COVID-affected services”, while financial services, communications and most education and health services would be categorised as “non-COVID-affected services”.
Source: Bureau of Economic Analysis; Statistics Bureau of Japan; Eurostat; Office for National Statistics; Statistics Canada; and OECD calculations.
There have been several significant changes in the global economic environment in recent months, including the worldwide spread of the Omicron variant of the SARS-COV2 virus and the greater-than-expected persistence of inflationary pressures, entailing a faster adjustment of monetary policy in a number of major economies than previously expected. The single greatest change, however, is the economic impact of the war in Ukraine.
The Ukraine conflict is a significant negative shock to the global economy, although the impact on growth this year and next is partially mitigated by some of the factors already expected to support the recovery. In particular, the impact of the pandemic on economic activity is still assumed to wane through 2022, and household saving ratios, which in many countries surged in the first phase of the pandemic, are assumed to continue to decline, helping to offset much of the drag on real disposable incomes from elevated inflation (Figure 1.20). On the other hand, global financial conditions have tightened and fiscal consolidation is continuing in most OECD economies during 2022-23, though at a somewhat slower pace than previously expected, especially in Europe this year. Higher spending to offset the impact of higher energy prices on households and firms and to provide humanitarian assistance to refugees are among the reasons for this.
The war in Ukraine has quashed hopes that the inflationary surge experienced in much of the global economy in 2021 and early 2022 would subside quickly. The additional impetus to food and energy prices, and the aggravation of supply-chain issues, imply that consumer price inflation will peak later and at higher levels than previously foreseen. As this additional negative supply shock was not anticipated, household incomes are rising more slowly than prices, worsening the deterioration in real household disposable incomes that was already underway in many OECD economies. The forthcoming EU embargoes on coal and seaborne oil imports from Russia are likely to push up global energy prices further over the next year, keeping headline inflation higher for longer.

Consumer price inflation in the G20 economies is now projected to peak at 7.6% in 2022, before slowing to around 6¼ per cent in 2023 (Table 1.1). Inflation is still projected to moderate next year in most countries, provided that the peak in global energy prices is passed, as assumed, in early 2023 (Annex 1.A.) and supply-chain constraints wane gradually. Moderating demand growth will also help to ease inflation pressures. Even so, headline and core inflation are projected to remain higher in 2023 than previously foreseen, and in many cases above central bank policy objectives (Figure 1.21). With inflation now seen as staying higher for longer in most OECD economies, many central banks are now expected to raise interest rates more quickly than previously assumed. On average across the OECD, policy interest rates are projected to be around 2½ percentage points higher in 2023 than in 2021; the impact of this on the growth outlook is expected to take effect gradually through the projection period.
Global GDP growth is now projected to slow to 3% in 2022 and between 2¾-3 per cent in 2023, with output rising by only around 2% over the year to the fourth quarter of 2022. In the OECD economies, growth is now projected to moderate to 2.7% in 2022 and 1.6% in 2023, with the level of output in 2023 around 2% weaker than previously projected. Almost all countries are now expected to grow more slowly in 2022-23 than was foreseen before the war (Figure 1.22). Business investment and private consumption growth have both been revised down. OECD-wide private consumption is however still projected to rise on average by between 2¼-2½ per cent over 2022-23, with lower saving ratios and solid, albeit slowing, employment growth offsetting the drag from real wage declines in many countries. In many countries, GDP growth over the two years is still projected to be fast enough to allow the output gap to narrow, although in some economies, including the United States and the United Kingdom, growth is projected to drop below potential rates in 2023.

Note: Data for Argentina and Türkiye (50.6% and 38.9% for headline inflation, respectively) are not presented.
Source: OECD Economic Outlook 111 database; OECD Economic Outlook 110 database; and OECD calculations.
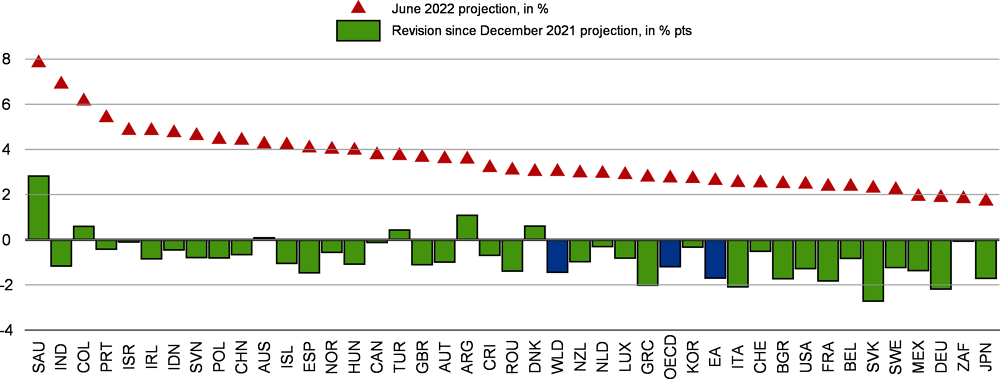
Source: OECD Economic Outlook 111 database; OECD Economic Outlook 110 database; and OECD calculations.
European economies, particularly those bordering Russia or Ukraine, are expected to be the hardest hit by recent developments. This reflects larger gas price rises in Europe than elsewhere and stronger pre-war business and energy linkages with Russia. In 2023, the oil embargo is likely to further weaken growth and prolong upward pressures on inflation in Europe, with adverse effects also being felt elsewhere. Advanced economies in the Asia-Pacific region and the Americas have weaker trade and investment links with Russia, and some are commodity producers who benefit from higher commodity prices. Even so, growth in these cases is still hit by weaker global demand and the impact of higher energy prices on household incomes and spending. Growth outcomes in the emerging-market economies reflect a balance between positive effects for some commodity-producing economies, particularly the major oil-producing economies other than Russia, and negative ones in the major commodity-importing economies.
Prospects in the major economies are as follows (Table 1.1):
In the United States, GDP growth is anticipated to weaken from 5.7% in 2021 to 2.5% in 2022 and 1.2% in 2023. Supply shortages, exacerbated by the war in Ukraine and COVID-related lockdowns in China, higher oil prices and a faster pace of monetary policy normalisation will hold back growth to a greater extent than previously foreseen. The expiry of pandemic-related fiscal measures will result in a marked fiscal consolidation this year, exerting a drag on growth, though this is expected to be partially mitigated by the lagged effects of past government spending. Growth will also be supported by continued employment gains this year and rising real wages in 2023. Labour markets remain tight, although unemployment is projected to bottom out in late 2022 and begin to edge up during 2023. Annual inflation (as measured by the personal consumption expenditures price index) is projected to decline from a peak of 6.3% in the second quarter of 2022 to 2.8% by the last quarter of 2023 – both the headline and core measures of inflation would remain above the Federal Reserve’s 2% target at end-2023.
Near-term growth in Japan has been dented by the Omicron wave, with public health restrictions applied to much of the country in early 2022, as well as by weak external demand and the increase in the prices of key commodity imports. Helped by a bounce-back in private consumption following the lifting of confinement measures, GDP growth is projected to pick up through 2022 to be 1.7% for the year as a whole, and 1.8% in 2023. Higher commodity prices will push headline inflation up to nearly 2½ per cent by late 2022, tempered by government subsidies to mute surging fuel prices, but core inflation is projected to remain low, partly reflecting weak wage growth.
In the euro area, the war in Ukraine and the lockdowns in China add to supply-side bottlenecks giving additional impetus to inflationary pressures and further denting real household incomes and business sentiment. The slowdown in growth, while sharp, is being cushioned by tight labour market conditions, the implementation of the Next Generation EU recovery plan and fiscal support for households and firms affected by higher energy costs. GDP growth is projected to slow from 5.3% in 2021 to 2.6% in 2022 and 1.6% in 2023. Headline inflation is projected to reach 7% in 2022 before falling to 4.6% in 2023 – annual inflation at the end of 2023, at 3.9% for the headline measure and 3.7% excluding food and energy, would still be well above the central bank’s objective.
After a fast recovery from the first wave of COVID-19, China’s economy has cooled, partly reflecting the stringent measures that remain in place to eradicate the spread of the virus as well as weak real estate investment due to tighter regulations and the failure of some major developers. However, additional monetary policy easing and fiscal support worth up to 2% of GDP this year should help to stabilise demand: GDP growth is projected to slip to 4.4% in 2022 before rebounding to 4.9% in 2023. China is potentially exposed to significant upward price pressures coming from energy and food, but large reserves are likely to contain these pressures. Headline inflation is projected to be 2% in 2022 and 3% in 2023.
India recorded the strongest rebound from the COVID-related downturn of any G20 economy, but momentum is dissipating owing to weaker external conditions, rising global food and energy prices and the tightening of monetary policy. As an importer of energy, fertilisers and edible oils, India is adversely affected by the war in Ukraine. GDP growth, which reached 8.7% in FY 2021, is projected to slow to 6.9% in FY 2022 and 6.2% in FY 2023, with weaker external demand growth and tighter monetary conditions being mitigated by strong government spending and an ambitious set of measures to simplify the business environment. Headline inflation is projected to ease gradually, though remaining above the central bank’s upper tolerance limit of 6% throughout 2022 and 2023.
A range of factors, including rising inflation, the war in Ukraine, unfavourable weather conditions, political uncertainty and the spread of the Omicron variant in early 2022 have eroded sentiment and dented growth in Brazil. Commodity exports are likely to strengthen, but higher inflation is expected to hit households’ purchasing power and hinder consumption growth, as well as triggering additional monetary policy tightening. GDP growth is projected to slow sharply to 0.6% in 2022 before picking up to 1.2% in 2023. Inflation is seen as remaining high in 2022, averaging 9.7%, before declining to 5.3% in 2023 as the impact of monetary policy tightening and currency appreciation is felt.
The normalisation of labour markets is projected to continue during 2022-23, despite the new negative shock of the war in Ukraine. As the public health situation improves further, based on rising vaccination rates and improved COVID-19 treatments, labour force participation is projected to increase in almost all economies. Stronger international migration flows and the gradual entry of Ukrainian refugees into host country labour markets should also help to ease some labour shortages. OECD-wide employment growth is projected to slow from around 2¾ per cent this year to under 1% in 2023, with unemployment rates starting to rise slightly in some countries. In most OECD economies, real wage growth over 2022-23 as a whole is projected to be negative, and for the OECD as a whole the pace of wage increases in nominal terms is projected to decline from around 4¾ per cent in 2022 to close to 4% in 2023.
The conjunction of soaring energy prices and growing worries about a sharp slowdown in growth has spurred talk of the global economy experiencing a new period of stagflation, a term redolent of the oil shocks of the 1970s. While there are indeed increasing similarities between the current situation and the mid-1970s after the first major oil price shock late in 1973, there are also differences that could mean that growth is more resilient now than on that occasion, and that inflationary pressures wane more quickly and durably (Box 1.3; Igan et al., 2022). Nonetheless, as discussed in the next section, there are clear risks that growth could slow more sharply than expected and inflationary pressures could intensify further.
The combination of rapidly rising prices and slowing economic growth has given rise to fears that the global economy may be entering a period of stagflation. There is no single definition of stagflation but it is generally understood to denote a combination of slow or zero growth and high inflation. The turbulence experienced after the global oil price shock in late 1973 – with oil prices tripling over the year to the first quarter of 1974 – is widely seen as a period of stagflation, with inflation and unemployment rates rising steadily in the aftermath of the oil price increase, and real income growth slowing sharply (Figure 1.23). In late 1974 and early 1975, GDP per capita declined in all G7 economies and labour market conditions deteriorated: the average unemployment rate in the G7 economies over 1974-76 was 1 percentage point higher than over 1971-73, and 1.8 percentage points higher in the United States.
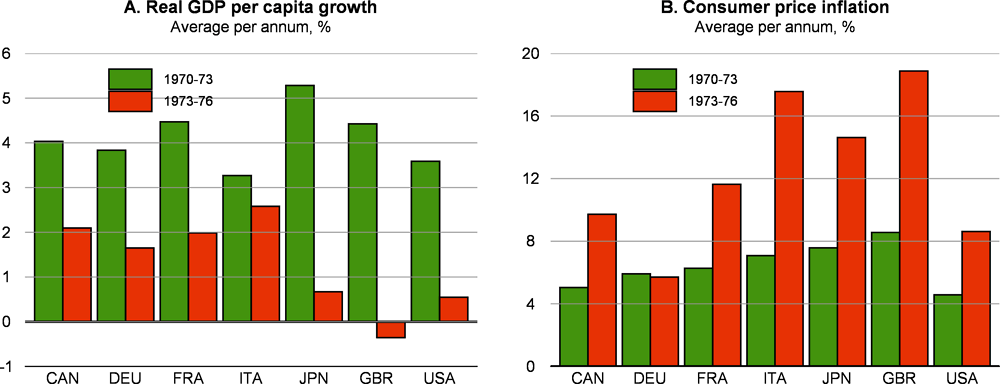
There were some other features of this episode also seen in the current economic situation. World food prices rose sharply, with the FAO food price index doubling between 1972 and 1974, and labour markets were generally tight ahead of the increase in oil and food prices, with strong wage growth. OECD potential output estimates suggest that the major advanced economies generally had large positive output gaps when the oil price shock hit in 1973, after a period of rapid growth. Cost-push inflation took root following the energy price shock, with successive wage rounds trying to restore real incomes, and inflation expectations rose over time. Ex-post real interest rates also turned negative, with monetary policy placing too much emphasis on maintaining low unemployment and too little on addressing rising inflation expectations (Meltzer, 2005; Powell, 2018).
Although the current situation shares some similarities with that in the early 1970s, economic policy frameworks are very different, and structural changes have reduced the impact of commodity price shocks on economic activity and wage growth. Thus, a negative supply shock induced by oil prices should have less of a stagflationary impact than in the mid-1970s:
The advanced economies have become far less energy-intensive after the big oil-price shocks of the 1970s and early 1980s, potentially reducing the impact of an oil shock by half in the United States (Blinder and Rudd, 2008). The share of industrial output in total economic activity has also declined. To some extent this is offset by the increasing importance of less energy-efficient emerging-market economies in global economic activity, but global oil and energy intensity has also declined (Rühl and Erker, 2021).
Central banks’ monetary policy frameworks have evolved and become more robust, with a stronger focus and understanding of the importance of maintaining well-anchored inflation expectations than was the case in the 1970s. Most central banks are now independent, and they have an explicit focus on price stability and an inflation target, even in countries in which they formally retain a dual mandate.
The advanced economies are more flexible, and hence better able to handle oil shocks, than they were in the 1970s. Changes in labour market institutions since the 1970s have reduced the risk that an oil price shock (or other negative supply shock) results in a wage-price spiral. The coverage of collective bargaining agreements has declined, many automatic wage indexation mechanisms have been removed, and lower union membership has reduced employees’ bargaining power (OECD, 2021a).
There are particular circumstances at the current juncture that may buffer some of the potential adverse effects of higher energy prices. For instance, many consumers have excess savings accumulated during the pandemic that can be used to offset income shortfalls, some spare capacity still exists on OECD estimates in many countries, and supply shortage pressures should moderate as borders reopen and more people join the labour force.
The Ukraine war is primarily a negative global supply shock, reducing output and raising prices relative to what might otherwise have been expected. In this sense, it is qualitatively similar to the effects of the oil shocks in the 1970s and shares some characteristics with periods of stagflation. However, the current baseline projections are for continued, but mild growth in most economies, with inflationary pressures that are projected to moderate slowly over the coming year and a half. Downside risks remain of more severe effects that would further harm growth prospects and add to inflation, such as an abrupt shut-off of gas imports from Russia to Europe. Nonetheless, sustained high inflation for several years could still be avoided provided monetary policy acts to maintain well anchored long-term inflation expectations close to central bank objectives.
Global trade prospects have weakened. The surge in trade at the end of 2021 has strong positive carryover effects for annual growth this year, but on a quarterly basis trade growth is projected to be weaker than previously thought over 2022. World trade growth is projected to moderate from 10% in 2021 to about 5% in 2022 and 4% in 2023 (Figure 1.24). Key factors slowing trade growth in 2022 include prolonged regional lockdowns in China, weaker demand in Europe due to the Russia-Ukraine war and the transition of US consumer demand from goods to services. The recent rise in prices and tensions across commodity markets are projected to lower the trade growth of commodity exporters this year, with Russian trade expected to contract by over one-quarter in 2022 and 9% in 2023. In Europe, the slowdown in import growth is particularly pronounced in the Baltic and the East European economies, where supply-chain linkages with Russia and Ukraine are constraining key economic sectors.
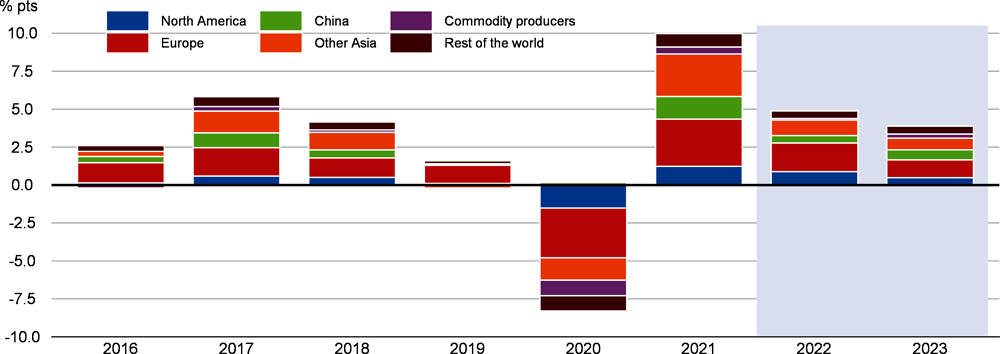
Note: The North America aggregate includes the United States and Canada; Europe includes the OECD European countries; Other Asia includes Japan, Korea, the Dynamic Asia Economies (Hong Kong (China), Malaysia, Chinese Taipei, the Philippines, Singapore, Thailand and Vietnam), India and Indonesia; Commodity producers include Argentina, Brazil, Chile, Colombia, Russia, Saudi Arabia, South Africa and other non-OECD oil-exporting economies.
Source: OECD Economic Outlook 111 database; and OECD calculations.
The adverse effects from the war could be much larger
A key potential risk to the projections is that all energy exports from Russia to Europe could cease completely. The impact of such a shock is difficult to quantify, but could be severe if it were to occur through a sudden stop in imports from Russia at a time when stock levels had yet to be rebuilt and there were limited possibilities to switch quickly to alternative sources of supply. The forthcoming EU embargos on imports of coal and seaborne oil from Russia also raise challenges, and could be more disruptive than projected if there are prolonged supply shortages.
Oil and gas represent sizeable shares of EU total energy use.9 A Europe-wide embargo, or a sudden stop to exports by Russia, thus brings a sizeable risk of energy supply disruption as well as rising prices.10 There are large differences across member states, both in terms of the energy mix and the share of energy inputs that originate in Russia. An end to imports of Russian energy is likely to affect sectors in different ways according to their dependency on energy imports from Russia and scope to obtain alternative energy supplies or reduce demand. As energy is a critical input across several industries, the short-run impact on output could be amplified by cascading effects propagating along international and domestic input-output linkages. At the same time, sharp rises in energy prices might also have hefty repercussions on household incomes and demand.
Illustrative assessments of the direct effects on output in manufacturing and market services sectors that might result from an embargo of all of energy products from Russia can be made by combining input-output tables with information on energy use in 2019 from the International Energy Agency (IEA).11 The IEA data provide economy-wide dependency ratios on Russian imports for each of the three different fossil fuels (coal, gas and petroleum products). These can be used to calculate the dependence on Russian energy imports in each sector by using the consumption shares of each respective fuel product in different sectors and assuming that the share of each fuel product imported from Russia is the same across all sectors. The impact on gross output from an energy embargo on Russia is then derived by applying input-output multipliers of energy-related industries.12 After taking into account all direct and indirect linkages, the input-output multipliers quantify the change in each sector’s output that results from the complete cut in Russian energy inputs in trade partners’ industries and domestic sectors.
This approach, based on the pattern of energy use seen prior to the pandemic, suggests that a sudden stop in all imports of fossil fuels from Russia would affect all sectors of the economy, particularly energy-producing sectors, transport, minerals and metals manufacturing (Figure 1.25). Aggregating across sectors, the estimates imply a reduction in European output in manufacturing and market service sectors of between 2¾-3 per cent, if not offset by drawing down stocks or by substituting other energy inputs. Around one-half of this output decline would be due to shortfalls of petroleum and petroleum products, with the majority of the remainder from shortfalls of natural gas. These estimates highlight the risks of possible supply disruptions following an oil embargo, and the additional potential risks of a gas embargo.
These illustrative input-output estimates are highly uncertain, particularly given ongoing efforts to diversify sources of energy supply in Europe. The output effects could easily be understated, as supply disruptions could force companies to shut down production completely rather than reduce it proportionally. The near-term impact of a simultaneous sharp contraction in production across many sectors and countries is also likely to be larger than if only one country is affected. On the other hand, the input-output structure used cannot account for possible substitution effects with foregone Russian imports replaced by imports from elsewhere, or by drawing down reserves, using additional domestic supplies from alternative energy sources, such as nuclear energy or renewables, or improved energy efficiency. Such adjustments would mitigate the output costs.
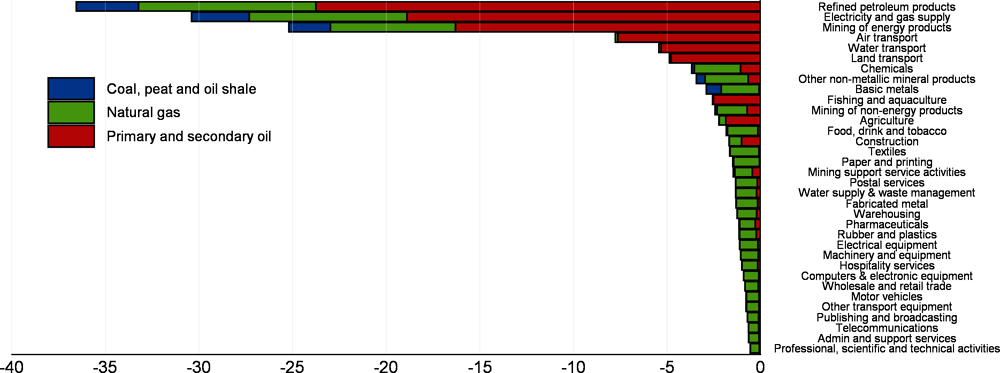
Note: See text for details of the calculations. Primary and secondary oil includes crude, natural gas liquids, refinery feedstock and other processed oil products.
Source: OECD Input-Output Tables (IOTs) 2021 database; IEA World Energy Balances database; and OECD calculations.
A few similar studies report comparable output costs for Germany of between 0.3 and 2.2% (depending on the scenario considered) and slightly lower costs for France (Baqaee et al., 2022; Bachmann et al., 2022). Earlier estimates using input-output linkages also pointed to relatively small output costs in Europe if imports of natural gas from Russia were ended (Bouwmeester and Oosterhaven, 2017). In contrast, estimates by Holtemöller et al. (2022) and Deutsche Bundesbank (2022) for Germany highlight the risk of a large and immediate drop in output in the event of a sudden stop in energy imports from Russia.13
The extent to which the loss of imported fossil fuels from Russia can be offset will depend in part on the timing and circumstances of such a change.
Strong drives to reduce Europe’s dependency on Russia over the course of this year have already begun. In early March, the IEA set out a plan to reduce use of gas from Russia by at least one-third in 2022. Shortly thereafter, the European Commission released its RePower EU plan, raising the ambition to a two-thirds cut within a year. Plans include improved storage levels ahead of the winter season, joint purchases from alternative suppliers, greater use of renewables and other existing domestic energy sources, and improved energy-saving measures (such as lower residential heating temperatures).
There has already been a substantial shift in the composition of European gas imports this year. In the first 21 weeks of 2022, EU imports of Russian gas via pipeline were down by more than 30% compared to the corresponding period in 2021, and more than offset by a 54% increase in liquefied natural gas (LNG) imports from other sources. As a result, the share of Russian gas in total gas imports fell from 35% on average in the first 21 weeks of 2020 and 2021 to 24% in the same period of 2022 (Figure 1.26).
The IEA has also produced a 10-point plan to reduce oil use. In addition to finding alternative suppliers, a key need is to change behaviour and reduce demand. Actions to lower the amount of oil consumed by cars are particularly important. These changes will take time to put into full effect, raising potential risks to the projections of a sudden stop in oil supplies in the absence of adequate storage levels.
More generally, global energy markets are tight, although there is scope to obtain additional oil output from some OPEC and non-OPEC producers and further coordinated inventory releases by IEA members. Increased LNG deliveries can also help to mitigate any potential supply disruptions of pipeline gas to European markets, although additional investment in this sector will be necessary (G7, 2022). Significant logistical challenges also need to be overcome, including the transportation by sea of fuels from more distant non-European suppliers, the specialised platforms needed to store LNG offshore, and the infrastructure required to ensure that additional supplies can be moved within Europe to inland markets previously supplied by gas pipelines from Russia. Refineries currently designed to process oil from Russia also need to be reconfigured, unless a close substitute can be found. The difficulties that Russia would face in diverting all of its energy exports to Europe to non-European markets, particularly gas, would also be likely to hit global energy supply, at least in the short term. Strong additional competition from Europe for scarce energy supplies would therefore be likely to drive up prices in global markets.

Source: McWilliams et al. (2021), based on data from ENTSO-G.
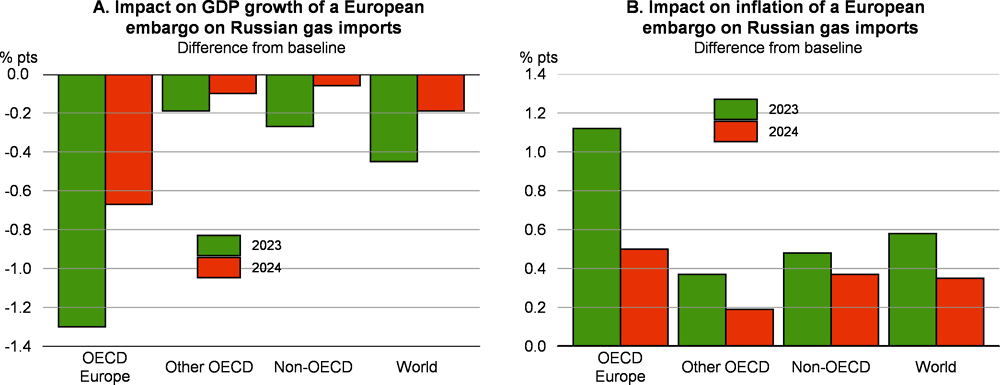
Illustrative simulations, using the NiGEM global macroeconomic model, highlight the risk of potential adverse effects from an end to Russian gas imports in the European economies. A full gas embargo is modelled as a negative supply shock, with potential output in the average European economy lowered by close to 1½ per cent via a combination of reduced technical efficiency and a fall in average hours worked. The embargo is also assumed to push up global gas prices by 50%, reflecting the need for the European economies to source additional supplies on world markets and reduced supply from Russia.14 Higher gas prices are expected to also push up fertiliser prices, which are assumed to rise by 25%, and increased demand for energy supplies is expected to spill over into oil markets, with oil prices assumed to rise by 10%. Given the uncertainty that is likely to accompany energy supply disruptions, additional effects are likely to arise in the European economies from a decline in confidence and higher financing costs for companies. These effects are modelled by an ex-ante increase of 1 percentage point in the household saving rate and a 1 percentage point rise in the user cost of capital. The commodity price shocks are assumed to last for at least one full calendar year, before fading slowly as markets start to adjust. All other shocks are assumed to persist for three years before fading. Policy interest rates are endogenous and adjust according to the balance of the shocks to growth and consumer price inflation.15
Taken together, these shocks could reduce growth in the European economies by over 1¼ percentage points in 2023, relative to baseline, and raise inflation by over 1 percentage point (Figure 1.27). A growth decline of this magnitude could potentially leave many countries close to, or in, recession in 2023. Growth would also be weakened in 2024 if the shocks persist, with demand gradually being brought into line with the reduction in supply. Real household disposable incomes would be hard hit, declining by more than 2% in the euro area economies, reflecting the drag exerted by higher prices and lower hours worked. Business investment would also be severely affected, with lower potential output, higher gas costs and the higher user cost of capital leading to declines of around 5% or more in many European economies in 2023.
Outside Europe, the impact of the shocks would be smaller, especially in other gas-producing economies, but there would still be impacts from higher inflation on real incomes and weaker demand from Europe. For the world as a whole, inflation is pushed up by over ½ percentage point in 2023, with growth reduced by just under ½ percentage point.
Monetary policy reacts to the upturn in inflation, with policy interest rates initially raised by around 50 basis points in the euro area in the first year of the shock, and 25 basis points in many other advanced economies, before returning towards baseline as inflationary pressures subside.
In addition to energy, the risks of stronger costs from the war in Ukraine also arise from shortages of critical raw materials, and disruptions to transportation and trade finance.
As Russia and Ukraine are important suppliers of many critical raw materials, the risks of disruption are also high for some supply chains relying heavily on these inputs (e.g. automobile, aeronautics or electronics). Substituting towards alternative sources of supply is particularly difficult for some critical raw materials provided by Russia and Ukraine as these inputs are highly specialised and the market is very concentrated (Box 1.4; Grzegorczyk et al., 2022).
The products most at risk of disruptions in supply from Russia and Ukraine can be identified using granular customs data. For the purposes of this analysis, a traded good is characterised as vulnerable to disruption if Russia or Ukraine is one of the top five world exporters and if their combined market share represents at least 15% of the global export market. Out of more than 4500 products traded in 2020, 92 are identified as vulnerable on this basis. Collectively, they represent 2.7% of the total value of trade in 2020 (Table 1.2). The vulnerable products are concentrated in metals, chemicals, food and agriculture.
This snapshot of potential vulnerabilities suggests that beyond the impact on agriculture (Box 1.1) and energy, there are risks that the war hits trade in raw materials and triggers ripple effects in critical industries. European gross exports of basic metals and fabricated metal products contain almost 10% of value added from raw materials that originate from Russia. This high degree of backward integration to Russian metals makes production throughout Europe sensitive to disruptions.
Palladium and nickel matter for green technologies
Within metals products, Russia accounted for one-quarter of global palladium exports in 2020 (Figure 1.28, Panel A). This material is important for many green energy technologies. Its catalytic properties make palladium a central input for the production of emission-control systems in vehicles, with car manufacturers using it to remove toxic emissions from exhaust fumes. Global exports of nickel are also highly concentrated, and Russia together with Ukraine account for one-third of the world export market. Its uses include production of batteries powering electric vehicles. Ukraine is also a key exporter of neon gas, a by-product of steel manufacturing used in the lithography of semiconductors, which is sold to Korea, the United States, China and Chinese Taipei (Figure 1.28, Panel B). This collection of potential supply chain disruptions could pose significant risks for the vehicle industry, and especially the production of electric vehicles.

Note: Panel A shows the share of the top five exporters in global exports recorded in 2020 for each commodity. Panel B shows the destinations of Ukraine’s exports of rare gases (i.e. neon gas).
Source: BACI database from CEPII; and OECD calculations.
Steel value chains are also at risk, with potentially widespread downstream propagation
War-related disruptions could also weigh on iron and steel trade. Many products belonging to the broad iron and steel category are dependent on Russian and Ukrainian exports (Figure 1.29). Russia and Ukraine account for one-quarter of global exports of iron and non-alloy steel semi-finished products, and half of world exports of pig iron. While iron and steel are more easily substitutable than rare metals (such as palladium), their widespread use in multiple downstream industries could trigger cascading consequences in the event of supply disruptions.
Russia is also a major exporter of ferro-alloys, supplying 30% of the global export market for ferro-tungsten, ferro-chromium and ferro-titanium. Stainless steel makers use these ferro-alloys as a stabiliser in the production of low-carbon steels. Chromium and vanadium are also two important inputs in steel production: a small quantity is enough to harden steel and make it very resistant. The stainless steel is then used in construction or automotive industries. Stainless steel is also an input in transportation, including ship containers for the transportation of chemicals, liquids and food products. Many renewable energy technologies also use stainless steel components as they can withstand corrosive environments.
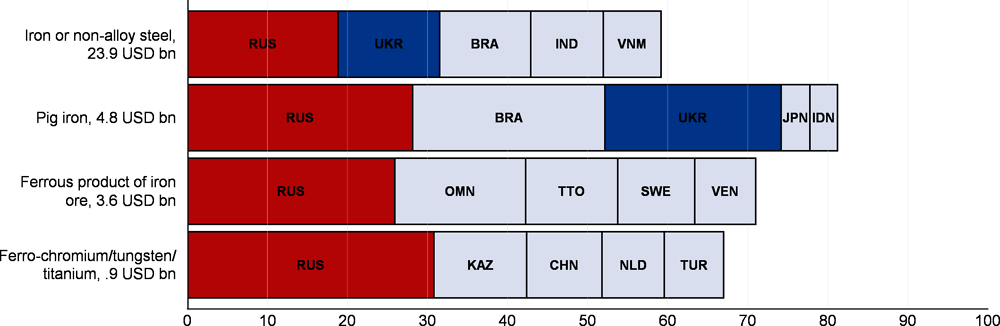
Note: The product “iron or non-alloy steel” corresponds to “iron or non-alloy steel, semi-finished products thereof”.
Source: BACI database from CEPII; and OECD calculations.
Disruptions to transportation could also have long-lasting and deeper costs, and increase congestion in international shipping. Regional blockages arising from Russia and Ukraine could also have stronger ripple effects on freight traffic than seen so far. European firms relying on manufacturing goods produced and assembled in Asia are particularly under pressure, since this merchandise is usually shipped through Russia. Bypassing Russian airspace or ports increases costs and the time taken for deliveries.
Financial sanctions on Russia could also magnify the trade fall by more than assumed in the projections, as has happened in the past. During the 2008-09 global financial crisis the collapse in exports in many countries was disproportionate to that of output, in part due to disruptions to trade credits. Exporting generally involves higher default risks and working capital requirements than domestic activity (Amiti and Weinstein, 2011), reducing the incentives of lenders to provide credit during crises. In the 2014 sanctions on Russia, the financial disruption to the provision of trade finance is also thought to have reduced trade (Crozet and Hinz, 2016).
Inflationary pressures could be stronger and longer lasting than expected
The prices of energy, metals and food commodities have relatively large weights in producer price indices (PPIs). As a result, across the OECD the PPI has risen much more sharply than consumer prices, although there is considerable cross-country variation (Figure 1.30). This is a common pattern, as the other cost components of consumer prices (especially labour costs) tend to be much less variable than commodity prices. Changes in producer selling prices are then passed through into retail prices, potentially with a lag, with the prices charged to consumers also reflecting distribution costs and retailers’ margins. Empirical estimates suggest that if PPIs were to continue rising in the coming months at a pace similar to that seen over the past year, consumer price inflation would be expected to rise further through 2022 in many economies (Box 1.5). Given the potential of the war in Ukraine to result in further upward pressure on a range of commodity prices, together with the possibility of additional supply chain disruptions arising from both the war and China’s zero-COVID policy, a continuation of inflationary pressure coming via producer prices is a clear risk.

Note: Manufacturing producer prices in domestic markets. The consumer price index for euro countries and the euro area refers to harmonised price indices. The OECD aggregate producer price index is for March.
Source: OECD Database on Consumer Price Indices; OECD Database on Producer Price Indices; and OECD calculations.
The rapid rise of producer prices, especially for energy, has opened up an unusually large gap between producer price inflation and consumer price inflation (Figure 1.30). A key question is whether this presages continued upward pressure on the latter. The analysis in this box (developed in more detail in Ollivaud, 2022) suggests that changes in producer price indices (PPIs) explain much of the recent annual increase in consumer prices. Different scenarios for how PPIs may evolve in the coming months suggest that if they continue to rise at a similar pace to the past year, headline consumer price inflation in advanced economies would be expected to continue rising through the end of 2022 (except in the United States, where it would remain broadly flat). If, however, the increases in the PPI were to decline and turn negative, as has been the case after past inflation spikes, there would be a quick slowdown in headline inflation.
Empirical estimates, using seasonally-adjusted monthly data, suggest that consumer price inflation has typically reacted relatively quickly to PPI inflation: nearly a third of the deflation/inflation that producers face is passed through in two months to consumers, with most of the change happening in the same month. The relationship between producer and consumer prices is less robust using core rather than headline consumer price inflation, i.e. excluding energy and food products. In the United States, the euro area and the United Kingdom producer prices are found to have a much smaller effect on core inflation than on the headline measure, with Japan a notable exception. This suggests that much of the association between the PPI and consumer prices comes from the impact of fluctuations in food and energy prices – which are typically reflected relatively quickly in both price series.
An assessment of the recent performance of the estimated equations suggests that consumer price inflation over the past year has typically been somewhat stronger than would have been predicted from producer prices alone (using actual PPI data) (Figure 1.31). The gaps between actual and predicted inflation over the past year are relatively small in Japan and the euro area, but larger for the United States and the United Kingdom. This suggests that additional factors have been important in the latter countries. This could be for instance an increase in employment costs or services prices, with broader consumer price pressures than just those reflected in producer prices.
The estimated equations can also be used to illustrate the possible outcomes for consumer price inflation depending on two different scenarios for near-term PPI developments. First, in a continued-high-inflation scenario, the average month-on-month increase in the PPI is assumed to be equal to the average seen over the past 12 months. This corresponds to an annualised month-on-month increase of 18.5%, 17.4%, 8.2% and 11.7% for the United States, the euro area, Japan and the United Kingdom, respectively. In an alternative scenario, it is assumed that PPI increases will slow and then turn quickly negative, as has been the case when prices have spiked in the past.
If producer prices continue to rise rapidly, as they have over the past year, the analysis suggests that in most cases headline consumer price inflation would continue its upward trend – towards 11½ per cent for the United Kingdom, 10¼ per cent for the euro area and 3½ per cent for Japan – though not in the United States, where it would hover around 6% (Figure 1.32, Panel A).
The alternative scenario where PPI inflation slows and then turns is characterised by a declining consumer price inflation rate (Figure 1.32, Panel B). Nonetheless, inflation would still remain above central bank target rates by the end of 2022, except in Japan.
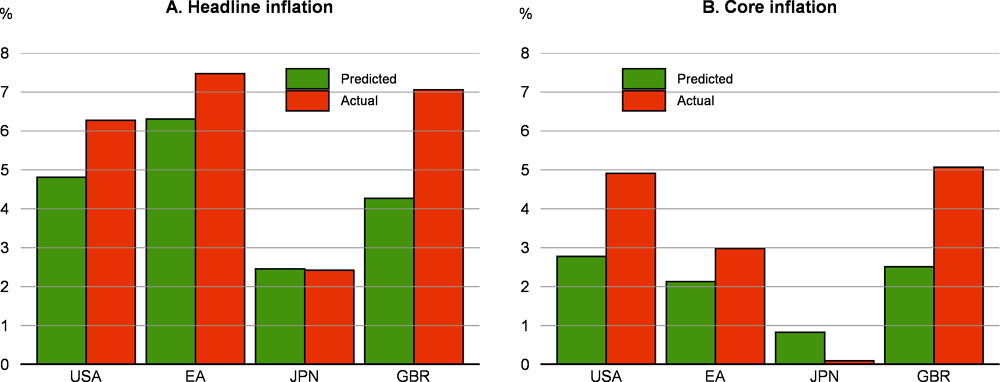
Note: Inflation for April 2022 for the United States and Japan, and March for the euro area and the United Kingdom. Predicted inflation comes from dynamic forecasts from April 2021 using estimated equations for consumer price inflation that relate month-on-month price changes to month-on-month producer price changes, using seasonally-adjusted series. Further details are provided in Ollivaud (2022). Consumer prices correspond to the personal consumption expenditures deflator for the United States, the harmonised consumer price index for both the euro area and United Kingdom, and the consumer price index for Japan.
Source: OECD Database on Consumer Price Indices; OECD Database on Producer Price Indices; and OECD calculations.

Note: Paths for consumer price inflation based on dynamic forecasts from estimated equations using monthly seasonally adjusted data; see Ollivaud (2022). The “High PPI inflation scenario” assumes that the monthly increase in PPI inflation until December 2022 remains at the average over the last 12-months of historical data. The “Low PPI inflation scenario” assumes that the monthly increase in PPI inflation converges gradually to -1% (monthly rate) from its current rate. On a monthly basis, PPI inflation would then become negative from June in the United States and the euro area, and from May in Japan and the United Kingdom. The producer price index is for manufacturing: total producer prices for the United States; domestic producer prices for the euro area, Japan and the United Kingdom. See Figure 1.31 for definition of consumer prices.
Source: OECD Database on Consumer Price Indices; OECD Database on Producer Price Indices; and OECD calculations.
A further key area of uncertainty for the macroeconomic projections, as well as for policymakers, is the extent to which the burst of inflation that has already occurred gives rise to second-round effects, via expectations and labour markets, such that inflation becomes entrenched at above-target levels. Households’ near-term inflation expectations have moved up in many economies, although other measures of expectations are more mixed (Figure 1.33). In most OECD economies with available survey measures, the inflation expectations of professional forecasters have remained close to central bank objectives (including the euro area and Canada) or below (Japan), but there has been some sign of upward drift in the United Kingdom and the United States. Financial market measures of inflation expectations (5-year, 5-year forward inflation swaps or long-term differentials between nominal bond yields and yields on inflation-linked bonds) began to drift up in 2021 and have continued to rise slowly (Figure 1.33, Panel B).
Tight labour markets could generate stronger wage growth than anticipated, especially for workers willing to change jobs and in sectors most affected by the pandemic. The risks of strong wage growth are acute in the United States (Domash and Summers, 2022), with median annual wage growth as measured by the Federal Reserve Bank of Atlanta having already risen to above 6% in April. With the current surge in inflation having resulted in a sharp and unanticipated decline in real wages, attempts to recoup these losses can be expected in wage bargains. Wage growth has started to pick up in the euro area, with area-wide negotiated wages rising by 2.8% over the year to the first quarter of 2022, and by 4% in Germany (incorporating one-off adjustments). Corporate surveys also point to a gradual pick-up as demand tightens (ECB, 2022), although household survey indicators of wage expectations have yet to show a marked acceleration in expected wage increases. Minimum wage increases are adding to aggregate wage growth, especially in Europe, with rises over over 6% likely in the EU in 2022, and particularly large increases in Germany, Greece, Hungary and the Baltic States (Eurofound, 2022).
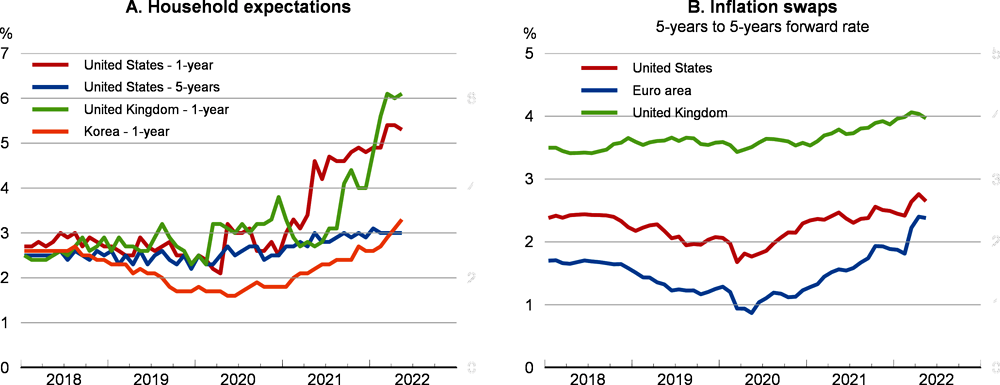
Source: Refinitiv; and OECD calculations.
Potential vulnerabilities in financial markets and emerging-market economies during policy normalisation
Higher policy interest rates, along with global inflationary pressures and a deteriorating growth outlook, could expose the vulnerabilities that have built up from higher debt and elevated asset prices. Rising financing costs, in particular, could affect the repayment capacity of firms and households in the medium term. Tighter global financial conditions and higher risk aversion, in tandem with the impacts of the war in Ukraine, also aggravate potential vulnerabilities in emerging-market economies from rising interest rates and capital flow reversals. Among the latter, commodity-importing economies face heightened fiscal and current account risks from higher global commodity prices.
Corporate indebtedness continued to rise in 2021 in many countries. In the median OECD economy, the debt of non-financial firms reached 106% of GDP in the third quarter of 2021, 15 percentage points above the 1999-2019 average. Tightening financing conditions and the progressive removal of many pandemic-related support measures, such as credit guarantees, raise concerns about corporate debt sustainability even though vulnerabilities have so far been contained. Financing costs for most companies in the largest economies have increased recently but are still moderate (Figure 1.34, Panel A), and debt service ratios remain close to, or below, their historical averages (Figure 1.34, Panel B). Healthy balance sheets and a substantial slowdown in financing needs in 2021 (after a record year in corporate loan and bond issuance in 2020) also limit immediate default risks. Firm-level data show that non-financial companies have started unwinding the very large cash buffers accumulated during the pandemic, but the amount of liquidity on large corporates’ balance sheets is still substantially higher than in the fourth quarter of 2019.16 Many large corporations also took advantage of low rates and quantitative easing during the pandemic to refinance their debt and lengthen its maturity, which will delay the speed at which higher market interest rates are reflected in debt service burdens. In the United States and Europe, the bulk of non-financial companies’ debt is currently set to mature between 2026 and 2028.17
The risk of default for the most fragile firms currently appears contained, but concerns remain. As of the fourth quarter of 2021, the corporate default rate among speculative issuers in the United States – firms with the lowest rating – was still historically low (1.5%), and the median interest coverage ratio (ICR) among firms in this category remained higher than before the pandemic (S&P Global, 2022b). However, the resilience of the most vulnerable firms will ultimately depend on the growth and inflation outlook. Declines in household purchasing power or new COVID-19 variants could hurt sectors such as media and entertainment and consumer products disproportionately.18 Larger-than-expected increases in interest rates could also hamper the ability of financially-stressed firms – those with ICR ratios close to or below one – to service their debt.19 The conflict in Ukraine is also likely to weigh on firms’ access to finance.20

There are also risks that debt service burdens could rise sharply for households. Household debt rose during the pandemic in most OECD countries (Figure 1.37, Panel A), but aggregate household balance sheets are generally healthier than they were before the pandemic, partly due to the savings accumulated in 2020 and 2021 (Figure 1.37, Panel B). Between 2019 and the third quarter of 2021, the aggregate financial net worth of households, measured relative to gross disposable income (GDI), rose by roughly 20 percentage points in the median OECD country. The sensitivity of debt service burdens to interest rates is also limited by the high share of fixed interest rates mortgages in many markets (Box 1.6). However, rising mortgage rates still carry a risk, especially for low-income borrowers in countries where monetary policy could be tightened more aggressively. With housing demand slowing due to the rise in longer-term financing costs, house prices are more likely to stabilise and could even adjust downwards. In this context, further steps could be taken to strengthen macroprudential tools to address risks to households and banks in the housing market (Box 1.6).
House prices, along with household debt, rose steadily throughout the pandemic, even in countries in which valuations were already stretched and debt levels already high. With monetary policy now beginning to normalise, mortgage rates are increasing in many OECD countries, raising solvency concerns. However, vulnerabilities appear contained at present due to households’ relatively strong balance sheets and the limited use of adjustable-rate mortgages (ARM). Still, fragile borrowers could be at risk in economies where ARM dominate, debt-service ratios are high and monetary policy is likely to tighten substantially. The potential adverse consequences for households and financial system resilience of a sharper-than-expected house price reversal also need to be prevented, primarily by macroprudential policy tools.
The pandemic pushed house prices to new heights in many countries
House prices rose strongly and quickly in most OECD countries during the pandemic. Between the fourth quarter of 2019 and the fourth quarter of 2021, real house prices rose by 13% in the median OECD economy (Figure 1.35). On average across countries, real house prices in the fourth quarter of 2021 were about 4% higher than expected based on the underlying trend prevailing before the COVID-19 pandemic, suggesting that the pandemic has exacerbated pre-existing tensions in many housing markets.1 A range of factors can explain this strong and synchronised response of house prices. Exceptionally accommodative monetary conditions, a surge in household savings and unprecedented fiscal support all boosted housing demand during the pandemic, with housing supply temporarily curtailed by mobility restrictions and logistical bottlenecks. Higher financing costs should moderate future housing demand, helping the rise in house prices to abate. A slowdown is already taking place in several key markets, such as the United States, with home sales and prices stabilising or even declining in some large cities, due to rising mortgage rates.2
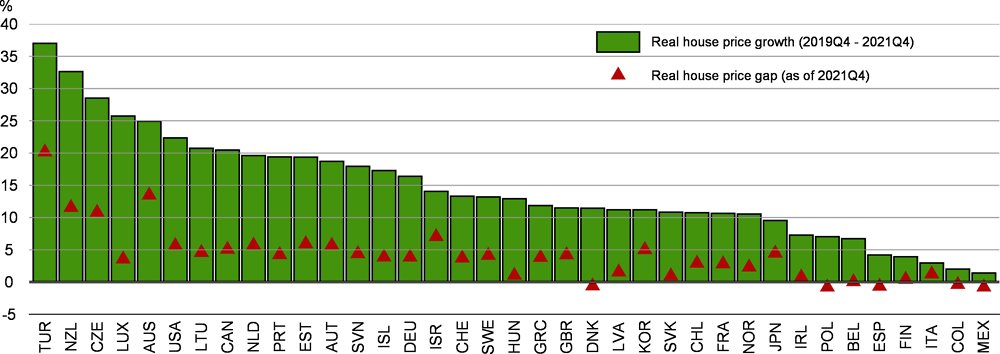
Note: The real house price gap represents the percentage gap between house prices in 2021 Q4 and the country-specific trend estimated for each country by an HP filter. The latter is a proxy of the level house prices would have reached had the pandemic not happened. The real house price index is the ratio of the nominal house price index to the deflator of private consumption in each country. A related measure is proposed as an early warning indicator of financial vulnerabilities by Hermansen and Röhn (2016).
Source: OECD Analytical House Price database; and OECD calculations.
Fixed-rate loans dominate the mortgage landscape
The exposure of households to rising mortgage rates will be damped by the limited use of flexible or adjustable rate mortgages (ARM) in many OECD countries (Figure 1.36, Panel A), although there are also differences across countries in the typical period for which interest rates are fixed (van Hoenselaar et al., 2021). With the exception of Japan and, to some extent, Spain, the largest mortgage markets in advanced economies are heavily dominated by fixed-rate mortgages. In contrast, ARM contracts, which have been shown to be associated with a higher probability of default on mortgages when interest rate rise (Gross et al., 2022),3 are prevalent in several countries in Southern (Portugal and Greece), Eastern (Poland, Bulgaria, Romania and the Baltics) and Northern Europe (Sweden, Finland and Norway). If monetary policy normalisation proceeds gradually, borrowers should be protected from a sharp increase in financing costs over the medium term. Financially fragile borrowers in countries with independent monetary policies and rising inflation pressures could nonetheless experience a substantial rise in their debt servicing costs, particularly in countries where the ratio of mortgage costs to disposable income is already high for the lowest income quintile (van Hoenselaar et al., 2021).
Households’ savings are high and debt service ratios are still low
Household balance sheets are currently stronger than before the global financial crisis (GFC) in many countries. Stronger regulation in the aftermath of the GFC has limited the amount of risk-taking in the household sector over the last decade. In addition, the recent rise in household debt has been matched by a significant rise in household savings during the pandemic. These savings should support the repayment capacity of many households exposed to adjustable rates, especially if interest rates were to increase more rapidly than expected. Moreover, the low interest rate environment is still keeping average debt service ratios (DSR) in the household sector close or even below their long-term norms (Figure 1.36, Panel B), and significantly below what is considered a stressed DSR.4 However, aggregate numbers might conceal important heterogeneity, and risks remain that the repayment capacity of low-income borrowers could deteriorate, given the withdrawal of pandemic income support measures and higher inflation.5

Note: The level of household credit is measured as of 2021 Q3, and the average share of ARM at issuance in 2019 and 2020 is used to proxy for the importance of each type of mortgage in each country.
Source: European Mortgage Federation; Australian Bureau of Statistics; Mortgage Professionals Canada; Japan Housing Finance Agency; US FHFA, National Mortgage database; BIS Credit Database; and OECD calculations.
Macroprudential policies could be strengthened further
Real estate prices might adjust more abruptly. A sharp deterioration in the growth outlook, or a sudden increase in inflationary pressures, could accelerate a correction in housing markets, with potentially damaging consequences for households’ and banks’ balance sheets. Given the large uncertainty surrounding the outlook, it is critical that there are adequate buffers in the banking sector to ensure resilience to unexpected fluctuations in property markets.
Most countries already have policies in place to limit over-indebtedness and associated risks. Following ESRB recommendations (ESRB, 2022), many European countries have recently announced increases in their countercyclical buffer (CCyB) after some relaxation during the pandemic, including some measures explicitly targeting risks in the real estate sector. For instance, Germany’s financial regulator, BaFin, proposed in January 2022 to (i) raise the countercyclical buffer on banks’ domestic exposures to 0.75% of risk-weighted assets (RWAs) from 0% and (ii) to apply an additional systemic risk buffer of 2% of RWAs specifically targeted at residential real estate mortgage loans
Preventive measures to limit further price increases, such as additional steps to lower LTVs or DSTI ratios, might also be welcome to moderate risks. Some countries have already taken steps to tighten existing tools to moderate new housing loans, while others could consider implementing those tools.6 In addition to these macroprudential instruments, reforms in rental regulation and property taxation may also be effective means of addressing housing pressures over time. Those tools, along with stronger public investment in social housing and potential land use reforms, especially in job-rich urban areas, could ease the tensions that are still likely to prevail in the medium term (OECD, 2021b). Although the supply of new construction slowed down only moderately during the pandemic, new housing permits and starts dropped significantly in many OECD countries.7 This gap, along with ongoing supply bottlenecks and labour shortages, is likely to amplify the structural housing shortages affecting many countries.
← 1. Price-to-rent and price-to-income ratios were already pointing to stretched housing valuations in many OECD countries before the pandemic and reached historic highs in almost all countries in early 2021.
← 2. In the United States, the Mortgage Bankers Association’s Purchase Index, which tracks mortgage applications, fell 15% year on year during the week ending May 13, with mortgage interest rates having risen by 2 percentage points over the same period. In most countries, the rise in mortgage rates is not yet visible in official statistics because of reporting lags. House price growth also moderated in the first quarter of 2022 in Australia, and the Reserve Bank of Australia (2022) has estimated that a 200 basis point increase in interest rates would result in real house prices falling by around 15% over a two-year period. In Canada, mortage rates are expected to have an immediate impact on new homebuyers and only a gradual one on existing homeowners (Kozicki, 2022).
← 3. Gross et al. (2022) assess the sensitivity of household mortgage probabilities of default (PD) and loss given default (LGD) to changes in unemployment, house prices and interest rates using data from 21 EU countries and the United States, and find that the PDs are much more sensitive to changes in short-term interest rates in countries with a high share of ARMs.
← 4. The notion of a stressed DSR varies across countries, but a debt service ratio above 40-50% is often considered as stressed (ESRB, 2022). The DSR data provided by the BIS (Figure 1.36) cover all types of household debt and should therefore be interpreted as an upper bound of the true mortgage repayment burden.
← 5. Emerging-market economies face tighter fiscal constraints than advanced economies, making it more difficult to put in place fiscal measures to mitigate the economic impact of the COVID-19 pandemic. This has led to a further increase in household debt. With household debt standing at 50% of GDP, emerging-market economies now have about the same levels of leverage as advanced economies had in 2001, just a few years before the global financial crisis, and substantial interest rate increases to address inflation are being implemented.
← 6. Austria’s Financial Market Stability Board (FMSG) asked the country’s bank supervisor and central bank in December 2021 to make its sustainable mortgage lending guidance legally binding by mid-2022. The guidance was issued in 2018 and includes a minimum down payment of 20% (equivalent to an 80% loan-to-value (LTV) cap), a debt-service-to-income (DSTI) ratio of no more than 40% and a maximum loan term of 35 years, except in exceptional circumstances. Germany could also consider formally implementing LTV and DSTI ratios, which are still missing despite the establishment of a legal framework for borrower-based instruments in 2017 (ESRB, 2022).
← 7. Housing permits in 2020 dropped by roughly 15%, on average, compared to 2019 in a sample of the largest OECD economies. Although in most countries permits bounced back to pre-pandemic levels in 2021, the gap in new constructions has not yet been fully offset. This will negatively affect the total supply of new homes available over the next few years.
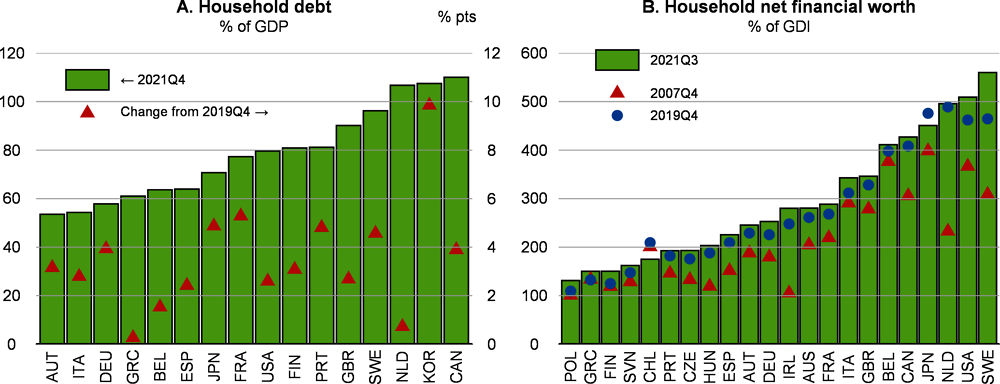
The war in Ukraine exacerbates vulnerabilities in many emerging-market economies
The Russian invasion of Ukraine has further tightened financial market conditions for commodity-importing economies and heightened concerns about emerging-market economy vulnerabilities to scarcer and more expensive financing. Higher commodity prices also compound the challenges from pre-existing inflationary pressures and put further pressure on fiscal and current account balances in commodity-importing economies (Box 1.1). Pandemic risks also linger, amidst an uneven pace of vaccination across countries and regional COVID-19 outbreaks. Emerging-market economies also remain vulnerable to capital outflows from faster and more extensive policy interest rate rises in advanced economies.
When the war in Ukraine broke out, local-currency government bond yields surged in all regions accompanied by an abrupt repricing in equity markets, reflecting a generalised increase in risk aversion. Tighter global financial conditions have also increased financial market volatility in emerging-market economies. In particular, local-currency government bond spreads have remained high in many countries, except in Asia, amid currency depreciation pressures (Figure 1.38, Panel A). Foreign-currency bond spreads have recently exceeded 10 percentage points in almost a quarter of a larger set of emerging-market and developing economies (IMF, 2022a), indicating significant sovereign borrowing difficulties. Equity prices have declined sharply in Asia, reflecting concerns about China, and been volatile in other major emerging-market economies (Figure 1.38, Panel B).
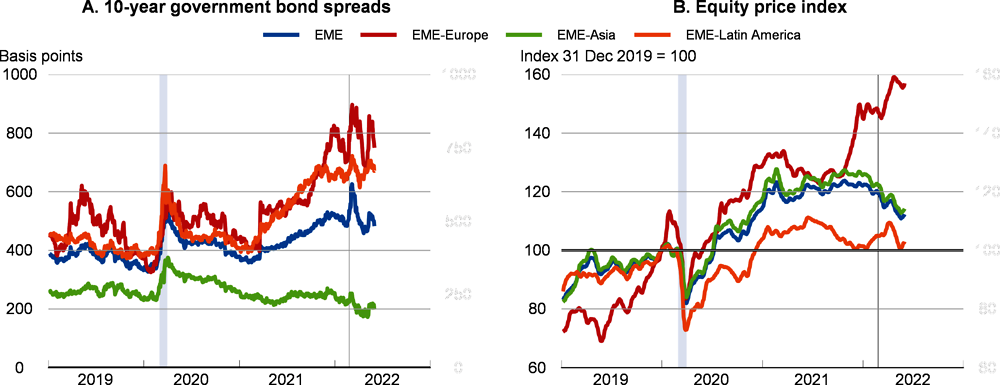
Note: Panel A shows the yield differential between 10-year local-currency government bonds in emerging-market economies and 10-year US Treasuries. Aggregate spreads correspond to unweighted cross-country averages. The regional equity indexes shown in Panel B are obtained by first converting individual local-currency indices to dollars and then aggregating them based on their market capitalisation weight. The shaded area in both panels denotes March 2020. The vertical line in both panels denotes 24 February 2022. “EME – Europe” covers Bulgaria, Romania and Türkiye. “EME – Asia” covers China, Indonesia, India, Malaysia, the Philippines, Thailand and Vietnam. “EME – Latin America” covers Brazil, Chile, Colombia and Mexico. The “EME” aggregate covers all these countries plus Russia and South Africa. Both panels show 10-day moving averages.
Source: Refinitiv; and OECD calculations.
Elevated public and private debt levels and a high share of foreign-currency liabilities aggravate vulnerabilities to rising interest rates and capital flow reversals. Prior to the war in Ukraine, total debt as a share of GDP was gradually declining in the major emerging-market economies, helped by the larger-than-anticipated increase in inflation.21 Nonetheless, the ratio of total debt to GDP, and in particular government debt to GDP, often remains well above pre-pandemic levels (Figure 1.39, Panel A). Emerging-market and developing economies issued around USD 3.5 trillion of sovereign debt in 2021, almost 40% higher than the average annual amount issued in 2017-19 (OECD, 2022b).22 The share of foreign-currency debt in new issuance has declined considerably in Latin America and the Middle East-North Africa region, suggesting that governments have focused on domestic markets amid rising external borrowing costs. However, with high government debt typically associated with a larger share of the government in total banking sector claims, this could hamper the access of private sector borrowers to credit (Figure 1.39, Panel B). The overall share of central government debt denominated in foreign currency also remains high in Argentina, Bulgaria, Romania and Türkiye, ranging between 50 and 70%. Should capital outflows from emerging-market and developing economies intensify, resulting in further currency depreciation, the debt burdens of those countries could increase significantly. Sovereign default risks, which have already materialised in Lebanon and Sri Lanka, are heightened by the sizeable (one third) share of variable-rate debt in the total external debt of the poorest countries (Estevão, 2022).

Note: In Panel A, debt comprises loans and debt securities, and GDP takes the sum of the four quarters finishing in the quarter debt referred to. In Panel B, for Russia, local-currency claims on all sectors in 2021Q3 are used in the denominator due to missing data; for the remaining countries, claims on non-banks denominated in all currencies are used. Bank claims on the private sector in Panel B are calculated by subtracting bank claims on general government (collected from the IMF Sovereign Debt Investor Base database) from all claims on non-banks (collected from the BIS credit statistics except for Türkiye). General government debt in Panel B follows the definition in the IMF Sovereign Debt Investor Base database and excludes intergovernmental debt.
Source: OECD Economic Outlook 111 database; BIS credit statistics; IMF Sovereign Debt Investor Base for Emerging Markets database; Banking Regulation and Supervision Agency in Türkiye; and OECD calculations.
Broad-based commodity price increases and weaker growth in major export markets add to existing macroeconomic vulnerabilities in many emerging-market economies (Figure 1.40). Higher food and energy prices raise external deficits in many countries, and disruptions to agricultural exports from Russia and Ukraine heighten food security risks if alternative suppliers cannot be found (Box 1.1). Weaker growth in the euro area – a major export market – is adding to the immediate costs from exposure to Russia in countries like Bulgaria, Egypt, Romania and Türkiye (Figure 1.40, Panel C). Similarly, the gradual slowdown in the United States creates headwinds for growth in Mexico and other Latin American economies.
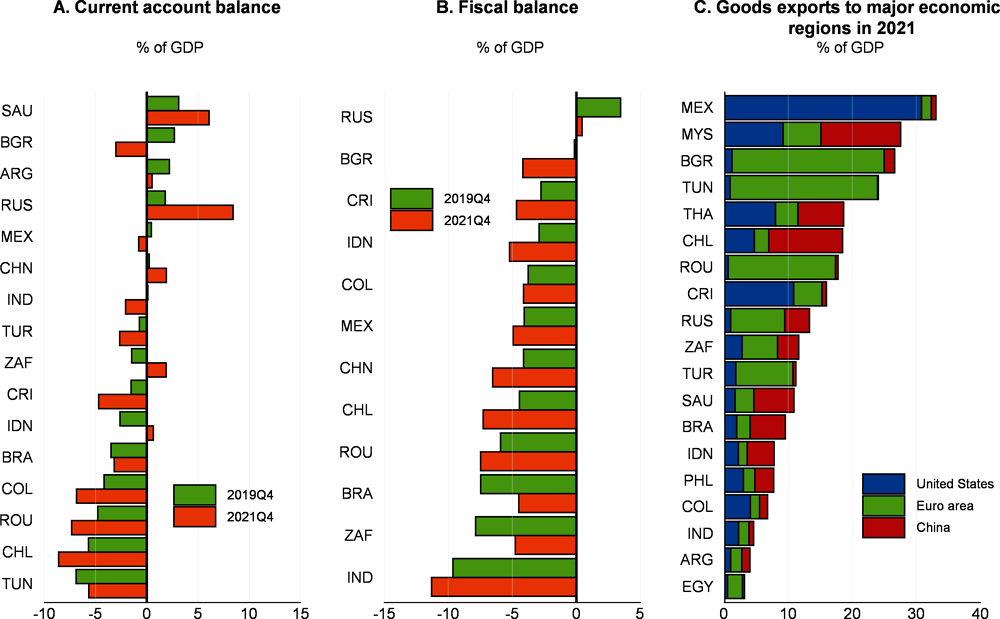
Note: Fiscal balance refers to central government net lending for Chile and general government net lending for the remaining countries.
Source: OECD Economic Outlook 111 database; IMF Direction of Trade statistics; IMF World Economic Outlook database; and OECD calculations.
Elevated uncertainty, and the implications of the war in Ukraine for growth, inflation and commodity markets add to the challenges already facing policymakers from rising inflationary pressures and the imbalanced recovery from the pandemic. Multilateral action remains vital to secure the recovery, provide the assistance needed to refugees and developing economies and durably improve prospects for sustainable and equitable growth. Monetary policy should remain focused on ensuring well-anchored inflation expectations, with normalisation proceeding at a different pace across the major economies. Temporary fiscal measures are appropriately being used to cushion the immediate impact of higher food and energy costs for consumers and businesses, but the medium-term consolidation path planned prior to the war will need to be resumed to help fund the energy transition and new priorities such as higher defence spending, especially where demand pressures are contributing to inflation.
Preserving international co-operation would help overcome the pandemic and global challenges from the war
The COVID-19 pandemic is not yet over, with risks remaining that further variants of concern could emerge. Vaccination efforts are continuing around the world, but remain limited in many countries. Only 11% of the population in low-income countries are fully vaccinated, compared with over 70% in high-income countries (WHO-World Bank, 2022). The recovery will remain precarious in all countries until vaccination levels can be raised and test and treatment capacities are improved. Global vaccine supply shortages have now largely been addressed, but effective multilateral actions are required to help overcome domestic logistical hurdles to vaccine deployment by providing technical and financial assistance, reducing regulatory barriers on vaccines and other medical products, and by keeping borders open.
Cross-country engagement and actions also remain vital to address the challenges arising from the war in Ukraine, including overcoming disruptions and supply constraints in energy and food markets, and providing humanitarian assistance to those displaced by the war. Developing economies are particularly exposed to these challenges, which come on top of the persisting scars from the pandemic in many of them. Open and accessible markets, provision of financial assistance to the most vulnerable countries and populations, and multilateral measures to maintain liquidity in global financial markets and provide effective debt relief to lower-income countries are essential to help promote a sustainable recovery in all countries. Preserving and strengthening international co-operation would also help countries progress faster towards national COP26 objectives to mitigate climate change. The Inclusive Forum on Carbon Mitigation Approaches proposed by the OECD would provide a comprehensive inventory of policy actions and best practices worldwide, and help to compare the effectiveness of policies in different country circumstances.
The war in Ukraine is also adding significantly to pre-existing food security issues. Prior to the war, over 800 million people worldwide were already estimated to be facing hunger (FAO, 2021), with the numbers rising due to the impact of other conflicts, climate change and the pandemic. Ongoing disruptions to agricultural exports from Russia and Ukraine could result in serious shortages in many developing economies, especially in Africa and the Middle East and Central Asia, and exacerbate food price increases that are already weighing on vulnerable social groups. The food supply shock could be further compounded by fertiliser shortages (Box 1.1). To monitor and mitigate such risks, co-ordinated actions are needed urgently to provide emergency food supplies and the assistance necessary to facilitate crop planting and transportation, including in Ukraine, tackle logistical barriers limiting the supply of food to importing economies, and refrain from export restrictions of food and other agricultural products.
The pace of monetary policy normalisation should vary across economies
The impact of the war in Ukraine has added to the difficult choices already facing monetary policymakers. Ahead of the invasion, inflationary pressures were already proving stronger and more persistent than anticipated, albeit to a different extent and for different reasons across the major advanced economies. Recent months have thus seen steps towards monetary policy normalisation by many central banks. Policy interest rates are now being increased in a growing number of major economies, and net asset purchases have been halted or further reduced in most jurisdictions (Figure 1.41). Several central banks have also started to discuss or implement strategies for balance sheet reduction, either passively (by not reinvesting the proceeds of maturing bonds) or actively (through asset sales). In most jurisdictions, these changes could proceed more rapidly than expected in the event of further upside inflation surprises or stronger signs of a durable rise in underlying cost and price pressures.
In the United States, the Federal Reserve began to increase the target for the federal funds rate in March. As of June, the Federal Reserve is also starting to reduce its holdings of Treasury securities, agency debt and agency mortgage-backed securities by reinvesting principal payments only if they exceed a monthly cap.23
The ECB ended net asset purchases under the Pandemic Emergency Purchase Programme in March, and has signalled that it expects those under the remaining Asset Purchase Programme (APP) to be concluded early in the third quarter of 2022.
The Bank of England, the Bank of Canada and the Reserve Bank of Australia have ceased to reinvest the proceeds of maturing bonds in recent months and have all raised their main policy rates.
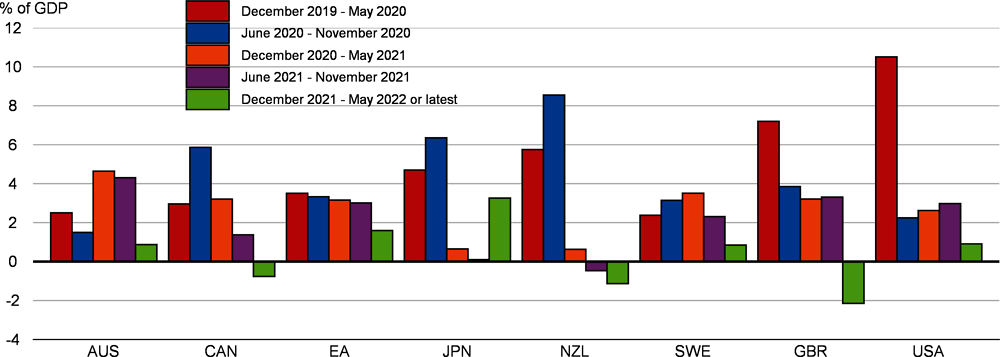
Note: For Canada and New Zealand, latest available data are for April 2022. Data covers both private and public assets. Private assets include corporate bonds, commercial paper, asset-backed securities and exchange traded funds. General government bonds are treasury bills and municipal, state and central government bonds.
Source: Reserve Bank of Australia; Bank of Canada; Bank of England; European Central Bank; Bank of Japan; Reserve Bank of New Zealand; Sveriges Riksbank; US Federal Reserve; and OECD calculations.
Given the uncertain duration and magnitude of the adverse supply shock from the war, and above-target inflation, monetary policy should remain focused on ensuring well-anchored inflation expectations and intervene if necessary to ensure the smooth functioning of financial markets and transmission of monetary policy. Central banks will have to conduct a delicate balancing act between keeping inflation under control and maintaining the post-pandemic economic rebound, especially where the recovery is not yet complete. The case for a steady policy tightening is stronger in those economies, such as the United States or some central European countries, where the recovery from the pandemic is essentially complete and signs of excess demand and durable inflation pressures were already apparent before the most recent commodity price surge. In contrast, removing accommodation more gradually is appropriate in countries where core inflation is moderate, wage pressures have yet to pick up and the growth outlook has deteriorated considerably because of the Ukraine conflict. Transparency and clarity in central bank communication will be critical. Increases in policy interest rates should remain data-dependent so that central banks can respond to unexpected developments in activity and labour markets, financial conditions and the broader inflation outlook without endangering financial stability. The importance of data-dependence is greatest in the economies most affected by the war in Ukraine.
Monetary policy normalisation is projected to continue over the next 18 months in most jurisdictions, at a faster pace than anticipated in late 2021 (Figure 1.42). However, its speed and strength are expected to vary widely across regions, given the different prospects for inflation and growth. The advanced economies differ substantially in terms of domestic underlying macro-economic conditions and exposure to external shocks such as the war in Ukraine. This heterogeneity, combined with exceptionally large uncertainty surrounding the growth and inflation outlook, translates into very different paths for monetary policy:
In the United States, where the recovery is well advanced, and core inflation is over 5%, the federal funds rate is projected to be raised swiftly to 2¼-2½ per cent by end-2022 and to 3-3¼ per cent by end-2023. The reduction in asset holdings is expected to proceed steadily over the projection horizon by reinvesting payments from maturing securities only partially. Long-term interest rates on government bonds are also projected to tighten, reaching 3.8% by end-2023.
In the euro area, net asset purchases are projected to end early in the third quarter of 2022, with the deposit rate raised from -0.5% to 1% by the second quarter of 2023 and the main refinancing rate raised from 0% to 1.5%. Maturing bonds are expected to be fully reinvested over the projection period, keeping the size of the ECB’s balance sheet unchanged. The ECB should make use of all margins of flexibility when reinvesting the proceeds of maturing bonds, particularly assets acquired under the pandemic emergency purchase programme, to limit financial fragmentation in the euro area.
With Japan facing still-mild underlying inflationary pressures and only a small direct exposure to the Ukrainian conflict, the Bank of Japan is projected to maintain its current accommodative stance focused on yield curve control over the projection horizon, with no change in policy rates being assumed.
Other major central banks are expected to tighten their policy stance further over the projection horizon, albeit at a different pace and with different end-points. The Bank of England is projected to increase its policy rate to 2.5% by mid-2023 and to continue to reduce the size of its balance sheet. The Bank of Canada is assumed to raise its policy rate steadily to 2.5% by early 2023, and to continue passive quantitative tightening throughout the projection period.
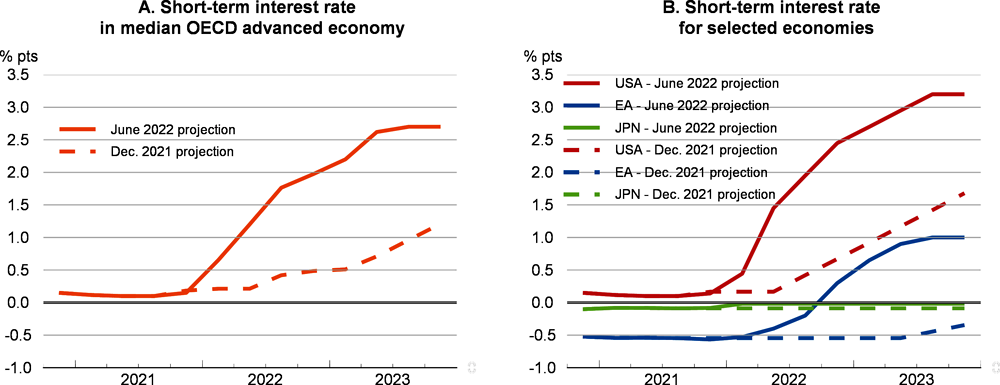
Note: In Panel A, lines report the rate for the median advanced economy (AE). AEs include Australia, Canada, the Czech Republic, Denmark, the euro area, Hungary, Iceland, Israel, Japan, Korea, New Zealand, Norway, Poland, Sweden, Switzerland, the United Kingdom, and the United States. Short-term interest rates refer either to the 3-month money market rate or the 3-month treasury bill rate, depending on the country.
Source: OECD Economic Outlook 111 database; OECD Economic Outlook 110 database; and OECD calculations.
The scale and impact of quantitative tightening (QT) plans remain uncertain. Most central banks have, or will soon have, ended asset purchases, and many have begun to stop reinvesting the proceeds of maturing assets, but few have yet indicated whether assets will be sold actively or communicated the terminal size of their balance sheets. The main economic impact of quantitative easing has occurred through reductions in bond yields and increases in asset prices. Quantitative tightening is likely to reverse this, with some upward pressure on bond yields and downward pressure on asset prices, particularly if active asset sales take place. The extent of such adjustments will depend on whether asset disposals occur in a gradual and predictable manner, as planned by the major central banks, and the overall scale of balance sheet reduction.
Nonetheless, the impact of reductions in the balance sheet may be smaller than the past impact of asset purchases (Pill, 2022). Discretionary asset reductions imply that financial markets are functioning well (as they would not occur otherwise), whereas the benefits of QE have arisen partially from improvements in market liquidity at times when financial markets were not functioning smoothly. QE policies also had significant effects by signalling the implementation of a more accommodative monetary policy stance at a time when policy interest rates were at or close to their effective lower bound. This signalling channel is likely to be less important during QT, with increases in policy interest rates and their future expected path used as a timely and clear signal of a change in the monetary policy stance. Normalisation strategies may however still vary across economies. In contrast to the United States, monetary policy in the euro area will have to be mindful of fragmentation risks, and take steps to address these if necessary, since QT announcements might tighten the monetary stance disproportionately in some economies.24
Fiscal policy support should be contingent on the state of the economy
Fiscal consolidation plans for the current year have been reconsidered in many countries due to the war in Ukraine and soaring energy prices. Countries have continued to withdraw pandemic-related support measures, but also are addressing new immediate budget priorities. These tend to be more acute in Europe, including the costs of shielding households and companies from surging energy and food prices (discussed below) and of providing for Ukrainian refugees. The latter costs are highly uncertain, but available estimates point to amounts of around 0.2% of EU GDP in 2022 (Box 1.2), largely financed by EU funds. With a few exceptions, such as Poland and some Baltic countries, national Stability or Convergence Programmes suggest similar or even smaller estimated costs.
Fiscal projections for 2022-23 are conditional on announced government measures and OECD assessments of current plans (Annex 1.A.). In the median OECD economy, the fiscal stance is estimated to be broadly neutral in 2022, with the underlying primary balance increasing by 0.2% of potential GDP in 2022, before rising by 0.7% in 2023 (Figure 1.43). Relative to expectations in late 2021, this implies a considerable slowdown in the pace of consolidation in the current year:
In the United States, fiscal policy assumptions are based on legislated measures only and imply substantial fiscal tightening, with the underlying primary balance projected to improve by over 6% of potential GDP over 2022-23. The withdrawal of pandemic-related support measures, many of which expired in the course of 2021, is expected to outweigh the additional public investment in 2022-23 under the Infrastructure Investment and Jobs Act.
In the euro area, the fiscal stance is projected to remain broadly neutral in 2022. The unwinding of measures introduced during the pandemic is expected to be offset by support for energy consumers and refugees and stimulus from the implementation of Next Generation EU (NGEU) plans. The projected overall absorption of NGEU grants until the end of 2023 remains in line with expectations in late 2021, exceeding 0.5% of euro area GDP in 2022-23. In 2023, fiscal consolidation of 0.8% of potential GDP is expected, mainly driven by the withdrawal of support to energy consumers and the full termination of COVID-19-related measures (which sometimes were still in force in early 2022).
In Japan, the fiscal projections reflect the economic package announced in late 2021 and legislated in the FY2021 supplementary budget and the FY2022 initial budget, complemented by more recent temporary measures to support vulnerable households and businesses. The ensuing discretionary fiscal expansion, estimated at close to 2% of potential GDP in 2022, is expected to be largely reversed in 2023 as the stimulus measures expire.
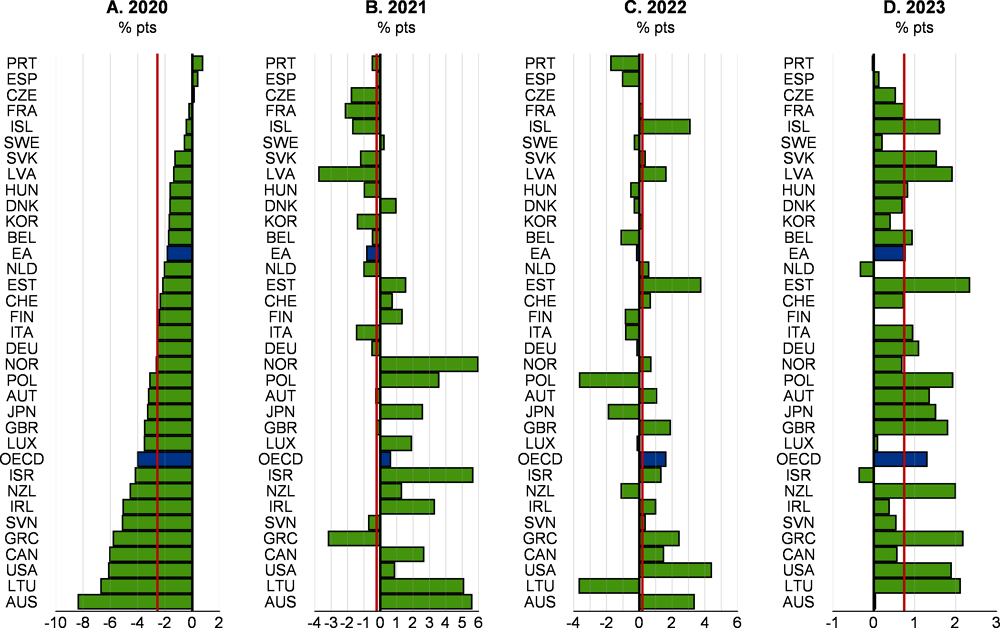
In the short term, fiscal policy should tackle the adverse distributional impacts of higher energy prices whilst avoiding adverse effects on the sustainability of the public finances or the transition to carbon neutrality. Given the acceleration of energy prices this year, countries, especially in Europe, have put in place a wide range of measures to support energy consumers (Figure 1.44), with budget costs in 2022 projected to exceed 1% of GDP in France, Germany and Italy. To help finance those costs, a number of European countries have enacted windfall profit taxes on energy companies. Policy action to help cushion the impact of higher energy prices should be well-targeted, not outlast the period of exceptional price pressures and avoid weakening price signals. Additional means-tested transfers to households while high prices persist generally meet these criteria, though finer targeting mechanisms that go beyond income, should be developed (OECD, 2022c). In contrast, lower taxes on energy or price controls, which have been the most widely used forms of support, tend to be untargeted. These measures are often administratively simpler and faster to implement, and help preserve aggregate household disposable income, an appropriate policy goal in economies where demand is still recovering from the pandemic. However, untargeted price support should not stay in place for more than some months due to the high fiscal costs involved and the need to avoid damaging incentives to reduce energy consumption and undertake the investments required to improve energy efficiency and develop alternative sources of energy.

Note: The figure is based on data collected for 35 OECD member states plus Bulgaria, China, India and Romania up to 30 May 2022. Support measures fall under two categories: income support (including lump-sum transfers to consumers) and price support measures, which lower energy prices paid by consumers. For income support, 'Other' includes loan guarantees for energy companies. For price support, 'Other' includes energy market regulatory changes. Targeted measures resort to means-testing or benefit only certain categories of consumers based on their energy consumption and other criteria. Non-targeted measures apply to all consumers with no eligibility conditions.
Source: OECD calculations.
Fiscal policy should also take account of potential interactions with monetary policy and help, when appropriate, to moderate inflation pressures. Price support measures for energy consumers decrease inflation in the short run and may thus help anchor inflation expectations, but their necessary withdrawal after a limited time span could rekindle price pressures. In countries where inflation is particularly high and there are signs of excess demand, such as the Baltic countries or Central and Eastern European economies, a tighter fiscal stance should play a role in countering demand pressures, especially in the absence of an autonomous monetary policy. Given that those countries are often welcoming large numbers of Ukrainian refugees and, in some cases, plan to increase defence spending soon, tighter fiscal policy calls for expenditure restraint elsewhere or for higher taxes.
Over the medium and long term, the conflict in Ukraine is raising new fiscal priorities and thus reinforcing the need to change the composition of the public finances. In Europe, many countries are planning to increase expenditure on defence. Higher spending targets have often been set for well beyond the end of the projection horizon, but in a few countries, such as Germany and Poland, a large increase (in the range of 0.5 to 1% of GDP per year) has been announced already for 2022-23. In addition, the goal of reducing reliance on fossil fuel supplies from Russia has lent new urgency to investments in clean energy and energy efficiency, whose budgetary costs go clearly beyond NGEU grants (OECD, 2021a).25 As an alternative to increasing tax burdens, countries will need to revisit the allocation of public spending across budget items and functional areas, and seek to reduce outlays which tend to be detrimental to growth, such as subsidies, while ensuring compensating measures to prevent adverse impacts on inequality. Achieving efficiency gains in spending should also be a priority, which for both defence and clean energy spending may require coordination across countries, be it within military alliances and procurement programmes, or as regards grid and recharging infrastructure.
Beyond 2023, rising debt service burdens are also likely to compound challenges for the public finances. After declining for several years, implicit interest rates on public debt are now levelling out over the projection horizon, as ongoing and expected monetary policy normalisation pushes up long-term interest rates (Figure 1.45). The eventual upward pressure on debt service burdens in the medium term will ultimately be heightened by elevated public debt levels (Rawdanowicz et al., 2021). Credible fiscal frameworks with strong national ownership can provide clear guidance to citizens and markets about the medium-term trajectory of the public finances and help implement reforms to public expenditure.
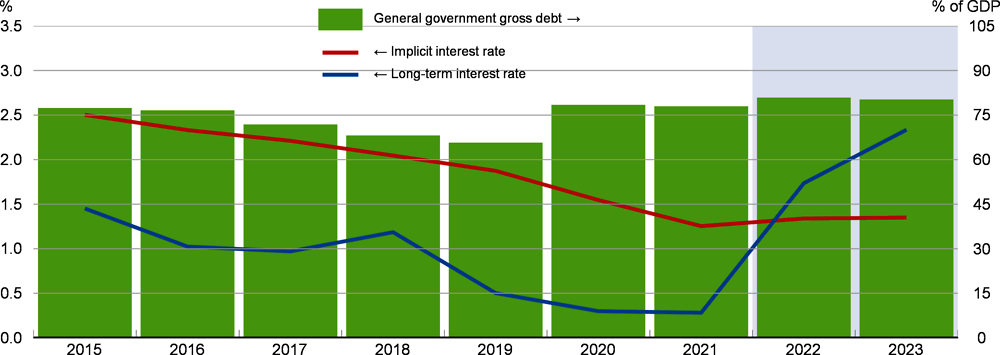
Note: The implicit interest rate is defined as general government interest payments divided by general government gross financial liabilities at the end of the preceding year.
Source: OECD Economic Outlook 111 database; and OECD calculations.
Emerging-market economies have limited scope for additional policy support
Persistent inflation pressures in many emerging-market economies, where food has a large weight in spending and consumer prices (Figure 1.46), and the ongoing policy normalisation in advanced economies have led to multiple policy rate increases in recent months despite continued economic slack. These factors will likely prompt further monetary policy tightening in the remainder of 2022. In 2023, rate increases are projected in some emerging-market economies, with policy rates remaining at high levels in many others. Inflation expectations in many emerging-market economies are often more sensitive to inflation shocks, and thus less well-anchored, than in advanced economies (Ha et al., 2022). Given the large potential impact of food and energy price increases on wage demands and inflation expectations, central banks in emerging-market economies have tightened policy in response to surging headline inflation, even if core inflation developments have been more moderate. Additional monetary policy tightening should be accompanied by clear communication and careful adjustment of the pace of the tightening to re-anchor inflation expectations. Countries with low public debt-to-GDP ratios should ensure that the pace of policy tightening is strong enough and frontloaded to contain inflation expectations, with rising interest rates less likely to put public debt sustainability at risk.

Note: CPI weights follow the 2018 COICOP classification for Costa Rica and the 1999 COICOP classification for the remaining countries. Data as of 2017 for Russia, and as of 2021 for the remaining countries. “Advanced OECD” refers to an unweighted average across OECD member countries, excluding Chile, Colombia, Costa Rica, Mexico and Türkiye.
Source: OECD Database on Consumer Price Indices.
The pace and extent of policy rate increases is expected to continue to vary widely across major emerging-market economies. In Latin America, policy tightening has been frontloaded, given the inflationary effects of supply-chain disruptions in Mexico, the need to strengthen the macroeconomic policy framework and offset very high inflation in Argentina, and inflationary pressures in Brazil stemming from an acceleration in energy and food price increases. In India, after an initial rise in May 2022, policy rates are projected to increase further amid persisting inflationary pressures. In contrast, monetary policy tightening in Indonesia is projected to be only limited, helped by milder inflation pressures. Reductions in reserve requirement ratios and benchmark interest rates have recently taken place in China to address the slowdown in growth, but no additional monetary policy easing is projected. In Türkiye, policy rates are projected to stay unchanged given the authorities’ commitment to an accommodative monetary policy stance, even though negative real policy rates could increase currency volatility and add to inflationary pressures.
The scope for additional fiscal support to protect vulnerable consumers from more expensive food and energy is limited in many emerging-market economies, with fiscal deficits often still considerably above their pre-pandemic levels (Figure 1.40, Panel B). Rising financing costs also decrease the room for manoeuvre in commodity-importing countries. For instance, sizeable social transfers and VAT reductions introduced to offset the effects of rising commodity prices may put fiscal sustainability at risk in Türkiye.26
Commodity-exporting countries, whose budgets often benefit from higher commodity prices, need to strike a balance between restoring sound public finances and using windfall revenues to complete the recovery from the pandemic and support vulnerable citizens. For example, in South Africa, financing the prolongation of social programmes created during the pandemic with the surge in fiscal revenues is projected to support household incomes while preserving debt sustainability. In contrast, fiscal policy is projected to be expansionary in Brazil, with spending pressures from forthcoming presidential elections going beyond windfall revenues.
There are also some possible longer-term consequences from the war, including pressures for higher spending on defence in Europe and elsewhere, changes to the structure of energy markets, potential fragmentation of payment systems, reformulation of supply chains, and shifts in the composition of foreign exchange reserves. A re-division of the world into blocs separated by barriers would sacrifice some of the gains from specialisation, economies of scale and the diffusion of information and know-how. These changes would diminish the efficiency gains from having a global trade and financial system with a single dominant reserve currency.
Enhancing energy security via new sources of supply and a stronger push to low-carbon sources
The current crisis has highlighted the issue of energy security in the longer term, with many OECD countries still heavily reliant on fossil fuel energy and supply from Russia, as well as the need to hasten the transition to net zero emissions by 2050 (IEA, 2021a). Energy security concerns many aspects: energy system disruptions (extreme weather conditions or accidents), short-term balancing of demand and supply in electricity markets, regulatory failures and the reliability of supply from producers of fossil fuel resources. Energy systems have also become more interconnected across the world. This brings new opportunities but also challenges.
There is an inextricable link between energy security and climate change, as energy represents between half and two-thirds of total greenhouse gas emissions. The efforts needed to carry through on the pledge to net-zero emissions by 2050 are important (IEA, 2021b), notably to address future emissions of existing energy-related infrastructure – power and industrial plants, buildings and vehicles. In the longer term, OECD countries should reduce their overall reliance on fossil fuel imports by providing appropriate incentives to move away from fossil fuels and investing significantly in clean energy and energy efficiency. In Europe, improving the interconnection among domestic electricity grids can reduce energy costs and improve security. Improved storage capacity and diversification of energy sources will be necessary to limit volatility in oil and gas markets during the energy transition.27
There is no single policy mix to successfully achieve decarbonisation, given differences across countries in industrial structure, preferences and fiscal constraints. A mix of policy actions including effective carbon pricing, changes in standards and regulation, and structural reforms will be needed to reduce emissions at a minimum cost and facilitate the reallocation of resources towards low-carbon activities (D’Arcangelo et al., 2022). More generally, a strategic clean energy transition should aim to reduce vulnerabilities along the way, and be coupled with investment in innovation to develop the technologies needed for net-zero. Public acceptance of such policies will also be vital, as many poorer households face hard consumer choices when prices surge. Steps to improve funding for green infrastructure and low-carbon policies would help to improve public acceptance, together with appropriate redistributive policies that provide help to the most affected households.
Restructuring global-value chains could have costs
The COVID-19 crisis has put global value chains (GVCs) under high pressure and the war in Ukraine is adding further stress, testing the resilience of a production model grounded on international fragmentation and just-in-time logistics. This raises questions about a possible reconfiguration of supply chains, and the use of suppliers at less distant locations in order to shift the balance between the security of supply and efficiency considerations. Global value chains can be an effective means of expanding supply quickly when needed, as seen during the pandemic with the production of vaccines and personal protection equipment. At the same time, global production sometimes relies on critical raw materials or components sourced from just a few countries – an arrangement that can quickly become a vulnerability if geopolitical tensions rise and key suppliers are based in countries that have very different geopolitical priorities.
Improving security by adjusting the configuration of GVCs could reverse some of the efficiency gains from globalisation. Specialisation and economies of scale have brought productivity gains as well as lower production prices (Andrews et al, 2018; Pain et al., 2008). Such gains could dissipate if production is moved to more secure but costlier locations. Model simulations (Arriola et al., 2020; IMF, 2022b) show that less diversified supply chains and greater economic fragmentation would harm efficiency and economic stability when shocks are primarily domestic rather than global.
Governments still need to ensure that trade operates as efficiently as possible within supply chains, wherever they are located. Investment policies to modernise digital and physical infrastructures would improve trade logistics and reduce bottlenecks along production chains. Enhanced regulatory flexibility can facilitate innovation and supply diversification, and support resilience. More broadly, reducing unnecessary heterogeneity of technical standards that underlie regulations and non-tariff measures can facilitate easier substitution between alternative suppliers and help in cushioning shocks (Arriola et al., 2020).
Financial sanctions could lead to the development of alternative payment systems
The US dollar remains the dominant currency used in international trade, financial markets and in official foreign exchange reserve holdings (OECD, 2018; Bertaut et al., 2021). However, the financial sanctions now placed on Russia by the major advanced economies, which come on top of earlier sanctions imposed on Iran and Russia in 2014, raise the risk of greater fragmentation over time in cross-border payments and payment systems. In the short term, the exclusion of many Russian banks from the SWIFT payment messaging system will make financial transactions slower and more expensive for Russian institutions, and ultimately for their customers (firms and households). Although banks affected by sanctions can still request other banks to settle in US dollars on their behalf, doing so would significantly reduce the efficiency of cross-border payments (Berner et al., 2022). Banks may also be reluctant to undertake such transactions if there are risks of US secondary sanctions on banks in third countries undertaking dollar transactions.
In this context, an acceleration of the existing separate efforts by Russia and China to develop alternative payment systems is to be expected, especially for renminbi-denominated transactions.28 To date, these systems do not have the same global reach as SWIFT. Nonetheless, their development could diminish the efficiency gains from having a single global system, and potentially reduce the dominant role of the US dollar in financial markets and cross-border payments (Arslanalp et al., 2022). However, important technical and political constraints remain. Although China’s Cross-border Interbank Payment System (CIPS) can settle and clear cross-border payments, unlike SWIFT, it does so only for renminbi-denominated transactions.29At present the renminbi accounts for only a small share of global transactions, and less than 4% of official foreign exchange holdings, although its use is growing due to China’s greater size and rising importance in global trade. However, the current scope and size of CIPS is not sufficient to replace Russia's lost access to the international financial system and incentives to hold renminbi in official reserves are limited by the lack of full convertibility.
Bibliography
Acemoglu, D., U. Akcigit and W. Kerr (2015), “Networks and the Macroeconomy: An Empirical Exploration”, NBER Macroeconomics Annual, Vol. 30
Amiti, M., and D. Weinstein (2011), “Exports and Financial Shocks”, The Quarterly Journal of Economics, Vol. 126, issue 4, 1841-1877
Andrews, D., P. Gal and W. Witheridge (2018), “A Genie in the Bottle? Globalisation, Competition and Inflation”, OECD Economics Department, Working Paper No. 1462, OECD Publishing, Paris.
Arriola, C., S. Guilloux-Nefussi, S. Koh, P. Kowalski, E. Rusticelli and F. Van Tongeren (2020), "Efficiency and Risks in Global Value Chains in the context of COVID-19", OECD Economics Department Working Papers, No. 1637, OECD Publishing, Paris.
Arslanalp, S., B.J. Eichengreen, and C. Simpson-Bell (2022), “The Stealth Erosion of Dollar Dominance: Active Diversifiers and the Rise of Nontraditional Reserve Currencies”, IMF Working Paper, 22/58.
Bachmann, R., D. Baqaee, C. Bayer, M. Kuhn, A. Löschel, B. Moll, A. Peichl, K. Pittel and M. Schularick (2022), "What If? The Economic Effects for Germany of a Stop of Energy Imports from Russia", EconPol Policy Reports 36, ifo Institute - Leibniz Institute for Economic Research at the University of Munich.
Baqaee, D, C. Landais, P. Martin and B. Moll (2022), “The Economic Consequences of a Stop of Energy Imports from Russia”, French Council of Economic Advisors.
Berner, R., S. Cecchetti, and K. Schoenholtz (2022), “Russian Sanctions: Some Questions and Answers”, VoxEU.org, 21 March.
Bertaut, C., B. von Beschwitz and S. Curcuru (2021), “The International Role of the US Dollar”, FEDS Notes, Board of Governors of the Federal Reserve, Washington.
Blinder, A. and J. Rudd (2008), “The Supply-Shock Explanation of the Great Stagflation Revisited”, NBER Working Paper, No. 14563.
Boone, L. (2022), “The EA and the US in the COVID-19 Crisis: Implications for the 2022-23 Policy Stance”, OECD Ecoscope blog, January.
Bouwmeester, M.C. and J. Oosterhaven (2017), "Economic Impacts of Natural Gas Flow Disruptions between Russia and the EU", Energy Policy, Vol. 106.
Brainard, L. (2022), “Variation in the Inflation Experiences of Households”, speech at Spring 2022 Research Conference, Opportunity and Inclusive Growth Institute, Federal Reserve Bank of Minneapolis.
Carvalho, V., M. Nirei, Y. Saito and A. Tahbaz-Salehi (2021), “Supply Chain Disruptions: Evidence from the Great East Japan Earthquake”, Quarterly Journal of Economics, Vol. 136.
Causa, O., M. Abendschein, N. Luu, E. Soldani and C. Soriolo (2022), “The Post-COVID-19 Labour Shortages Across OECD Countries: A Short Overview”, OECD Economics Department Working Paper, forthcoming.
Crozet, M. and J. Hinz (2016), “Collateral Damage: The Impact of the Russia Sanctions on Sanctioning Countries’ Exports”, CEPII Working Paper 2016-16.
D’Acunto, F., U. Malmendier, J. Ospina, and M. Weber (2021), “Exposure to Grocery Prices and Inflation Expectations,” Journal of Political Economy, Vol. 129.
D’Arcangelo, F., I. Levin, A. Pagani, M. Pisa and A. Johansson (2022), “A Framework to Decarbonise The Economy”, OECD Economic Policy Paper No. 31, OECD Publishing, Paris.
Deutsche Bundesbank (2022), “Potential Macroeconomic Consequences of the War in Ukraine – Simulations Based on a Severe Risk Scenario”, Deutsche Bundesbank Monthly Report, April 2022.
Domash, A. and L. Summers (2022), “A Labour Market View on the Risk of a US Hard Landing”, NBER Working Paper, No. 29910.
ECB (2022), “Main Findings from the ECB’s Recent Contacts with Non-Financial Companies”, ECB Bulletin, No. 2022/3.
ESRB (2022), Vulnerabilities in the residential real estate sectors of the EEA countries, European Systemic Risk Board, February.
Estevão, M. (2022), “Are We Ready for the Coming Spate of Debt Crises?”, World Bank Blogs, 28 March 2022.
Eurofound (2022), Minimum Wages in 2022: Bigger Hikes This Time Around, Eurofound report.
FAO (2021), State of Food Security and Nutrition in the World, UN Food and Agricultural Organisation.
G7 (2022), G7 Climate, Energy and Environment Ministers’ Communiqué, Berlin, 27 May 2022.
Georganas, S., P. Healy and L. Nan (2014), “Frequency Bias in Consumers׳ Perceptions of Inflation: An Experimental Study”, European Economic Review, Vol. 67.
Gross, M., T. Tressel, X. Ding and E. Tereanu (2022), “What Drives Mortgage Default Probabilities In Europe and the United States?”, IMF Working Paper No. 2022/065.
Grzegorczyk, M., J. Scott Marcu, N. Poitiers, and P. Weil (2022), “The Decoupling of Russia: European Vulnerabilities in the High-Tech Sector”, Bruegel blog, 12 April.
Ha, J., M. Ayhan Kose, H. Matsuoka, U. Panizza and D. Vorisek (2022), “Anchoring Inflation Expectations in Emerging and Developing Economies”, VoxEU.org, 8 February.
Hermansen, M. and O. Röhn (2016), “Economic Resilience: The Usefulness of Early Warning Indicators in OECD Countries”, OECD Journal: Economic Studies, Vol. 2016/1, OECD Publishing, Paris.
Holtemöller, O.,A. Lindner andC. Schult (2022), “Regionale Effekte einer durch einen Lieferstopp für russisches Gas ausgelösten Rezession in Deutschland”, IWH Policy Notes, No. 1.
IEA (2021a), Security of Clean Energy Transitions, OECD Publishing, Paris.
IEA (2021b), Net Zero by 2050: A Roadmap for the Global Energy Sector, OECD Publishing, Paris.
Igan, D., E. Kohlscheen, G. Nodari and D. Rees (2022), “Commodity Market Disruptions, Growth and Inflation”, BIS Bulletin No. 54, Bank of International Settlements.
IMF (2022a), Global Financial Stability Report, April 2022.
IMF(2022b), “Global Trade and Value Chains during the Pandemic”, World Economic Outlook, April 2022.
Jordá, O, C. Liu, F. Nachio and F. Rivera-Reyes (2022), “Why Is US Inflation Higher Than in Other Countries? “, Economic Letter 2022-07, Federal Reserve Bank of San Francisco.
Karjalainen, H. and P. Lovell (2022), “Inflation Hits 9% with Poorest Households Facing Even Higher Rates”, Institute for Fiscal Studies, May 2022.
Klick, J. and A. Stockburger (2021), “Experimental CPI for Lower and Higher Income Households”, Bureau of Labor Statistics Working Paper, No. 537.
Kozicki, S. (2022), “A World of Difference: Households, the Pandemic and Monetary policy”, speech at Federal Reserve Bank of San Francisco Macroeconomics and Monetary Policy Conference, March 2022
Labandeira, X., J. Labeage and X. López-Otero (2017), “A Meta-Analysis on the Price Elasticity of Energy Demand”, Energy Policy, Vol. 102.
McWilliams, B., G. Sgaravatti, G. Zachmann (2021), European natural gas imports, Bruegel Datasets, first published 29 October, 2021, available at https://www.bruegel.org/publications/datasets/european-natural-gas-imports/
Meltzer, A. (2005), “Origins of the Great Inflation”, Federal Reserve Bank of St Louis Review, March-April 2005.
Motto, R and Ozen, K (2022), “Market Stabilization QE”. ECB Working Paper, No. 2640
OECD (2013), OECD Economic Surveys, Japan 2013, OECD Publishing, Paris.
OECD (2018), “Policy Challenges from Closer International Trade and Financial Integration: Dealing with Economic Shocks and Spillovers”, in OECD Economic Outlook May 2018, OECD Publishing, Paris.
OECD (2021a), OECD Economic Outlook December 2021, OECD Publishing, Paris.
OECD (2021b), Brick by Brick: Building Better Housing Policies, OECD Publishing, Paris.
OECD (2022a), Economic and Social Impacts and Policy Implications of the War in Ukraine, OECD Publishing, Paris.
OECD (2022b), OECD Sovereign Borrowing Outlook, OECD Publishing, Paris.
OECD (2022c), As Energy Price Hikes Persist, Better Targeting of Support Becomes Imperative, OECD Publishing, Paris, forthcoming.
OECD (2022d), Assessing Environmental Impact of Measures in the OECD Green Recovery Database, 21 April 2022.
Ollivaud, P. (2022), “The Pass-through from Producer to Consumer Prices”, OECD Economics Department Working Papers, forthcoming.
Pain, N., I. Koske and M. Sollie (2008), "Globalisation and OECD Consumer Price Inflation", OECD Journal: Economic Studies, Vol. 2008/1, OECD, Publishing, Paris.
Pill, H. (2022), “The Economic Situation and Monetary Policy”, speech at ACCA Cymru Wales, May 2022.
Powell, J. (2018), “Monetary Policy in a Changing Economy”, speech at Federal Reserve Bank of Kansas City symposium, Jackson Hole, Wyoming.
Rawdanowicz, L., S. Turban, J. Haas, D. Crowe and V. Millot (2021), “Constraints and Demands on Public Finances: Considerations of Resilient Fiscal Policy”, OECD Economics Department Working Papers, No. 1694, OECD Publishing, Paris.
Reserve Bank of Australia (2022), Financial Stability Review, April.
Rühl, C. and T. Erker (2021), Oil Intensity: The Curiously Steady Decline of Oil in GDP, Center on Global Energy Policy, Columbia University.
S&P Global (2022a), US Companies Further Trim Pandemic-era Cash Buffers, April 1 note.
S&P Global (2022b), Default, Transition, and Recovery: The U.S. Speculative-Grade Corporate Default Rate Could Reach 3% By Year- End As Risks Continue To Increase, February, 22nd.
S&P Global (2022c): “Russia's pivot to China for payment alternatives offers limited gains”, March 2022.
van Hoenselaar, F., B. Cournède, F. De Pace and V. Ziemann (2021), “Mortgage Finance Across OECD Countries”, OECD Economics Department Working Papers, No. 1693, OECD Publishing, Paris.
WHO-World Bank (2022), Accelerating Covid-19 Vaccine Deployment, report to G20, April 2022.
Fiscal policy settings for 2022-23 are based as closely as possible on legislated tax and spending provisions and are consistent with the growth, inflation and wage projections. Where government plans have been announced but not legislated, they are incorporated if it is deemed clear that they will be implemented in a shape close to that announced.
Projections for the EU countries account for spending financed by the Next Generation EU (NGEU) grants and loans, based on expert judgments about the distribution across years and different expenditure categories and informed by officially announced plans where available. NGEU grants are assumed to be budget neutral, i.e. they increase both capital tax and transfers receipts and government expenditure. In addition, positive net one-offs are added in order to reflect the discretionary stimulus associated with those grants, as measured by changes in underlying primary balances.
Regarding monetary policy, the assumed path of policy interest rates and unconventional measures represents the most likely outcome, conditional upon the OECD projections of activity and inflation. This may differ from the stated path of the monetary authorities.
The projections assume that the impacts of the war in Ukraine persist for one year, but do not spread or escalate, and that all war-related sanctions remain in place throughout the projection period. The projections also incorporate the impacts of the EU embargo of coal imports from Russia, beginning later in 2022, and the EU embargo on seaborne oil imports from Russia, assumed to take effect at the start of 2023.
The projections assume unchanged exchange rates from those prevailing on 10 May 2022: one US dollar equals JPY 130.3, EUR 0.95 (or equivalently one euro equals USD 1.05) and 6.74 renminbi.
The price of a barrel of Brent crude oil is assumed to average USD 107 in 2022 and USD 122 in 2023, with a peak of USD 131 in the first quarter of 2023. Metals prices are held flat at their estimated level in April 2022 until the end of the year. In 2023, prices are assumed to decline by 1% per month. Food, tropical beverages and agricultural commodity prices are assumed to be constant over the projection period at their average levels from April 2022.
The cut-off date for information used in the projections is 1 June 2022.
OECD quarterly projections are on a seasonal and working-day-adjusted basis for selected key variables. This implies that differences between adjusted and unadjusted annual data may occur, though these in general are quite small. In some countries, official forecasts of annual figures do not include working-day adjustments. Even when official forecasts do adjust for working days, the size of the adjustment may differ from that used by the OECD.
Notes
← 1. Prior to the war, Russia and Ukraine collectively accounted for only about 2% of global GDP at market prices (3½ per cent of global GDP in PPP terms) and a similar proportion of total global trade.
← 2. Financial linkages between Russia and other countries are generally modest. Stocks of foreign direct investment in Russia account for just 1-1½ per cent of the global total, while consolidated cross-border bank claims by BIS reporting banks on residents of Russia and Ukraine represented less than 0.5% of the global total as of the third quarter of 2021.
← 3. Compositional effects have affected the growth of real wages in 2020 and 2021 in some countries, with many low-wage earners in contact-intensive service sectors dropping out of employment in 2020 and re-entering the labour force as the pandemic moderated. But even on a quarterly basis, real hourly wage growth was negative in the latter half of 2021.
← 4. There is some evidence in the United States that inflation for households in the lowest income quintile has moderately outpaced that for the highest-income quintile over the period from 2003-19 (Klick and Stockburger, 2021). In the United Kingdom, annual consumer price inflation for the lowest income decile is estimated to be have been 3 percentage points higher than for the top income decile in April 2022 (Karjalainen and Levell, 2022).
← 5. Within each expenditure category for which prices are collected by statistical offices there could also be unmeasured differences between the type or quality of goods and services purchased by higher and lower-income households, contributing to the perceived differences in inflation by different households.
← 6. Foreign-currency bond spreads for the major emerging-market economies have risen since January, albeit to a different extent, with a sizeable surge in Eastern European countries, signalling significant rises in risk premia.
← 7. Food price inflation was strong in most economies even before the Ukraine war, reflecting both poor crop outcomes and more expensive energy. The war has added to these effects, with the FAO Food Price Index in March to May 2022 at the highest level since its inception in 1990 and 29% higher than a year earlier.
← 8. Natural gas prices (and therefore electricity prices) have risen by much more in Europe than in North America since mid-2020. In contrast, the rise in petrol prices has been stronger in the United States than in Europe, as taxes account for a larger share of petrol prices in Europe and cushion the impact of oil price fluctuations.
← 9. In 2020, petroleum products, gas and coal accounted for approximately 35%, 24% and 12% of total EU energy use respectively.
← 10. In 2019, Russia supplied around 40% of the oil and gas collectively used by EU producers and households, and around 30% of coal and peat products. The use of crude oil and other hydrocarbons was predominantly concentrated in the transport sector (accounting for 60% of oil consumption) and in industries such as the production of rubber and plastic products. In contrast, the consumption of natural gas was used more broadly by households for domestic lighting, heating and cooking (26% of gas consumption), manufacturing industry (20%) and energy-related sectors (36%). Around four-fifths of coal and peat in Europe was used as inputs in the energy industry, with the rest destined mainly for the production of chemicals and metals.
← 11. Information is also available for 2020, but the structure of activities that year was heavily affected by the pandemic and related containment measures.
← 12. Following Acemoglu et al. (2015), the overall impact of a supply shock originating in sector i on industry j’s output is the sum of the direct effect and indirect downstream propagation from i to j. It is measured by sector j’s total requirement from i, which is reported in the inverse Leontief matrix.
← 13. One example of the need for a substantial adjustment in energy supplies, albeit in very different circumstances, is the aftermath of the nuclear meltdown at the Fukushima plant in Japan in 2011 triggered by the Great East Japan earthquake and tsunami. Operations at all of Japan’s remaining 50 nuclear power plants were then suspended, removing almost one-third of electricity supply (OECD, 2013). Reductions in electricity consumption by businesses and households were requested by the government in the summer of 2011 and again in 2012 to avoid shortages. Many manufacturers reduced energy consumption during peak periods by shifting production to weekends and off-peak hours, raising costs but avoiding the need for blackouts. Imports of fossil fuels rose significantly to help overcome the domestic supply shortfall. Collectively, these adjustments helped to prevent a large contraction in output from energy shortages beyond the immediate adverse impact in the first half of 2011 (Carvalho et al., 2021).
← 14. The simulation assumes that 75% of Russian gas exports to Europe cannot be diverted to other markets due to logistical difficulties and a lack of ready infrastructure such as pipelines. This is broadly equivalent to a decline of 5% in total Russian exports of goods and services. In turn this generates an ex-ante gap between effective world supply and consumption of between 4½-5 per cent in global gas markets. The assumed gas price adjustment reflects a short-term price elasticity of demand of -0.1, at the low end of the estimates reported by Labandeira et al. (2017). The implied increase in gas spot prices would still leave them at a level below the daily market peak observed since the invasion of Ukraine.
← 15. The simulation begins in the first quarter of 2023 and is run with households, companies and financial markets having forward-looking behaviour, so consumers and companies make their current spending choices with an expectation that the shocks will fade eventually.
← 16. For instance, the median cash ratio of all publicly listed US companies, measured as the amount of cash and equivalent as a percentage of total current liabilities, is still 7 percentage points higher (as of April 2022) than it was at the end of 2019 (S&P Global, 2022a).
← 17. Based on data based for all corporate bonds, loans, and revolving credit facilities in the United States and Europe that are rated by S&P Global Ratings as of the first quarter of 2022, with a value of around USD 9 trillion.
← 18. These sectors currently contain most of the firms at risk of default in the United States.
← 19. The share of firms currently reporting an ICR below one in a sample of mostly large public and private firms monitored by S&P Capital IQ in advanced and emerging-market economies is still relatively low and stable (6%).
← 20. In the euro area, bank credit standards were already tightened in the first quarter of 2022 as a result of the war in Ukraine and the related uncertainty, even for small and medium-sized enterprises with no direct corporate or logistical exposure to Russia or Ukraine.
← 21. If inflationary pressures persist, this mechanical effect on the debt-to-GDP ratio could rapidly reverse due to the increased cost of issuing new debt that incorporates higher expected inflation rates.
← 22. Emerging Asia and China continued to account for more than half of the total issuance, and the share of Latin America issuance picked up, reflecting increasing borrowing needs.
← 23. For Treasury securities, monthly caps for balance sheet reduction are set at USD30 billion for the first three months of quantitative tightening and then at USD60 billion. For agency debt and mortgage-backed securities, the corresponding caps are set at USD17.5 billion and USD35 billion.
← 24. Asset purchases have also been shown to affect perceived credit risk in the euro area (Motto and Ozen, 2022). In this context, QT announcements could be interpreted by market participants as signalling a withdrawal of insurance against fragmentation risk, inducing wider spreads across countries in the euro area.
← 25. Encouragingly, spending on environmentally positive measures rose to around 33% of total COVID-19 recovery spending by end-2021 (from 21% by mid-July) in OECD member countries, the European Union and selected large economies, though the share of spending with mixed or negative environmental impacts also increased somewhat (OECD, 2022d).
← 26. The exchange-rate guarantee scheme, created in December 2021 to protect local-currency deposits from possible currency depreciation, may also give rise to large fiscal liabilities.
← 27. In Europe it may also be necessary in the short run to use more nuclear and carbon-intensive energy sources than planned to offset the reliance on supplies from Russia.
← 28. The financial committee in Russia's lower house of parliament already announced in March 2022 that the central banks of the two nations, Russia and China, were "establishing cooperation" between their respective financial messaging systems, the Russian System for Transfer of Financial Messages (SPFS) and the Chinese Cross-Border Interbank Payment System (CIPS).
← 29. The use of the renminbi in global payment systems is currently limited. As of January 2022, the renminbi represented only 3.2% of global payments reported in SWIFT and less than 2% in global trade finance (S&P Global, 2022c).