copy the linklink copied!Chapter 6. Teachers’ support and teaching practices
This chapter examines differences between countries and economies in teachers’ support and feedback, and how support from teachers is associated with school characteristics and students’ reading performance. It also explores how teaching practices in language-of-instruction lessons are inter-related, and how these teaching practices are related to students’ enjoyment of reading.
Interactions between students and their teachers play a crucial role in students’ learning and their feelings towards school. Students need to feel that their teachers care about them and their achievement to fully engage in learning activities and perform at their best (Federici and Skaalvik, 2014[1]). Teachers support students by encouraging them and taking the time to help them, but also by setting goals and rules, treating them fairly and giving them the opportunity to make their own choices (Klem and Connell, 2004[2]; Wang and Holcombe, 2010[3]).
Students who feel supported by their teachers feel more motivated about school and perform at higher levels (Pitzer and Skinner, 2017[4]; Ricard and Pelletier, 2016[5]). Several studies find that teachers’ emotional support is associated with better behavioural outcomes in students, such as engagement in learning, academic enjoyment and self-efficacy, all of which lead to greater effort and perseverance (Federici and Skaalvik, 2014[1]; Lee, 2012[6]; Ruzek et al., 2016[7]; Sakiz, Pape and Hoy, 2012[8]). Support from teachers is also related to higher levels of intrinsic motivation and lower levels of anxiety (Pitzer and Skinner, 2017[4]; Ricard and Pelletier, 2016[5]; Sakiz, Pape and Hoy, 2012[8]; Yu and Singh, 2018[9]). Federici and Skaalvik (2014[1]) find that support in the form of tangible and practical help is most strongly and directly related to these outcomes.
Through these positive effects on students’ attitudes, support from teachers is also indirectly linked to academic achievement. Students who benefit from a supportive environment are more engaged in school activities, which, in turn, allows them to perform at higher levels (Hughes et al., 2008[10]; Klem and Connell, 2004[2]; Reyes et al., 2012[11]). Similarly, Lee (2012[6]) and Wang and Holcombe (2010[3]) find that supportive teacher-student relations positively affect student achievement, both directly and indirectly through a greater sense of belonging at school.
-
On average across OECD countries, about three in four students reported that, in most or every language-of-instruction lesson, the teacher gives extra help when students need it.
-
Students in socio-economically disadvantaged schools reported greater teacher support than students in advantaged schools, on average across OECD countries and in 35 partner countries and economies.
-
On average across OECD countries and in 43 education systems, students who perceived greater support from teachers scored higher in reading, after accounting for the socio-economic profile of students and schools.
-
Teacher enthusiasm and teachers’ stimulation of reading engagement are the teaching practices most strongly (and positively) associated with students’ enjoyment of reading, after accounting for socio-economic status, reading performance and other teaching practices.
Support from teachers is also associated with better well-being outcomes for students, both in and outside of school. Suldo et al. (2009[12]) find that social support from teachers is associated with greater student well-being, accounting for 16 % of the variation in their subjective well-being. They also show, along with Guess and McCane-Bowling (2016[13]), that more supportive teachers make for happier students, who report greater satisfaction with their lives. In addition to providing guidance and encouragement to students in performing a task, teachers can help improve student outcomes by giving them feedback on how well they did on that task (Hattie and Timperley, 2007[14]; Lipko-Speed, Dunlosky and Rawson, 2014[15]; Tunstall and Gsipps, 1996[16]).
This chapter focuses on teachers’ support and feedback. In 2018, PISA asked students how often ( “never or hardly ever”, “some lessons”, “most lessons”, “every lesson”) the following things happen in their language-of-instruction lessons: “The teacher shows an interest in every student’s learning”; “The teacher gives extra help when students need it”; “The teacher helps students with their learning”; and “The teacher continues teaching until students understand”. Students’ responses were combined to create the index of teacher support whose average is 0 and standard deviation is 1 across OECD countries. Higher values in the index mean that students perceive their language-of-instruction teacher to provide support more frequently.
In addition, students were asked whether they agree ( “strongly disagree”, “disagree”, “agree”, “strongly agree”) with the following statements regarding their past two language-of-instruction lessons: “The teacher made me feel confident in my ability to do well in the course”; “The teacher listened to my view on how to do things”; and “I felt that the teacher understood me”.
Students were also asked how often ( “never or almost never”, “some lessons”, “many lessons”, “every lesson or almost every lesson”) the following things happen in their language-of-instruction lessons: “The teacher gives me feedback on my strengths in this subject”; “The teacher tells me in which areas I can still improve”; and “The teacher tells me how I can improve my performance”. Students’ answers were combined to create the index of teacher feedback whose average is 0 and standard deviation is 1 across OECD countries. Higher values in the index mean that students perceive their language-of-instruction teacher to provide feedback more frequently.
copy the linklink copied!How teacher support varies between countries, schools and students
On average across OECD countries in 2018, the majority of students reported that the teacher supports students in most or all of their language-of-instruction lessons (Figure III.6.1). About three in four students reported that, in most or every lesson, the teacher gives extra help when students need it and that the teacher helps students with their learning; around 70 % of students reported that, with similar frequency, the teacher shows an interest in every student’s learning and that the teacher continues teaching until students understand. In Albania, 93 % of students reported that the teacher helps students with their learning, and 92 % of students reported that the teacher continues teaching until students understand.
Only in a few countries did less than 60 % of students report frequent teacher support in their language-of-instruction lessons. For instance, in Slovenia, only 44 % of students reported that the teacher helps students with their learning in most or every lesson; 52 % reported that the teacher continues teaching until students understand; and 53 % reported that the teacher shows an interest in every student’s learning. In Ukraine, 78 % of students reported that the teacher helps students with their learning in most or every lesson, but only 43 % of students reported that the teacher shows an interest in every student’s learning.
Students also reported that they receive a great deal of emotional support from their language-of-instruction teachers (Table III.B1.6.2). Across OECD countries, 71 % of students agreed or strongly agreed that the teacher made them feel confident in their ability to do well in the course, and 70 % agreed or strongly agreed that they felt the teacher understood them. Some 67 % of students agreed or strongly agreed that the teacher listened to their view on how to do things. In Japan, fewer than one in two students agreed with this statement, and just over one in two students agreed that the teacher made them feel confident or that they felt the teacher understood them.
By contrast, only between 10 % and 15 % of students reported that they receive feedback, in any of the three forms they were asked about, in every or almost every lesson (Table III.B1.6.3). In 35 countries and economies, less than 10 % of students reported getting feedback on their strengths in every or almost every lesson. More important, many students reported never, or almost never, receiving any feedback. For instance, more than half of students in Japan stated that their language-of-instruction teacher never, or almost never, gives them feedback on their strengths; at least 30 % of students in Argentina, Costa Rica, Japan, Saudi Arabia and Slovenia said that their teacher never, or almost never, tells them in which areas they can still improve; and at least one in four students in Belgium, Costa Rica, Iceland, Israel, Slovenia and Spain reported that their teacher never, or almost never, tells them how they can improve their performance.
There are wide variations across schools in the extent to which teachers provide support (Figure III.6.2 and Table III.B1.6.6). PISA 2018 results show that, on average across OECD countries, about 6 % of the variation in the index of teacher support lies between schools, a proportion somewhat higher than that in other indices examined in this report. In 35 countries and economies, and on average across OECD countries, students in socio-economically disadvantaged schools were more likely than students in advantaged schools to report that they have supportive teachers (Figure III.6.2). This is especially true in Austria, where the difference is about half a standard deviation in favour of students in disadvantaged schools (Table III.B1.6.6). Only in Australia, Beijing, Shanghai, Jiangsu and Zhejiang (China) (hereafter “B-S-J-Z [China]”), Brunei Darussalam, Finland and Iceland were students in advantaged schools more likely than those in disadvantaged schools to report that they have supportive teachers. In around half of the countries and economies with available data, students in rural schools were more likely than students in urban schools to report that their teachers are supportive; in the other half, there was no difference in the index related to school location. In 20 school systems, and on average across OECD countries, students in private schools were more likely than their counterparts in public schools to report frequent teacher support. The largest differences in favour of private schools were observed in Switzerland and the United States. In comparison, in Germany, Malaysia, Panama, Qatar, Chinese Taipei and the United Arab Emirates, students in public schools were more likely than students in private schools to report frequent teacher support.
Some groups of students received greater support from teachers than others. Disadvantaged students reported greater teacher support than advantaged students, on average across OECD countries and in 26 partner countries and economies, including Austria, Germany and Montenegro, where the difference was at least a quarter of a standard deviation (Table III.B1.6.5). However, in Australia, B-S-J-Z (China), Brunei Darussalam, Denmark, Finland, Kazakhstan, Korea, New Zealand, Sweden and the United States, advantaged students reported greater academic support from their teachers than disadvantaged students did. Given that disadvantaged students are generally in greater need of academic and emotional support, it is encouraging to observe that in only a few school systems are they receiving less support than their advantaged peers. Moreover, on average across OECD countries, boys reported receiving somewhat more frequent teacher support than girls did.

Countries and economies are ranked in descending order of the percentage of students who reported teacher support in most or every lesson (average of four items).
Source: OECD, PISA 2018 Database, Table III.B1.6.1.
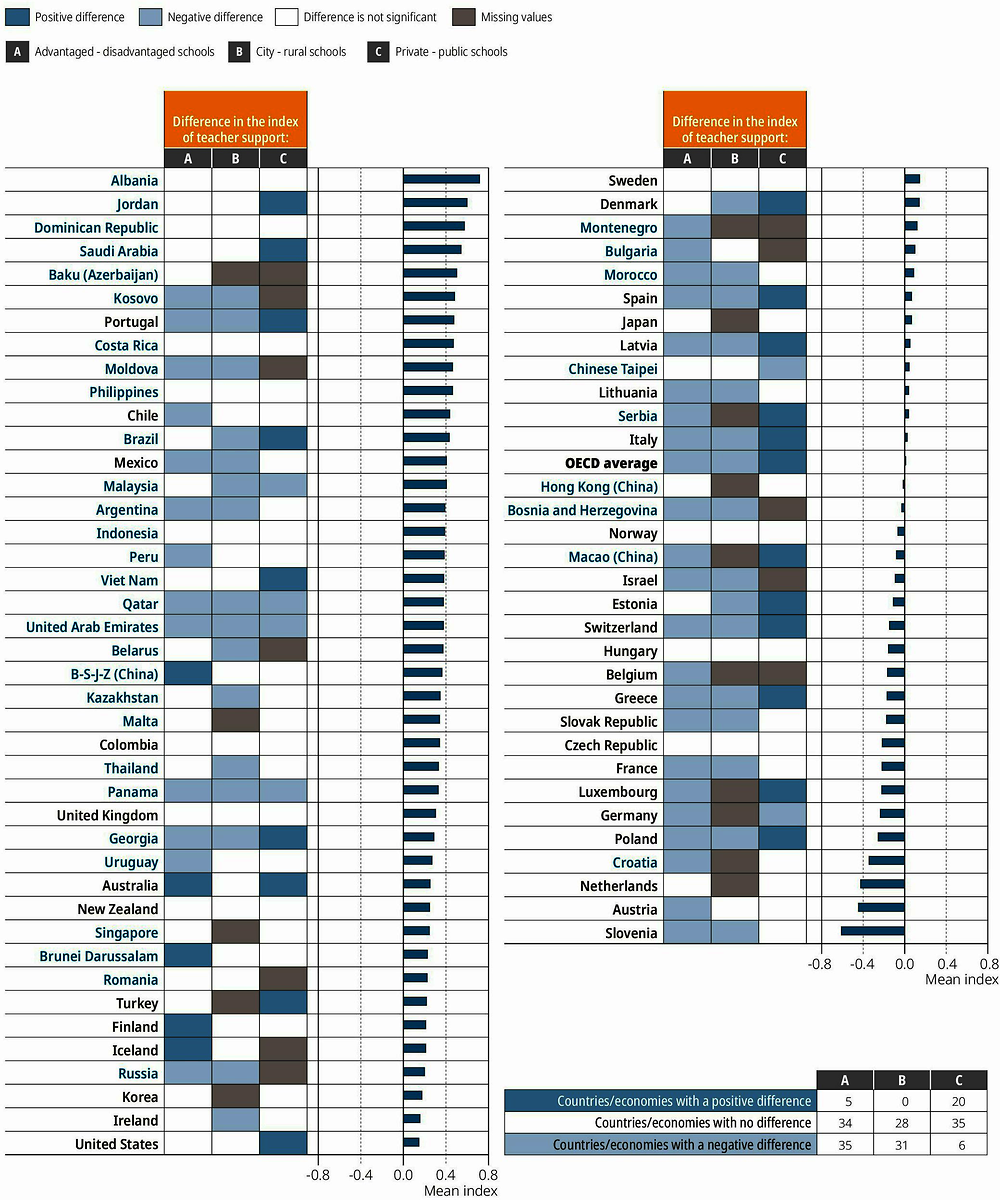
Countries and economies are ranked in descending order of the index of teacher support.
Source: OECD, PISA 2018 Database, Tables III.B1.6.1 and III.B1.6.6.
copy the linklink copied!How teacher support is related to reading performance
On average across OECD countries and in 43 education systems, students who perceived greater support from language-of-instruction teachers scored higher in reading, after accounting for the socio-economic profile of students and schools (measured by the PISA index of economic, social and cultural status) (Figure III.6.3). A one-unit increase in the index of teacher support was associated with an increase of 5 score points in reading performance across OECD countries and, in Malaysia, with an increase of 18 score points. Moreover, since in many countries and economies socio-economically disadvantaged students were more likely to receive teacher support, and also tended to score lower in the reading assessment, in all 15 countries and economies where the relationship between teacher support and reading performance was negative, it became non-significant or positive once students’ and schools’ socio-economic profile was accounted for.

1. The socio-economic profile is measured by the PISA index of economic, social and cultural status (ESCS).
Note: Statistically significant values are shown in darker tones (see Annex A3).
Countries and economies are ranked in descending order of the score-point difference associated with a one-unit increase in the index of teacher support, after accounting for students’ and schools’ socio-economic profile.
Source: OECD, PISA 2018 Database, Table III.B1.6.7.
In the vast majority of countries and economies, students who reported that their teacher is supportive in most or all of their language-of-instruction lessons scored significantly higher on the PISA reading assessment (Table III.B1.6.7). However, in some countries, the relationship varied considerably, depending on what, specifically, the teacher does. For instance, in Indonesia, New Zealand and Singapore, students scored the same whether or not they reported that their teacher frequently continues teaching until students understand, while they scored at least 13 points higher when they reported that, in most or all lessons, the language-of-instruction teacher gives extra help when students need it. In Israel, teachers’ practices of helping students with their learning and of continuing teaching until students understand were associated with an improvement in reading performance of 11 and 19 points, respectively; but students did not score any higher when they reported that their teacher shows an interest in every student’s learning or gives extra help.
The results look somewhat different when considering the association at the school level. On average across OECD countries, students scored slightly lower in reading when their peers reported greater teacher support (Table III.B1.6.8). For instance, students enrolled in schools where students most frequently reported that teachers showed an interest in every student’s learning (schools in the top quarter of that indicator in the country/economy) scored 479 points in the reading assessment, on average, whereas those attending schools where students least frequently reported that teachers showed an interest in every student’s learning (schools in the bottom quarter of that indicator in the country/economy) scored 491 points.
copy the linklink copied!How is teacher support related to other teaching practices?
Even if there is no single “best” way of teaching, teachers need to decide which instructional practices they use in their lessons and how much time they allocate to each of them (OECD, 2016[17]). Teachers need to consider, for example, how much time they will devote to setting goals, explanations and questions; how much time they will spend supporting struggling students and providing feedback; how much emphasis will be given to stimulating students; and how flexible their lessons will be. Moreover, teachers need to decide how much and when to combine different teaching approaches: all teaching strategies can be combined over the course of a semester; some may even be combined during a single lesson. This section looks at how the different teaching practices cited in the student questionnaire (teacher support, teacher feedback, teacher-directed instruction, teachers’ stimulation of reading engagement, adaptive instruction and teacher enthusiasm) are related to each other. Are there certain teaching strategies that are more likely to be used with teacher support and feedback?
PISA asked students several questions about the teaching practices used in their language-of-instruction lessons. The indices of teacher support and feedback were presented above, and the index of teacher enthusiasm was described in Chapter 5. Three other indices are analysed in this section. For each index, the average is 0 and standard deviation is 1 across OECD countries. Positive values in the index indicate that the teaching practices are used more frequently.
-
The index of teacher-directed instruction was constructed using students’ descriptions of how often ( “never or hardly ever”, “some lessons”, “most lessons”, “every lesson”) the following things happen in their language-of-instruction lessons: “The teacher sets clear goals for our learning”; “The teacher asks questions to check whether we have understood what was taught”; “At the beginning of a lesson, the teacher presents a short summary of the previous lesson”; and “The teacher tells us what we have to learn”.
-
The index of teachers’ stimulation of reading engagement was constructed using students’ descriptions of how often ( “never or hardly ever”, “in some lessons”, “in most lessons”, “In all lessons”) the following things happen in their language-of-instruction lessons: “The teacher encourages students to express their opinion about a text”; “The teacher helps students relate the stories they read to their lives”; “The teacher shows students how the information in texts builds on what they already know”; “The teacher poses questions that motivate students to participate actively”.
-
The index of adaptive instruction was constructed using students’ descriptions of how often ( “never or almost never”, “some lessons”, “many lessons”, “every lesson or almost every lesson”) the following things happen in their language-of-instruction lessons: “The teacher adapts the lesson to [my] class’s needs and knowledge”; “The teacher provides individual help when a student has difficulties understanding a topic or task”; and “The teacher changes the structure of the lesson on a topic that most students find difficult to understand”.
While all indices of teaching practices were positively associated (probably because of students’ response styles), some teaching approaches are more strongly correlated than others (Figure III.6.4). On average across OECD countries, the teaching strategies indices that were most strongly associated were teacher support and teacher-directed instruction, and teacher enthusiasm and teachers’ stimulation of reading engagement. By contrast, the least frequently combined teaching strategies, according to students’ reports, were teacher-directed instruction and teacher enthusiasm, teacher-directed instruction and teacher feedback, and teacher support and teacher feedback.
There were wide variations across countries and economies in these relationships. For instance, teacher-directed instruction and teacher support are most strongly associated in Hong Kong (China) and Korea, and least so in Kosovo and the Republic of Moldova (hereafter “Moldova”) (Table III.B1.6.9). Teacher support was most strongly associated with teachers’ stimulation of reading engagement in Australia, B-S-J-Z (China), Hong Kong (China), Korea and New Zealand. Teacher feedback and adaptive instruction, two closely connected teaching approaches (Mostafa, Echazarra and Guillou, 2018[18]), co-existed most frequently, at least according to students’ reports, in Hong Kong (China), Jordan, Korea, Serbia and Chinese Taipei.
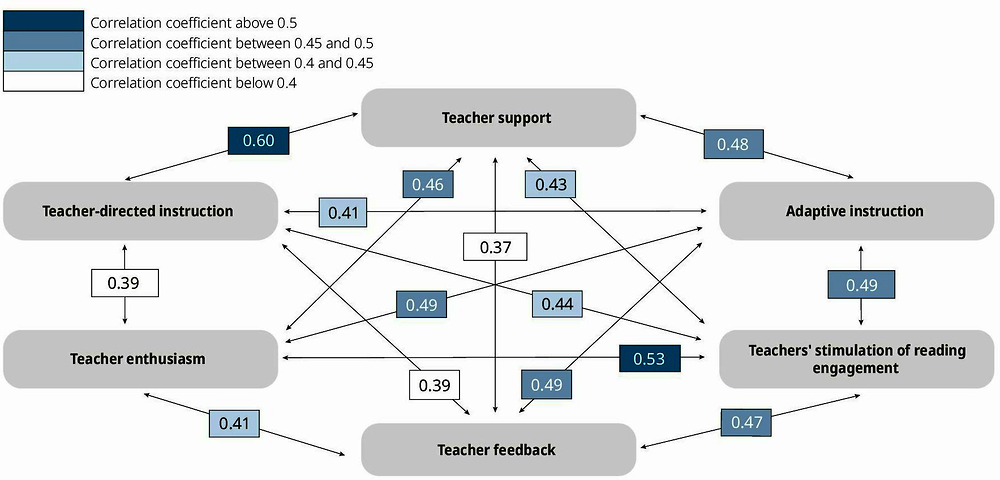
Note: All values are statistically significant (see Annex A3).
Source: OECD, PISA 2018 Database, Table III.B1.6.9.
copy the linklink copied!How are teaching practices related to enjoyment of reading?
Instilling a joy of reading in students is as important, or even more important, as teaching them how to read (Cambria and Guthrie, 2010[19]). There are several ways in which adolescents can be encouraged to read for pleasure: by enhancing their intrinsic motivation, building their confidence and making them understand the importance of reading for their lives. Research finds that teachers are well-placed to help students develop good reading habits (Munita, 2016[20]; Ruddell, 1995[21]). PISA 2018 did not ask students to describe the teaching practices their language-of-instruction teachers use to help them develop reading habits, but it did ask several questions about teaching practices more generally. These can be examined in relation to students’ enjoyment of reading. However, while the current teachers of 15-year-old students may play an important role in fostering their enjoyment of reading, how much students enjoy reading also depends on many other factors, such as their previous reading habits, academic achievement, previous classroom experiences and home environment.
PISA asked students to report whether they agree ( “strongly disagree”, “disagree”, “agree”, “strongly agree”) with the following statements about reading: “I read only if I have to”; “Reading is one of my favourite hobbies”; “I like talking about books with other people”; “For me, reading is a waste of time”; and “I read only to get information that I need”. These items were combined to create the index of enjoyment of reading whose average is 0 and standard deviation is 1 across OECD countries. Positive values in the index mean that students enjoy reading more than the average student across OECD countries.
The analyses show that, on average across OECD countries, all six indices of teaching practices were positively related to students’ self-reported enjoyment of reading, after accounting for the socio-economic profile of students and schools, and students’ reading performance (Figure III.6.5). For instance, for every one-unit increase in the indices of teacher support and feedback, the index of enjoyment of reading increased by 0.07 of a unit (one unit is equivalent to a standard deviation across OECD countries). However, once other teaching strategies were accounted for, only teacher enthusiasm, teachers’ stimulation of reading engagement and, to a lesser extent, teacher-directed instruction were still positively associated with reading enjoyment. The other three indices became either unrelated or weakly (and negatively) associated with reading enjoyment, after the other teaching strategies were accounted for.
In general, these results are consistent across PISA-participating countries and economies (Table III.B1.6.10). For instance, after accounting for socio-economic status, reading performance and other teaching practices, teacher enthusiasm remained positively associated with reading enjoyment in 60 of the 73 education systems with available data, and teachers’ stimulation of reading engagement was positively associated with reading enjoyment in 68 school systems. The strongest positive associations between teacher enthusiasm and students’ enjoyment of reading were observed in Albania, Finland, Indonesia and Kosovo; the strongest positive associations between teachers’ stimulation of reading engagement and enjoyment of reading were found in B-S-J-Z (China), Brunei Darussalam, Denmark, Estonia, Moldova, New Zealand, Norway and the United States.
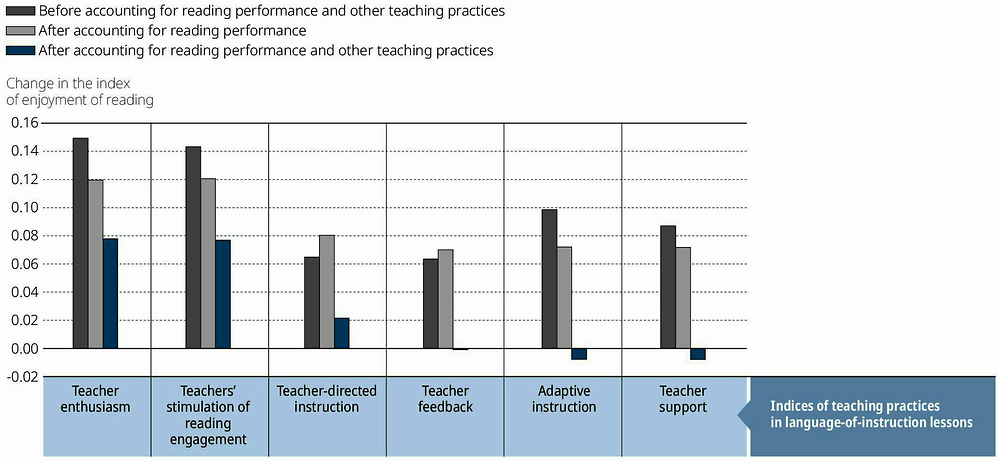
Notes: All values are statistically significant, except for teacher feedback after accounting for reading performance and other teaching practices (see Annex A3).
Results based on linear regression analysis, after accounting for students’ and schools’ socio-economic profile. The socio-economic profile is measured by the PISA index of economic, social and cultural status (ESCS).
Source: OECD, PISA 2018 Database, Table III.B1.6.10.
copy the linklink copied!Which teaching practices are more frequently used in the schools whose principals are least concerned about the quality of their teaching staff?
One way to ascertain the value of different teaching strategies is to determine which of them are more frequently used in the schools whose principals are most satisfied with the education staff, and compare these results with the schools whose principals are least satisfied. Unfortunately, PISA did not ask principals specifically about the language-of-instruction teachers in their school, but it did ask principals whether the school’s capacity to provide instruction was hindered by the following issues: “A lack of teaching staff”; “Inadequate or poorly qualified teaching staff”; “A lack of assisting staff”; and “Inadequate or poorly qualified assisting staff”. Their answers were combined to create the index of shortage of education staff whose average is 0 and standard deviation is 1 across OECD countries. Positive values reflect principals’ concern that a shortage of education staff hinders the capacity to provide instruction to a greater extent than the OECD average.
On average across OECD countries, teacher support was more frequently observed in schools whose principals were least concerned about the education staff than in schools whose principals were most concerned (Figure III.6.6). The difference between these types of schools was even greater, in favour of the best-staffed schools, when considering the indices of teacher enthusiasm, teachers’ stimulation of reading engagement and adaptive instruction. By contrast, according to students’ reports, the frequency with which teachers used teacher-directed strategies and provided feedback to students was similar regardless of how concerned principals were about the education staff in their schools.
While the disparities in the indices of teaching practices between schools whose principals were most and least concerned about the education staff were generally modest, some countries/economies showed considerable gaps (Table III.B1.6.11). For instance, in 16 countries and economies, students in schools with the highest-quality staff (according to principals) were more likely than students in schools with the lowest-quality staff to report that their teachers were enthusiastic and passionate about teaching. In 16 education systems, language-of-instruction teachers more frequently encouraged students to think (index of teachers’ stimulation for reading engagement) in schools whose principal was least concerned about the education staff than in schools whose principal was most concerned. In B-S-J-Z (China), Brazil, Brunei Darussalam, Georgia, Korea, Luxembourg, Malaysia, New Zealand, Qatar, Singapore and Slovenia, providing greater teacher support appeared to be a distinctive feature of the schools with the highest-quality staff. Only in Belgium, Bosnia and Herzegovina, Macao (China), Malta and the Slovak Republic was less teacher support observed in schools with the highest-quality staff.
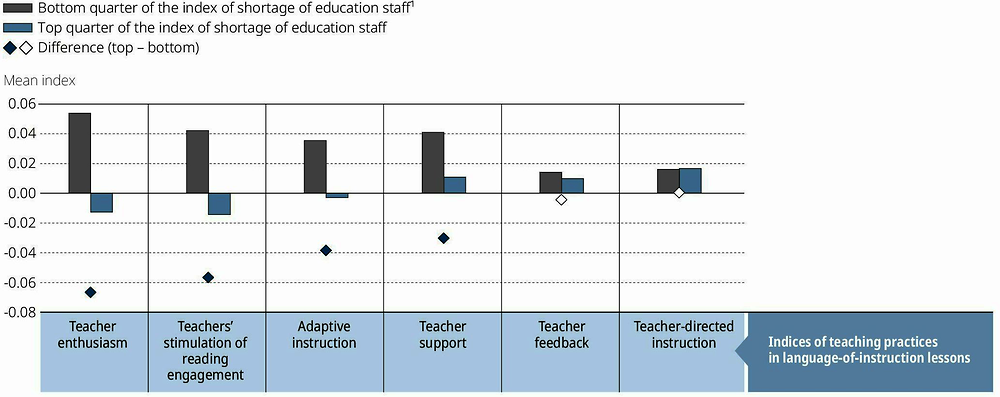
1. Higher values in the index indicate a greater shortage of education staff.
Note: Statistically significant values are shown in darker tones (see Annex A3).
Source: OECD, PISA 2018 Database, Table III.B1.6.11.
References
[19] Cambria, J. and J. Guthrie (2010), “Motivating and engaging students in reading”, The NERA Journal, Vol. 46/1, pp. 16-29.
[1] Federici, R. and E. Skaalvik (2014), “Students’ perceptions of emotional and instrumental teacher support: Relations with motivational and emotional responses”, International Education Studies, Vol. 7/1, pp. 21-36, https://doi.org/10.5539/ies.v7n1p21.
[13] Guess, P. and S. McCane-Bowling (2016), “Teacher support and life satisfaction: An investigation with urban, middle school students”, Education and Urban Society, Vol. 48/1, pp. 30-47, https://doi.org/10.1177/0013124513514604.
[14] Hattie, J. and H. Timperley (2007), “The power of feedback”, Review of Educational Research, Vol. 77/1, pp. 81-112, https://doi.org/10.3102/003465430298487.
[10] Hughes, J. et al. (2008), “Teacher-student support, effortful engagement, and achievement: A 3-year longitudinal study”, Journal of Educational Psychology, Vol. 100/1, pp. 1-14, https://doi.org/10.1037/0022-0663.100.1.1.
[2] Klem, A. and J. Connell (2004), “Relationships matter: Linking teacher support to student engagement and schievement”, Journal of School Health, Vol. 74/7, pp. 262-273, https://doi.org/10.1111/j.1746-1561.2004.tb08283.x.
[6] Lee, J. (2012), “The effects of the teacher–student relationship and academic press on student engagement and academic performance”, International Journal of Educational Research, Vol. 53, pp. 330-340, https://doi.org/10.1016/J.IJER.2012.04.006.
[15] Lipko-Speed, A., J. Dunlosky and K. Rawson (2014), “Does testing with feedback help grade-school children learn key concepts in science?”, Journal of Applied Research in Memory and Cognition, Vol. 3/3, pp. 171-176, https://doi.org/10.1016/J.JARMAC.2014.04.002.
[18] Mostafa, T., A. Echazarra and H. Guillou (2018), “The science of teaching science: An exploration of science teaching practices in PISA 2015”, OECD Education Working Papers, No. 188, OECD Publishing, Paris, https://doi.org/10.1787/f5bd9e57-en.
[20] Munita, F. (2016), “Prácticas didácticas, creencias y hábitos lectores del profesor en una escuela exitosa en la promoción lectora”, Ocnos: Revista de Estudios Sobre Lectura, Vol. 15/2, pp. 77-97.
[17] OECD (2016), Ten Questions for Mathematics Teachers… and How PISA Can Help Answer Them, OECD Publishing, Paris, https://doi.org/10.1787/9789264265387-en.
[4] Pitzer, J. and E. Skinner (2017), “Predictors of changes in students’ motivational resilience over the school year”, International Journal of Behavioral Development, Vol. 41/1, pp. 15-29, https://doi.org/10.1177/0165025416642051.
[11] Reyes, M. et al. (2012), “Classroom emotional climate, student engagement, and academic achievement”, Journal of Educational Psychology, Vol. 104/3, pp. 700-712, https://doi.org/10.1037/a0027268.
[5] Ricard, N. and L. Pelletier (2016), “Dropping out of high school: The role of parent and teacher self-determination support, reciprocal friendships and academic motivation”, Contemporary Educational Psychology, Vol. 44-45, pp. 32-40, https://doi.org/10.1016/J.CEDPSYCH.2015.12.003.
[21] Ruddell, R. (1995), “Those influential literacy teachers: Meaning negotiators and motivation builders”, The Reading Teacher, Vol. 48/6, pp. 454-463, https://www.jstor.org/stable/20201467 (accessed on 30 July 2019).
[7] Ruzek, E. et al. (2016), “How teacher emotional support motivates students: The mediating roles of perceived peer relatedness, autonomy support, and competence”, Learning and Instruction, Vol. 42, pp. 95-103, https://doi.org/10.1016/J.LEARNINSTRUC.2016.01.004.
[8] Sakiz, G., S. Pape and A. Hoy (2012), “Does perceived teacher affective support matter for middle school students in mathematics classrooms?”, Journal of School Psychology, Vol. 50/2, pp. 235-255, https://doi.org/10.1016/J.JSP.2011.10.005.
[12] Suldo, S. et al. (2009), “Teacher support and adolescents’ subjective well-being: A mixed-methods investigation”, School Psychology Review, Vol. 38/1, pp. 67-85.
[16] Tunstall, P. and C. Gsipps (1996), “Teacher feedback to young children in formative assessment: A typology”, British Educational Research Journal, Vol. 22/4, pp. 389-404, https://doi.org/10.1080/0141192960220402.
[3] Wang, M. and R. Holcombe (2010), “Adolescents’ perceptions of school environment, engagement, and academic achievement in middle school”, American Educational Research Journal, Vol. 47/3, pp. 633-662, https://doi.org/10.3102/0002831209361209.
[9] Yu, R. and K. Singh (2018), “Teacher support, instructional practices, student motivation, and mathematics achievement in high school”, The Journal of Educational Research, Vol. 111/1, pp. 81-94, https://doi.org/10.1080/00220671.2016.1204260.
Metadata, Legal and Rights
https://doi.org/10.1787/acd78851-en
© OECD 2019
The use of this work, whether digital or print, is governed by the Terms and Conditions to be found at http://www.oecd.org/termsandconditions.