Chapter 1. The ongoing transformation of the global space sector
This chapter provides an introduction to the ongoing transformation of the global space sector. It first provides a review of institutional and private investments, which are generally on the rise around the world. Governments remain today the main investors in space activities, via procurement and grant mechanisms, but long-term civil space research and development budgets show signs of slowing in some countries. The chapter examines the evolution of the space economy, confronting current hype and market realities. Focussing then on space innovation (using proxies such as bibliometrics and patents), a new landscape of innovative space activities is slowly appearing, demonstrating the ongoing globalisation of the sector. Finally, two policy approaches to better assess and support a transformed space sector are proposed.
The statistical data for Israel are supplied by and under the responsibility of the relevant Israeli authorities. The use of such data by the OECD is without prejudice to the status of the Golan Heights, East Jerusalem and Israeli settlements in the West Bank under the terms of international law.
Institutional and private investments on the rise around the world
Worldwide, governments are the main investors in space activities, via procurement and grants mechanisms to public agencies, research institutes, universities and the private sector. But in only five years the global landscape for space activities has evolved, with new countries investing in space research and development, and getting involved in global value chains. Private funding of commercial projects has also grown, with unprecedented private capital flows in the space sector from angel and venture capital investments.
Institutional funding of space programmes
Public investments represent the bulk of funding in space activities, reaching almost USD 75 billion in 2017 (and still growing in 2018), as compared to an estimated USD 52 billion in 2008. Governments invest in space capabilities to support national security and governance objectives (e.g. being able to map and monitor resources from space), but also broad socio-economic motivations, and scientific capacities’ development (see Chapter 2 on the impacts of space investments). Countries with space programmes have moved from being a very exclusive club relying on their strong defence and aerospace industries, to a much wider group of developed and developing countries, with very diverse capabilities.
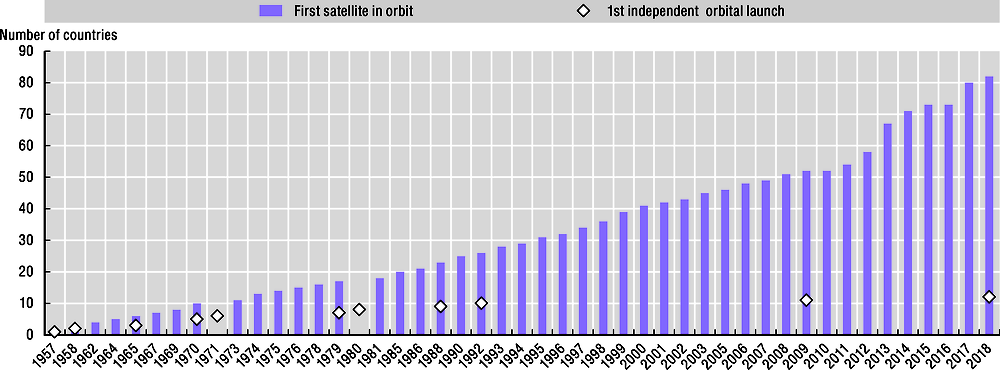
In only a decade, the number of countries with a satellite in orbit have increased from 50 in 2008 to 82 in 2018 (Figure 1.1). The satellites considered are of course very different in their specificities and may involve very little national technical expertise, ranging from large multi-ton telecommunication satellites purchased on the international market to very small cubesats built in local universities. But the possibility to have one’s satellite in orbit, registered with one’s own national administration, has never been so affordable (OECD, 2016[1]).
Since the first OECD report on the space economy in 2007, some twenty new countries have also started investing in original space programmes and supporting private endeavours, with distinctive and symbolic projects. They include, for example, the United Arab Emirates’ planned Mars mission, New Zealand’s successful small launcher, Luxembourg’s asteroid mining programme, or Israel’s lunar mission. Most of these programmes are not starting from scratch (i.e. Luxembourg has been a member of the European Space Agency since 2005 and is the home of the second largest commercial satellite communications operator, Société Européenne des Satellites, SES Global), but some of the recently announced programmes have taken the space community by surprise. This includes Luxembourg’s SpaceResources.lu initiative to develop technologies and competencies for the exploration and use of resources found on near earth objects. This has even led to a renewed interest amongst diverse legal expert groups to consider the international implications of space mining. The United Kingdom (UK) has also recently modified its regulatory framework for commercial space activities with the Space Industry Act 2018. It enables small satellite and suborbital activities to launch directly from UK territory. Several spaceport locations across the UK are under consideration (UK Department for Transport, 2017[2]). Rapid developments are also occurring in Africa, where many countries are developing their own space programmes (Box 1.1).
Space activities in Africa have picked up significantly since 2000. The continent now counts some 14 space agencies or administrations, half of which were established in 2010 or later. Eight countries, Algeria, Angola, Egypt, Ghana, Kenya, Morocco, Nigeria and South Africa, have registered satellites into orbit (often procured on the international satellite market), with the majority of satellites launched in the last ten years (Figure 1.2).
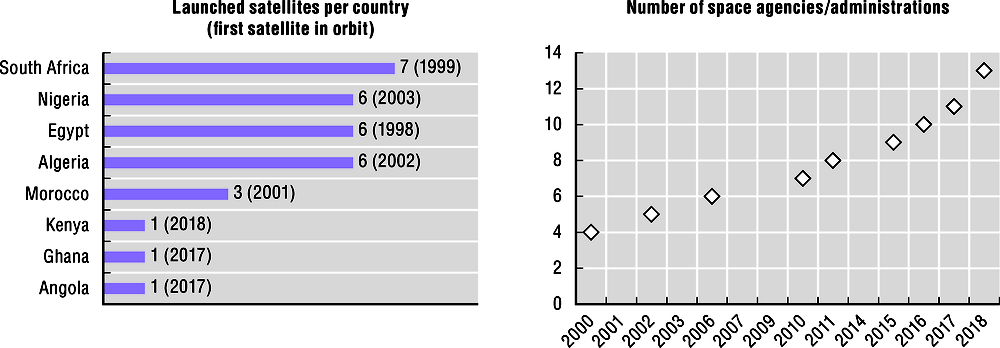
Sources: Based on UNOOSA (2019[3]), Outer Space Objects Index and Space in Africa (2018[4]), https://africanews.space.
In terms of institutional funding, Nigeria and South Africa have the largest space budgets, estimated in 2017 at some USD 29 million for the Nigerian National Space Research and Development Agency (NASRDA) and USD 23 million for the South Africa Space Agency (SANSA).
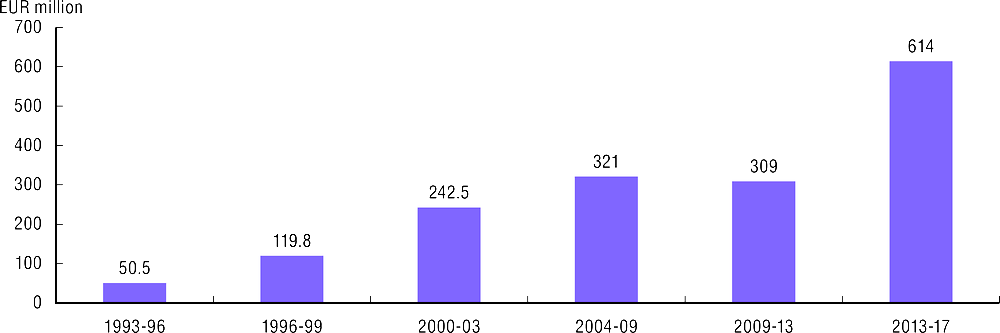
Africa is also one of the key recipient regions of space-related official development assistance, with more than USD 200 million committed to projects between 2000 and 2016, mainly addressing environmental management, forestry and telecommunications (Figure 1.3) (see also Chapter 2).
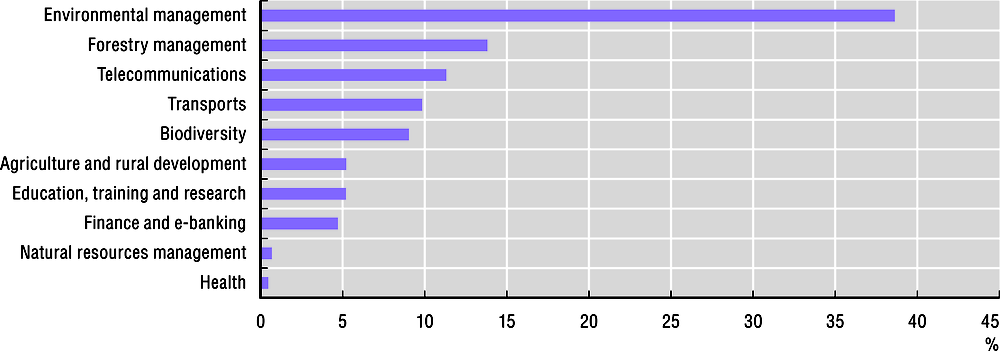
Source: Calculations based on OECD-DAC database (2018).
A recent development was the 2018 launch of the Africa Regional Data Cube, which provides easily accessible earth observation data for five African countries (Ghana, Kenya, Senegal, Sierra Leone and Tanzania). The data cube was developed by the Committee on Earth Observation Satellites (CEOS) in partnership with several public and private actors.
Global institutional space funding in 2017 reached USD 75 billion, a conservative estimate (i.e. based on 49 selected countries with the larger space programmes). Overall, the institutional funding of the largest space programmes remained stable or increased slightly, while most medium and smaller programmes have increased in real terms, and as a share of GDP.
The United States remains the largest space power, building on decades of annual multibillion dollar investments in space programmes. Other countries have developed advanced space programmes, with a wide portfolio of activities, also following decades of investment at much lower levels (e.g. France, Germany, Italy, Canada). In parallel to national programmes, the European Space Agency is an excellent example of how European countries have worked together to build up industrial capacity and create regional value chains for their national space industries (Box 1.2). In the past few years, the European Union via the European Commission has also taken a much larger investor role in the European space industry. Already in charge of the Copernicus earth observation programme and the Galileo navigation satellite programmes, the European Commission is taking a leading role in satellite communications, with the EU GovSatcom initiative. Between 2014 and 2020, it should invest over EUR 12 billion in space activities. With over 30 satellites planned in the next 15 years, the European Union is expected to be the largest institutional customer for launch services in Europe (De Concini and Toth, 2019[5]).
The European Space Agency is a major success story in international co-operation. Created in 1973 with ten founding members, it now counts 22 members, and with a 2017 budget of EUR 5.8 billion, including third-party programmes (USD 6.5 billion – almost 0.04% of European GDP), it represents one of the most active space agencies in the world, with a portfolio covering a wide range of space activities, from science, research and development (R&D) programmes to supporting space entrepreneurs (Figure 1.4).
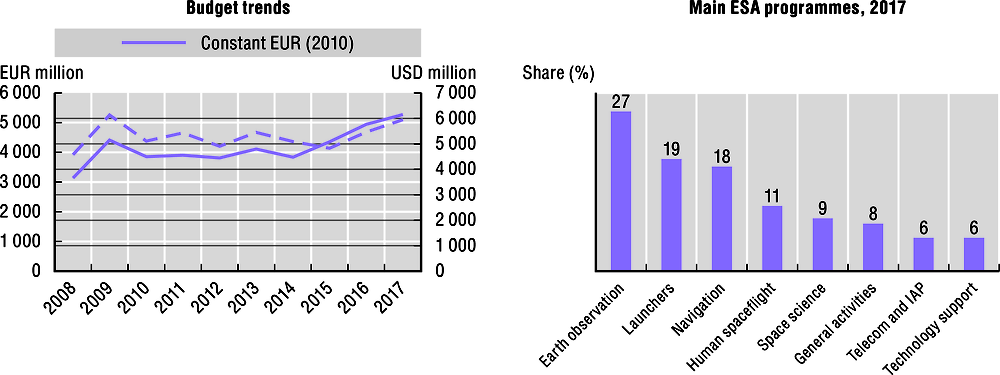
Note: Budgets include third-party programmes.
ESA funds R&D at all stages of technological readiness. Early stage R&D is funded through the Basic Technology Research Programme (about EUR 65 million per year), whereas the General Support Technology Programme (GSTP) and ARTES (telecommunications) programmes aim to convert promising concepts into mature products, working with industry. Funding for the five-year GSTP programme for 2013-17 amounted to more than EUR 600 million (Figure 1.5). ESA is also supporting the emergence of start-ups through its active network of business incubation centres (BICs) in 17 member states.
Source: European Space Agency (2016), GSTP 1993-2017, http://www.esa.int/spaceinimages/Images/2016/11/GSTP_Infographic.
Institutional space budgets fund a large range of activities in space research, development and applications in both civilian and military domains. Budgets are often spread across several government agencies, which makes them difficult to track in national accounts. The estimates provided here should therefore be considered as conservative. Figure 1.6 illustrates trends in institutional funding for a selection of OECD countries and partner economies. Although the past five years have generally been a period of tightening government budgets, space budgets have remained relatively resilient to cuts, with growth taking place both in countries with large, established space programmes and in countries with smaller programmes. In Europe, contributions to the European Union programmes Galileo and Copernicus, account for some of these budget increases, but in some cases they also reflect targeted government strategies. Meanwhile, the Russian Federation has seen significant space budget cuts in recent years, following the fall in commodity prices.
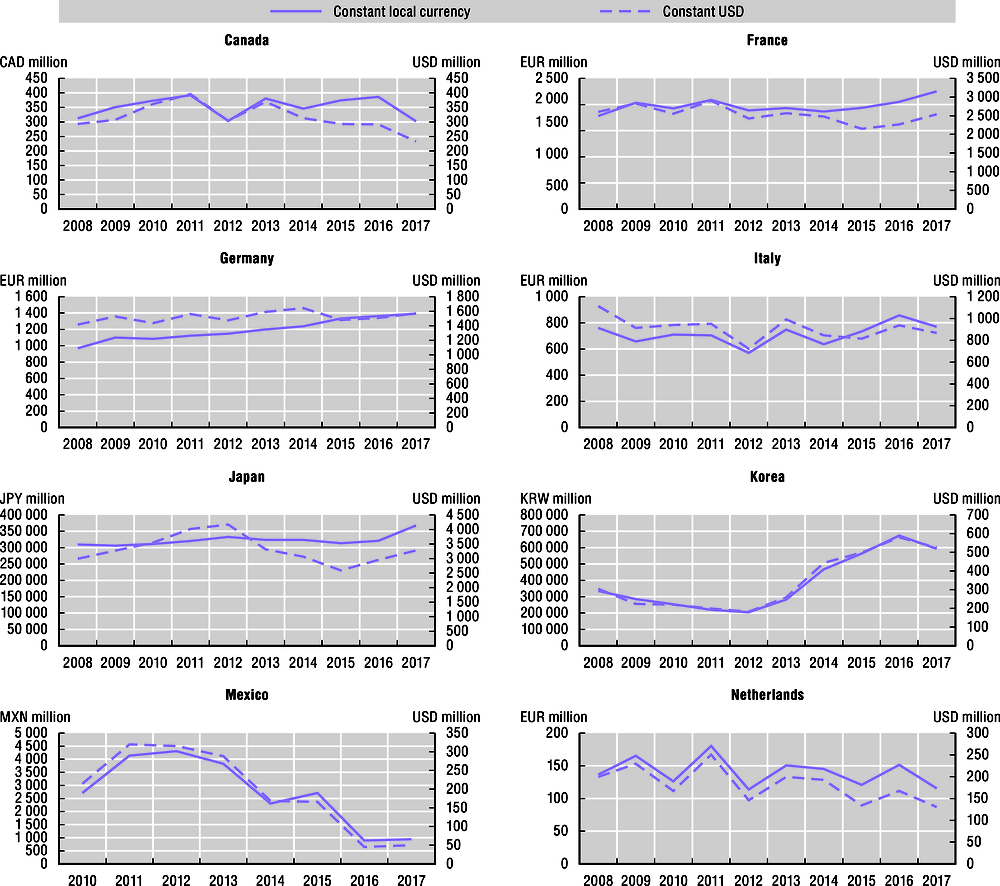
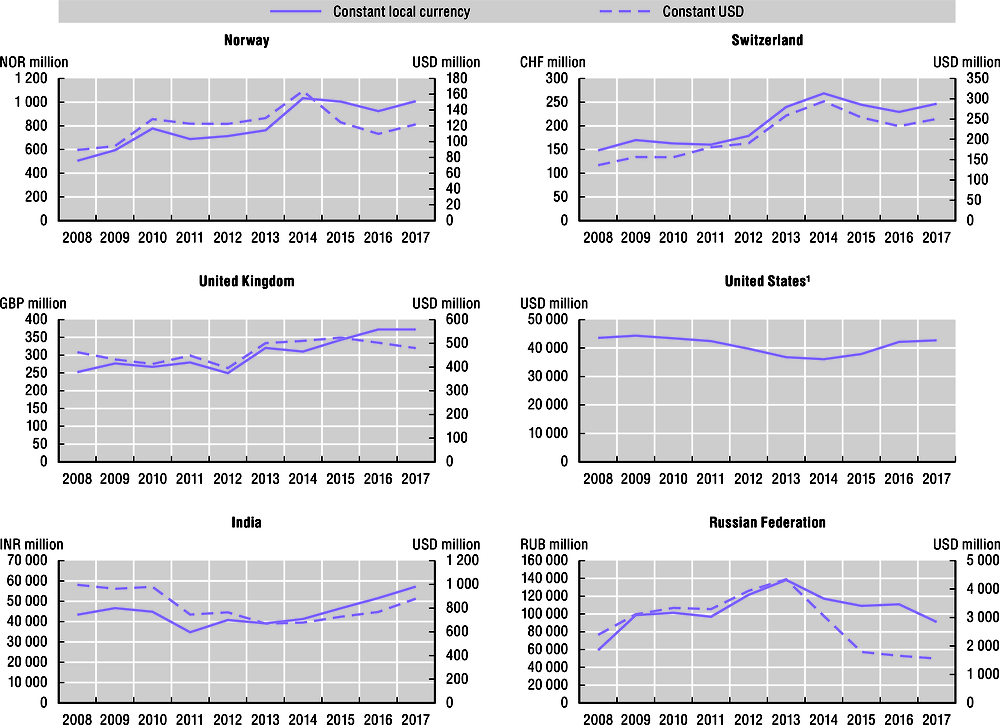
1. Conservative estimate for the United States.
Source: Government budget sources and OECD databases (see Box 1.4).
Still more growth in institutional funding is expected, although at very different scales depending on national situations. The United States is significantly increasing government funding to both civil and military space programmes. As an illustration, the US Air Force could invest some USD 44 billion over five years in space systems (mainly R&D) between 2018 and 2023 (Erwin, 2018[6]). Luxembourg is setting up an ambitious space programme, investing EUR 238 million (USD 263 million) over the 2017-21 period, half of which will be dedicated to public and private research (Luxembourg Ministry of Finance, 2017[7]). Countries with emerging programmes are also investing in space activities, with New Zealand and Australia, which established space agencies in 2017 and 2018, respectively. New Zealand has set aside some NZD 20-30 million (USD 14-21 million) over the next three years for the space agency and a new space technology research centre. The Australian 2018-19 budget announced funding of AUD 26 million (USD 20 million) over four years to the Australian Space Agency, and AUD 15 million (USD 11 million) to an Australian business support scheme.
New Zealand is a new and dynamic actor in the space sector with a focus on harnessing the miniaturisation and lower launch costs that characterise the ‘New Space’ paradigm shift in order to achieve a range of economic development, science and innovation, and social and environmental goals.
New Zealand is facilitating the creation of a local space industry to help solve some of the world’s most pressing issues, such as climate change, illegal fishing and responding to disasters. As well as the spillover benefits of space R&D, New Zealand views space as an opportunity to raise productivity in its traditional sectors – such as through precision agriculture – as well as develop a globally competitive domestic space industry.
To achieve this, New Zealand has established a responsible regulatory regime that balances international obligations and preservation of the space environment while also matching the pace at which the New Space industry is moving. [The Outer Space and High-altitude Activities Act (OSHAA), passed into law in July 2017, regulates orbital launch vehicles, launch facilities and satellites, as well as high-altitude vehicles (excluding high-altitude vehicles used for weather and atmospheric monitoring and educational purposes).]
Already host to the world’s first fully private orbital launch facility, New Zealand is committed to facilitating the development of a local space ecosystem. Its priorities are developing its small-sat launch industry, high-tech manufacturing, data analysis and integration, application development, and ground stations, including space situational awareness.
Source: New Zealand Ministry of Business, Innovation & Employment / Hīkina Whakatutuki.
Increasingly, beyond national or federal governments’ budgets, more regions are also investing in space programmes via different mechanisms. These investments, albeit often small in scale, are occurring in many parts of the world to attract or retain actors from the space industry (e.g. Canada, Italy, United States). In the United States, there are currently ten licensed orbital and suborbital commercial spaceports, several of which have been constructed in anticipation of possible future developments. Spaceports are often strongly supported by regional policy-makers for local industry development (FAA, 2018[8]; OECD, 2016[1]). As an illustration, the space budget of the state of Florida equals that of a medium-sized European country (USD 30 million in 2016) (Space Florida, 2016[9]).
One of the most useful indicators to measure and compare space funding intensity is the ratio of space budget to the national gross domestic product (GDP) (Figure 1.7). In 2017, the budget of the United States accounted conservatively for some 0.24% of national GDP, followed by the Russian Federation at 0.17%, France at 0.1%, The People’s Republic of China (hereafter “China”) at about 0.08% and Japan at 0.07%. The calculations for the United States, China and Israel are based on conservative estimates. The majority of space budgets constitute less than 0.05% of GDP in 2017 (including civil and military space activities where data are available). Evolutions in a space budget’s share in GDP may be affected not only by changes in funding levels but also by rapidly contracting or expanding GDP.
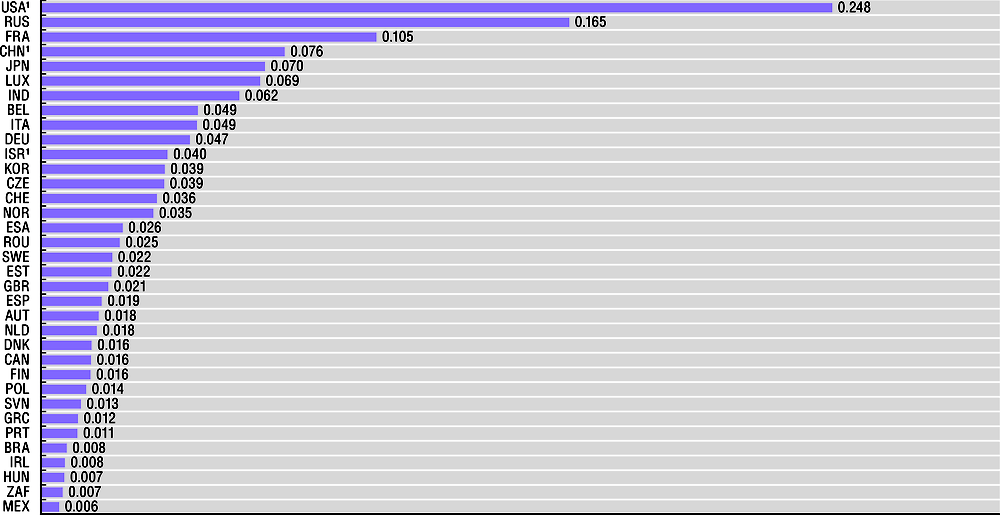
1. Conservative estimates.
Sources: Government budget sources and OECD databases (see Box 1.4).
Government budget allocations for research and development (GBARD, previously known as GBAORD) is another indicator which provides interesting insights about the long-term orientations and volumes of government-funded R&D. Data collection for this indicator has been carried out in many economies since the early 1980s. Governments’ R&D activities are classified according to 14 different socio-economic objectives, one of which is ‘the exploration and exploitation of space’. This category includes both fundamental and applied R&D activities and space-related infrastructure (laboratories, launch systems, etc.). But the data have some limitations, since civil space GBARD excludes all defence-related activities and potentially some of the R&D dedicated to earth observation, meteorology and environment monitoring (categorised under ‘exploration and exploitation of earth’). Despite this caveat, GBARD gives an indication of how some space-related R&D budget allocations have evolved, as compared to other national priority areas and over time.
In 2016, civil space R&D (space GBARD) for the OECD members accounted for some 0.4% of GDP and 8% of total government allocations to civil R&D (OECD, 2018[10]), as is shown in Figure 1.8. In the United States, government budget allocations in 2017 for civil space R&D accounted for some 0.07% of GDP and almost 18% of total civil GBARD; followed by Italy (0.05% and 9.3%, respectively), Belgium (0.05% and 8.4%, respectively) and Japan (0.04% and 8%, respectively). In the European Union (EU28), civil space R&D programmes accounted for about 0.03% of GDP and 5% of total civil GBARD (OECD, 2018[10]).
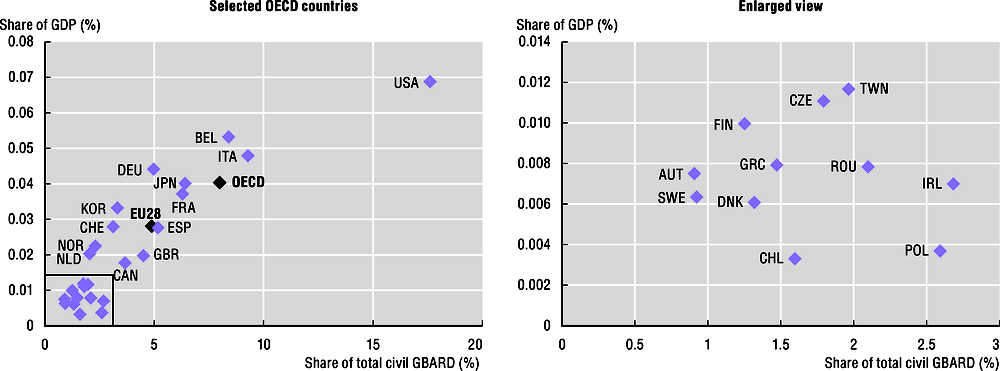
Note: Data from 2016: Belgium, Estonia, France, Greece, Ireland, Italy, Korea, Poland, Spain, United Kingdom, OECD and EU28. Data from 2015: Canada, Chile, Switzerland.
Source: OECD (2018[10]), OECD Science, Technology and R&D Statistics (database), https://doi.org/10.1787/data-00182-en.
When studying the long-term trends of space GBARD (Figure 1.9) over the last three decades, several observations can be made. First, high-spending countries, such as France and the United States, dedicate a decreasing share of their GDP to government civil space R&D compared to the early 1990s, when the share was double what it is today. Second, an increasing number of countries engage in space activities and carry out space R&D. Finally, several countries which dedicate a small or medium share of their GDP to space GBARD have seen a positive growth in the last decade (e.g. United Kingdom, Norway). As a result, space GBARD’s share of GDP is converging across the OECD, with ratios stabilising between 0.02 and 0.07%.
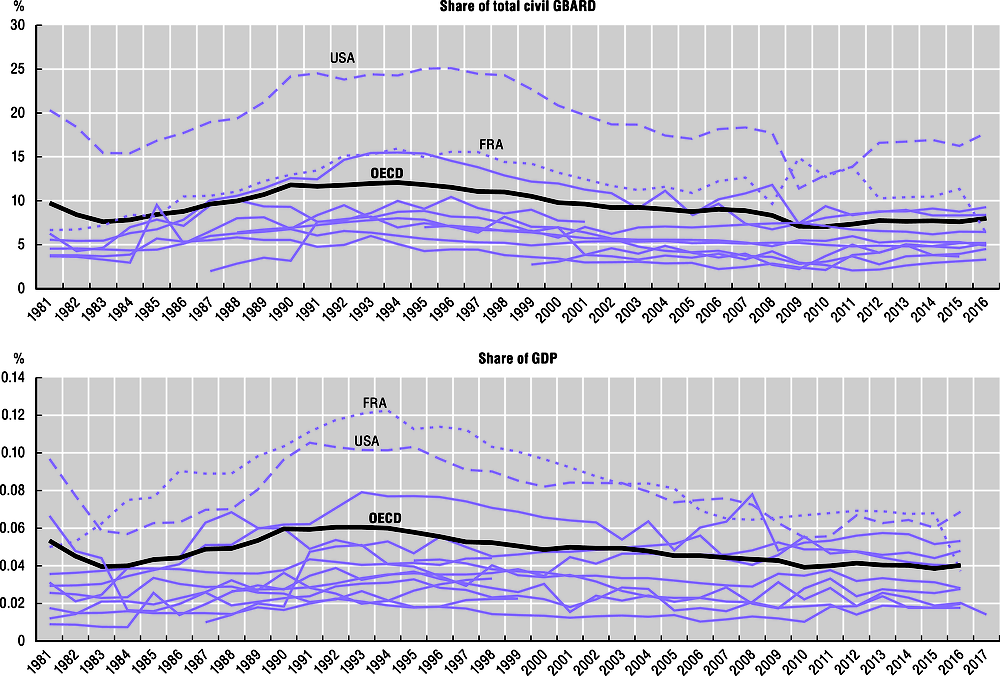
Note: Data from 2016: Belgium, Estonia, France, Greece, Ireland, Italy, Korea, Poland, Spain, United Kingdom, OECD and EU28. Data from 2015: Canada, Chile, Switzerland.
Source: OECD (2018[10]), OECD Science, Technology and R&D Statistics (database), https://doi.org/10.1787/data-00182-en.
International comparisons of institutional budgets for space activities can be affected by many factors, in particular exchange rate issues and data sources. The past seven years have seen many exchange rate fluctuations, making comparisons of national budgets in US dollars (USD) more difficult. Comparing budgets using indices and the ratio budget/GDP based on national currencies still provides the most reliable snapshot of the situation, despite other methodological caveats (e.g. impacts of GDP growth or contraction). When converting national budgets to US dollars to compare budgets, worldwide institutional funding in 2017 is estimated at some USD 75 billion (current) for the 49 economies with the largest space programmes (civil and military). This does not take into account differences in domestic purchasing power, e.g. 1 US dollar does not buy the same amount of space R&D in the United States as in India because of local differences in wage levels, for example.
Government grants and procurement are the most important direct financing instruments for space technology and R&D; they account for the lion’s share of institutional space budgets. They are typically channelled through national space agencies and international space organisations (e.g. NASA or ESA), but increasingly through other actors as well, such as the EU Horizon 2020 R&D programme or the European GNSS Agency (GSA). Indirect financing instruments also exist, most notably R&D tax incentives.
If the objective goes beyond R&D support at different technology levels and aims to foster innovation and business development, other financing instruments are important. Loans, loan guarantees, seed grants and similar instruments can be vital for small and young enterprises, which are important sources of new employment and economic growth through innovation (OECD, 2010[11]). Loans can be provided by national innovation agencies and development banks, but are also often provided by local and regional authorities or international bodies (European regional funds). It should be noted that these institutions can also provide other funding solutions. In the last years, innovative financing instruments, such as venture capital and crowd funding have become more common.
Methodological note on institutional budgets: Data are based on government budget estimates for 2017, and actual expenditure for previous years, as identified in national accounts and subject to availability. They include both civil and military space programmes, again subject to availability. Budgets of European countries also include national contributions to the European Space Agency and EUMETSAT. Furthermore, budgets for the Czech Republic, Norway and Switzerland include national contributions to the European Union programmes EGNOS/Galileo and Copernicus. In the cases where contributions to EUMETSAT did not have separate budget entry, estimates are based on the data from EUMETSAT’s latest annual report (EUMETSAT, 2018[12]). Budget trends are provided in both constant national currencies and in constant US dollars, to give an indication of the currencies’ fluctuations. For calculations, this chapter uses exchange rates (annual averages) from the Finance dataset in the OECD Main Economic Indicators (MEI) database (OECD, 2019[13]). The OECD consumer price index (CPI) ‘all items’ was used to calculate budgets in constant local currencies and USD. The base year of the index is 2010. CPI data were retrieved from the Prices dataset in the OECD Main Economic Indicators (MEI) database (OECD, 2018[14]). National GDP comes from the “Main Science and Technology Indicators” dataset in the OECD Science, Technology and R&D Statistics database OECD (OECD, 2018[10]).
Private funding of space activities
Private sources of investment for space projects are challenging to track; however, current evidence shows unprecedented investments from angel and venture capital funds in space start-ups and recently established firms, although the amounts still pale compared to public funding.
Commercial satellite telecommunications have paved the way for private financing, as the high profitability of satellite services over the past 15 years has allowed operators to benefit from classic financial schemes (e.g. equity financing, bond issuance) to develop their activities, buy satellites and fund innovation, especially in their distribution networks. Most satellite operators in OECD countries have become publicly traded corporations, and this is also now happening in China, where state-owned enterprises are being restructured (e.g. the operator China Satellite Communications Corp. is due to open its capital; it is a subsidiary of the state-owned China Aerospace Science and Technology Corp., which designs and manufactures many of China’s satellites). Operators have also resorted to project financing, with syndicates of banks providing loans. This successful trend in financing satellite telecommunications has led to similar, if limited, experiences in other domains of space activities. For example, in the past ten years, several companies have launched initial public offerings of stocks, using the proceeds to build their next generation of earth observation satellites (e.g. Digital Globe in the early 2010s).
The main sources of funding for new firms are usually the founder’s own funds, with investments from family circles, bank loans, equity capital (including from business angels and venture capitalists) and government support. A relatively new source of private capital comes from large aerospace and defence firms, which have all set up their own venture capital funds in the past five years, to invest in start-ups involved in software development, artificial intelligence, augmented reality, sensors and autonomous vehicles in particular. Some of the most active actors include for example Boeing’s HorizonX Ventures, Lockheed Martin Ventures, Airbus Ventures, Thales Corporate Ventures, and the Dassault System Venture Fund.
In the space sector, start-up equity investments represented some USD 3 to 3.25 billion in 2018 (Space Angels, 2019[15]; Seraphim Capital, 2019[16]). The number of investment transactions also grew globally, from 200 investment deals in 2011 to over 1 400 in 2017. Space Angels estimates that the 2018 total represented around 16% of all the equity capital invested in space companies since 2009. In China, almost 100 space start-ups have been launched since 2015, following a new national policy to foster space commercialisation (see country profile of China). In 2018, some 30 start-ups involved in rockets, satellite manufacturing and applications raised approximately USD 310 million in venture capital. When including publicly-listed space companies, total private investment amounted to USD 530 million in China (FutureAerospace, 2019[17]). Although these amounts are far from negligible, as a comparison, more than USD 50 billion was invested in artificial intelligence start-ups during the period 2011 through to mid-2018, with some USD 17 billion in 2017 alone (OECD, 2018[18]).
Investments from billionaires in numerous space ventures have also increased in the past five years (Table 1.1). Most of the recent space companies are privately funded (e.g. Space X, Blue Origin) and not publicly traded. Although there are few public data available, their capitalisation is considered important in view of their ongoing large projects (launchers, space exploration modules) and commercial contracts particularly with the US government.
As a final indication of changes in private financing, new exchange-traded funds, which usually contain various types of investment instruments, are increasingly including stocks from space-related companies. Stocks in aerospace and defence companies have for many years formed attractive portfolios in investment funds, but the specific focus on space is relatively recent. Further interest from the investment community may come if the capital formation of some of the more successful space companies from Table 1.1 eventually moves into the public market.
Despite positive trends, sustained access to finance will remain a challenge for a majority of established and new players in the space sector. Hardened international competition between incumbents, the acceleration of the rollout of new technological solutions, and the apparition of ever-more newcomers with yet unproven business models continue to affect the investment landscape.
Actual returns on investments are still to come for most space ventures that have received capital in the past five years. Long lead times represent an inherent issue for most space activities, as manufacturing processes and launch to orbit take time. These constraints may be increasingly alleviated thanks to major impacts of digitalisation on manufacturing and production processes (impacting satellites, rockets, ground systems) (see Chapter 4). But these are changes still very much in the making. Also the enthusiasm surrounding new space activities may have created possible ‘economic bubbles’. Consolidation and buy-outs are expected in the next two years for many competing space start-ups, especially in the small launcher segment where several dozens of actors are currently being financed. The hype concerning the space economy is discussed in the next section.
The space economy: Hype and market realities
In the past five years, many public and private actors have begun investing in space activities. In parallel, some are developing new business proposals, based on the combination of space and digital technologies coming to market (e.g. miniaturised space systems, big data analytics). With new space systems coming of age and stimulating fresh entrepreneurial approaches shaking the industry, a certain hype surrounding the space economy has emerged.
The space sector is indeed facing a new cycle in its development, with mature off-the shelf technologies that can be used by many actors, and new commercial downstream activities derived from satellite signals and data. Although there are many government programmes around the world that support the development of the space economy (via contracts to industry), and a growth of commercial activities in several downstream space segments (e.g. location-based services), available data on the space economy show that the growth of commercial space activities remain modest overall and should not be overestimated. As national administrations and private actors progressively get a better picture of value chains in their national and regional space economy via industry mapping, more evidence on the space economy is expected (see Box 1.6).
Start-ups in the space sector are increasingly supported by public and private programmes (incubators and accelerators).
-
Several government initiatives are targeting downstream business and application development, e.g. the UK Satellite Applications Catapult at the Harwell space cluster for British start-ups, and the French Booster programme which supports four dedicated activities in co-ordination with existing technology clusters (OECD, 2016[1]).
-
The European Space Agency is supporting business incubation centres (BIC) in its member states, resulting in more than 500 company creations since the launch of the first centres in 2003 (ESA, 2017[20]). The initiative supports on average some 140 start-ups per year (ESA, 2017[20]). The ESA BIC in Harwell reports a company survival rate of 92% since the creation of the incubation centre in 2011 (O’Hare, 2017[21]). The Bavarian ESA BIC, established in 2009, has incubated 130 start-ups, generating 1 800 job creations and EUR 150 million in annual turnover (ESA BIC Bavaria, 2018[22]).
-
Space agencies furthermore regularly organise hackathons, prizes and challenges to reach out to non-space users, in particular those in the information and communication technologies (ICT) sector, to identify new ideas and business models (e.g. ActInSpace organised by the European Space Agency and the French Centre national d’études spatiales; the Copernicus Masters and the European Satellite Navigation Competition). In the United States, government procurement programmes support start-ups in satellite weather and cubesat earth observation (US National Geospatial-Intelligence Agency, 2018[23]; St. Jean, 2018[24]).
International comparability remains limited when examining the space sector’s existing statistics, despite much progress overall in terms of data quality and time-series, and the development of national industry surveys in different parts of the world since the first OECD Handbook on Measuring the Space Economy was published (OECD, 2012[28]). Statistical perimeters of economic sectors and industries are often defined according to the data needs of different users (e.g. policy-makers at local, regional and national levels, administrations, industry). This results in often different priorities regarding definitions and measurement.
The following working definition formed the starting point of the first Handbook on Measuring the Space Economy and is today used quite extensively:
The space economy is the full range of activities and the use of resources that create and provide value and benefits to human beings in the course of exploring, understanding, managing and utilising space. Hence, it includes all public and private actors involved in developing, providing and using space-related products and services, ranging from research and development, the manufacture and use of space infrastructure (ground stations, launch vehicles and satellites) to space-enabled applications (navigation equipment, satellite phones, meteorological services, etc.) and the scientific knowledge generated by such activities. It follows that the space economy goes well beyond the space sector itself, since it also comprises the increasingly pervasive and continually changing impacts (both quantitative and qualitative) of space-derived products, services and knowledge on economy and society.
A second OECD Handbook is being produced and tested, with the aim to provide advice, particularly to new actors in the space economy, on how to delineate activities, products and services in the different space economy segments, to inform micro-data level industry surveys.
Government space programmes supporting the space economy
Three overarching thrusts are driving commercial revenue generation in the space sector in all its segments, and will probably continue to do so over the next decade: national security goals; the pursuit of scientific objectives and human space exploration; and the expansion of downstream space applications (OECD, 2016[1]).
The pre-eminence of government objectives, from defence to space exploration, remains a key driver in most space programmes today and will remain for the foreseeable future. Institutional budgets are funding, via procurement schemes and grant mechanisms, a majority of commercial space activities around the world. In addition, in many countries, public administrations play a major role in not only administrating and coordinating space activities, but also in pursuing research and development. Historically, and still today, national agencies, research centres, universities and laboratories (such as test facilities) perform fundamental research, applied research and experimental development in the space sector (see country profiles for illustrations). These research capacities under governmental control have important impacts on employment and public innovation capabilities for the space sector (see Chapter 3 about employment).
This is not a situation unique to the space sector, as major infrastructure and transport activities rely directly and indirectly on sustained public investments (OECD, 2017[25]). But many of these funding schemes in the space sector aim to sustain governmental captive markets, reserved in priority for national industries. This is particularly true for military space programmes, even if recent mergers and acquisitions in North America and Europe have allowed companies to bid for large governmental contracts across the Atlantic.
The growth in institutional demand has so far compensated the downturn in commercial satellite telecommunications markets (see Chapter 6), the traditional leading segment for the European space manufacturing industry. Government programmes represented 59% of European industry’s sales in 2017 (EUR 5.1 billion, out of a total of EUR 8.76 billion), with critical procurement from ESA and national space agencies (ASD - Eurospace, 2018[26]). Even when examining exports, a fourth of the European industry sales respond to demand from public agencies, whether civilian or military. In the United States, manufacturers and space launch providers are also benefitting from significant programmes from the US Department of Defense (recent USD 7.8 billion contract for the upgrade of the GPS constellation awarded to Lockheed Martin), while in China the space industry benefits from large scale investments by the Chinese authorities. In the United Kingdom, much of the recent growth in the UK space economy was also driven by recent public investments in launch vehicles and subsystems (London Economics, 2019[27]).
The role of initial and sustained government funding will be essential when looking ahead to further developing the possible “cislunar space economy”. This would include commercial human spaceflight in orbit and beyond, the expansion of the human presence in space, or the development of new space missions that may have long-term commercial implications (e.g. space mining). At the core of these missions that are all becoming possible thanks to technological advances, commercial actors will certainly play a determining factor, but with institutional funding support (see also Chapter 5).
Putting different markets in perspective
At a first glance, the space sector seems relatively small and easy to value. Some segments, like space manufacturing, are indeed rather well known, thanks to regular industry surveys that have been conducted for decades (e.g. the Eurospace survey on European space manufacturing). The knowledge base continues to grow internationally and many national and industry associations’ efforts are to be commended with annual and bi-annual surveys to map activities and build up datasets to support policy-making (see Box 1.6). However, extensive and comparable microdata to quantify in detail the different segments of the space economy in different countries are still lacking.
In the past five years, much attention has been given to the growth potential of downstream space activities. Downstream activities are very diverse, but they all directly rely on the provision of satellite technology, signals or data to function. Many applications are by definition reliant on space infrastructure set up by public and/or private actors. They include services and products for consumers using satellite capacity, such as communications, satellite television services, geospatial products, meteorology and location-based services (e.g. a navigation device using satellite positioning signals from publicly funded space infrastructure, like the US GPS, the European Galileo or the Chinese Beidou systems). The actual value creation and revenue generation are often far removed from the initial investments.
Commercial satellite telecommunications were indeed first to link with a wide range of businesses with no previous connections to the space community, in order to commercialise satellite capacity mainly for television broadcast. Telecommunications markets are currently facing uncertainties, as space and ground technologies, as well as customer behaviours, are evolving rapidly. There is a current downturn in satellite video, which is starting to impact satellite operators as well as manufacturers. Incumbents and future satellite constellation operators increasingly have to navigate complex telecom ecosystems (more in Chapter 6). Other important downstream actors include the suppliers of devices and equipment supporting consumer markets.
When examining the company Bryce’s 2019 State of the Space Industry report (commissioned by the US Satellite Industry Association), around 87.8% of the estimated USD 277 billion in revenues are generated by activities based on satellite capacity (signals, data), sometimes by actors that are building on investments made by others, much higher in the value chains.
-
The bulk of the space economy revenues are considered to come from commercial satellite services with USD 126.5 billion, i.e. 45.6% of the total revenues (with satellite fixed services representing USD 17.9 billion, mobile satellite services USD 4 billion; satellite radio USD 5.8 billion; satellite broadband USD 2.4 billion; commercial remote sensing USD 2.1 billion; and satellite television services representing USD 94.2 billion) (Bryce Space and Technology, 2019[29]) (see Chapter 6 on satellite telecommunications).
-
The second largest share of revenues (USD 125.2 billion, 45% of the estimated space economy) consists of devices and chipsets to receive positioning, navigation and timing (PNT) signals (USD 93.3 billion), consumer equipment such as satellite television dishes (USD 18.1), and other network equipment, such as very small aperture terminals and gateways (13.8 billion). Overall these sectors are dominated by consumer electronics companies.
-
In comparison, space systems’ manufacturing revenues are valued at USD 19.5 billion, i.e. 7% of the total revenues, while the commercial launch industry represents USD 6.2 billion (i.e. 2.2% of the total). These two activities are the foundations for all the others, and are being strongly affected by digitalisation and growing competition from newcomers (see Chapter 4).
When comparing these results with time series and a previous 2014 report, the revenues totalled at that time some USD 246 billion (USD 203 billion in 2014 dollars in the original report). Taking into account discrepancies, the main increase in revenues from 2014 to 2019 comes from the then-strong development of consumer ground equipment, pushed particularly by positioning and navigation equipment (Tauri Group, 2015[30]). A study conducted every two years by the European GNSS Agency, with the estimates usually reused in many other industry report, confirms these trends (European GNSS Agency, 2017[31]). It forecasts that satellite navigation, position and timing devices and related augmentation services could grow by more than 6% annually between 2015 and 2020 before gradually decelerating over the following years. In the United Kingdom, the downstream segment – which has represented the largest segment of the UK space economy via the satellite television direct-to-home and telecommunication markets – has grown since 2014 at a rather slow rate of 1.1% per year (London Economics, 2019[27]).
Imports and exports are useful indicators in today’s interconnected world. Still, many commercial space activities are not covered by official statistics, and beyond this limitation, many space products and services are considered strategic in nature and not freely traded. To convene a partial overview of existing trade in the space sector, some conservative data are provided, covering the commodity code “spacecraft (including satellites) and spacecraft launch vehicles” (code 7925) in the International Trade in Commodity Statistics (ITCS) database.
Based on this commodity code, OECD countries are heavy exporters of space products (Figure 1.10). The value of exports almost tripled in fifteen years, amounting to around USD 3.4 billion in 2018. The aggregate for the European-28 region showed a slower growth pace between 2002 and 2018. Exports from BRICS countries experienced growth, booming to USD 1.1 billion in 2018. This suggests a catching-up process in commercial markets, as many Chinese and Indian satellite products are now exported.
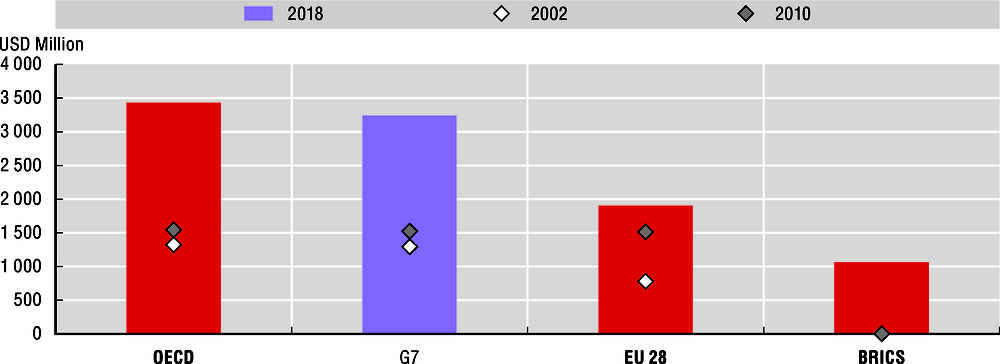
Note: The figures refer to trade of the product code 880260 of the Harmonised System (HS) for commodity classification. Code 880260 includes: spacecraft, including satellites, and suborbital and spacecraft launch vehicles. The latest available year for Israel was 2017, while the 2009 statistics is reported instead of 2010 for the United States.
Source: Calculations based on UN COMTRADE database and ITC statistics, 2018.
Although they can show only a partial view, snapshots of global exports in 2018 for the code 7925 reveal that France was the leading exporter in 2018 (27.6% of the total exported value), followed by China (22.3%) and the United States (20%). Other actors include Japan (8.1%), Germany (7.9%) and Israel (5.7%).
There is much hype about the space sector and its commercial potential, driving activities in consumer electronics, far beyond space manufacturing and space launchers, with some reason, as it has never attracted so much investment from both public and private actors. Many recent estimates and forecasts from leading consulting firms and investment banks have provided different estimates. This is a challenging exercise, as the space economy encompasses various activities and different value chains (from hardware to digital products far removed from initial space investments). A 2018 report by the investment firm Goldman Sachs predicted that the space economy would reach USD 1 trillion in the 2040s, while a different study by Morgan Stanley projected a USD 1.1 trillion space economy in the 2040s. A third study by Bank of America Merrill Lynch has the most optimistic outlook, seeing the market growing to USD 2.7 trillion within the same timeframe (Table 1.2). As a comparison, revenues from the well-established global commercial airlines amounted to USD 821 billion in 2018 with net profits of around USD 32.3 billion (IATA, 2018[32]).
However, one should remain prudent in forecasts, as downturns may occur in selected downstream markets, notably satellite telecommunications and satellite navigation, position and timing markets, because of strong competition from new terrestrial systems coming online (see Chapter 6). In addition, possible accidents in the space infrastructure need to be taken into account in different scenarios (e.g. satellites remain fragile because of space debris, jamming of signals, etc. see Chapter 5).
As more countries conduct industry surveys to collect relevant micro-data on their space sector’s value chains, with the support of national statistical offices or consulting firms, often linking with industry associations, more evidence should become available on the different segments of the space economy. The OECD is already working with many actors to support this effort.
Space innovation is also more globalised
Another major element in the transformation of the global space sector concerns the changing innovation landscape. Space innovation can be examined via proxies such as peer-reviewed scientific publications and patents. Scientific publications convey the research findings of scientists worldwide and provide an indication of the knowledge production in the space sector. Although the numbers are growing, publications and patent applications are still only an indication of innovation, as they often are limited by commercial discretion and confidentiality issues.
Scientific papers on space activities have been published in specialised journals since the late 1950s, but they remained the remit of just a few experts for almost 30 years. Since the 1990s, the multiplication of specialised journals and international conferences has strongly impacted the diffusion of publications on space sciences, technologies and space applications. This trend parallels the growing number of countries involved in space programmes, especially from the BRIICS (Brazil, Russian Federation, India, Indonesia, China and South Africa).
Countries having long-standing space programmes are still leading in terms of scientific publications in space literature, but new countries are emerging (Figure 1.11). The United States has the largest share of publications, accounting for around 22% of the total. China and India saw significant increases. China’s scientific production increased ten-fold between 2000 and 2016, making it one of the leading contributors worldwide, which reflects the growing interest in the space sector in China.
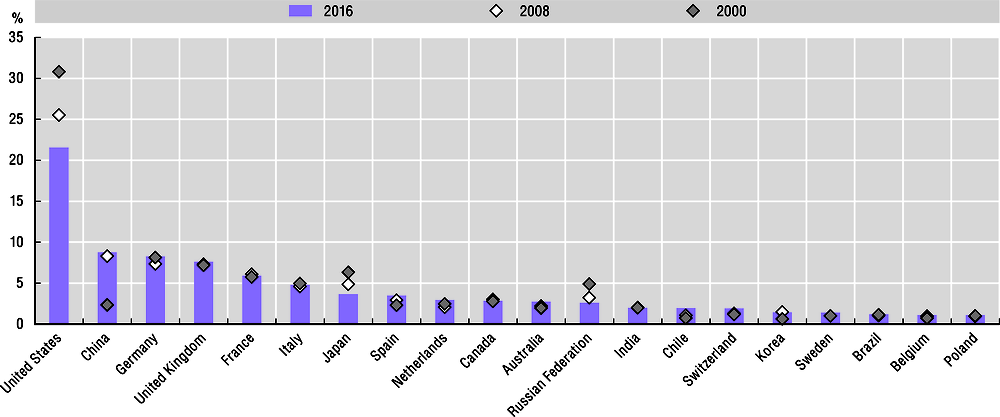
Source: OECD analysis based on Scopus Custom Data, Elsevier, 2018.
The number of space-related publications increased overall in the OECD area between 2000 and 2016, but the BRIICS economies saw a dramatic increase in their production, with the highest growth rates (Figure 1.12, Figure 1.13).
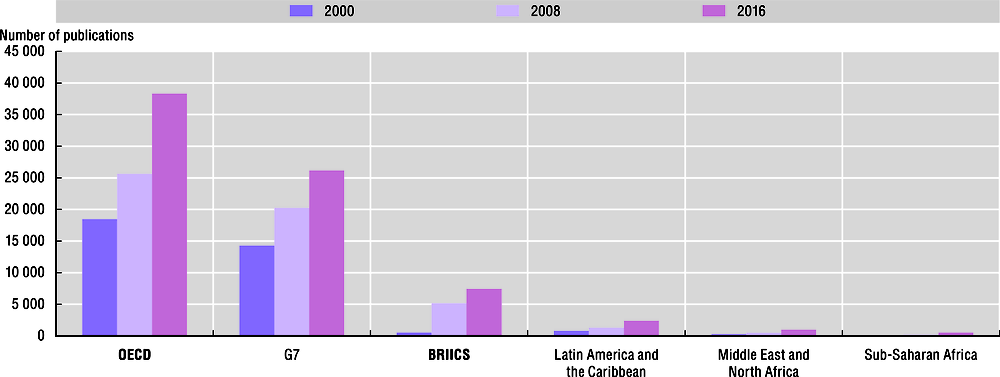
Source: OECD analysis based on Scopus Custom Data, Elsevier, 2018.
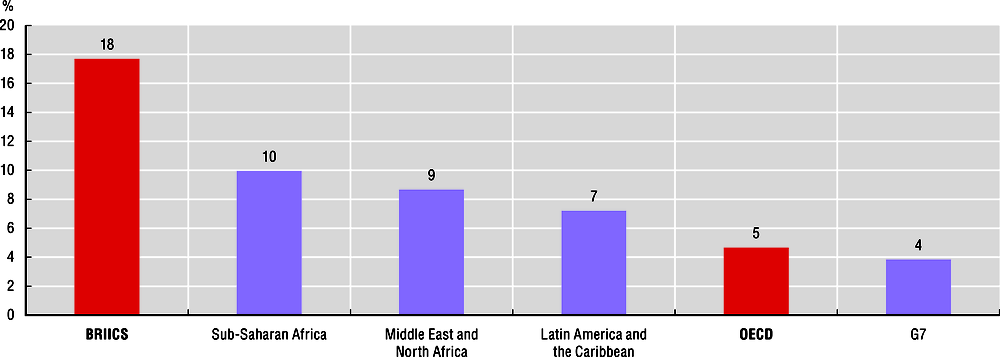
Source: OECD analysis based on Scopus Custom Data, Elsevier, 2018.
The volume of publications on selected “hot topics” (e.g. global positioning system, cubesats and small satellites) also grew significantly, with an increasing number of active countries. The number of countries publishing on subjects related to cube satellites multiplied by a factor of ten between 1999 and 2016, from 7 countries in the 1999-2004 period to 65 in 2011-16. For GPS, the increase was less marked, increasing from 121 countries in 1999-2004, to 159 in 2011-16. Finally, the number of countries publishing publications on small satellites grew from 45 in 1999-2001 to 75 in 2011-16.
As another proxy for innovation, patenting in the space sector is not as common as in other sectors, as commercial discretion and institutional confidentiality are often still priorities for some space systems. There are only a few hundred patents a year. Still, the number of space-related patents has almost quadrupled in 20 years, as revealed by the applications filed under the Patent Co-operation Treaty (PCT). The space application areas (i.e. satellite navigation, earth observation, telecommunications) have also gained in importance in a decade.
When comparing national patent applications for space-related technologies in 2002-05 and 2010-15, the United States still leads but its share has shrunk; while the European Union (EU28) grouping’s share has increased (Figure 1.14). Several countries have seen their shares of worldwide patents grow in relative terms, notably France, Korea, Germany, China, and Italy.
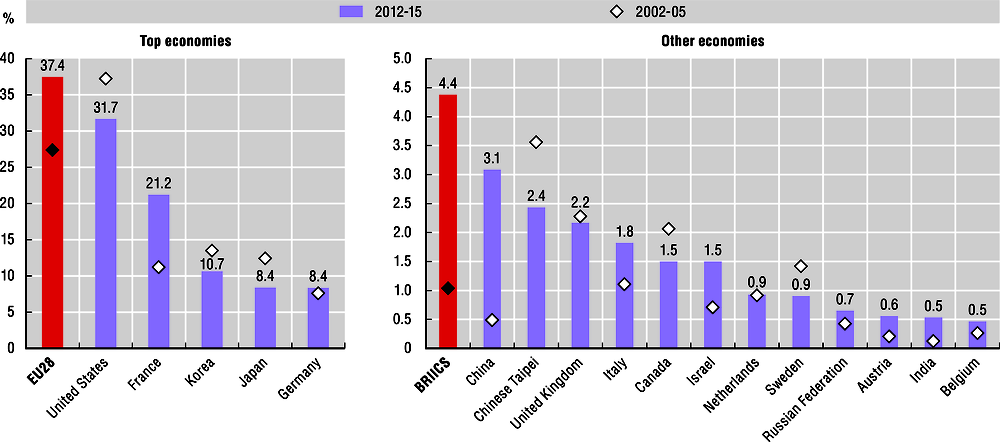
Source: OECD STI Micro-data lab: Intellectual Property Database, http://oe.cd/ipstats, March 2018.
When examining space-related patenting on a regional scale (Figure 1.15), the highest shares of patents can be found in a few selected regions, homes to significant space industry clusters. Around 16% of worldwide space patenting occurs in California (USA) (a decrease from 19% in 2002-05), Southern Kanto (JPN) (an increase from 1.6% in 2002-05), and 6% in Midi-Pyrénées (FRA) (an increase from 4.8% in in 2002-05). Other regions with relatively high rates of space-related patenting include Ile de France (FRA), Guangdong (CHN) and the Capital Region (KOR). Shenzhen, a large city in the Guangdong province, is increasingly labelled as the Chinese Silicon Valley, as it hosts many technology firms including public companies developing satellites and space applications.

Note: Data refers to patent applications filed under the Patent Cooperation Treaty (PCT), by inventor’s region at Territory Level 2 (TL2) and priority date.
Source: OECD STI Micro-data lab: Intellectual Property Database, http://oe.cd/ipstats, March 2018.
Overall between 2002-05 and 2012-15, several European and Asian regions have seen their patenting activities progress (Midi-Pyrénées, Southern Kanto, Capital Region in Korea), with strong growth in some cases (Ile de France, Guangdong, Niedersachsen, Hamburg, Aquitaine, Ontario).
The revealed technological advantage (RTA) is an index which provides an indication of the relative specialisation of a given country in selected technological domains. The RTA index in space technologies is calculated as the share of patents of a country in space-related technologies relative to the country’s share of total patents. Based on the analysis, eight countries demonstrate a level of specialisation in space technologies (Figure 1.16).
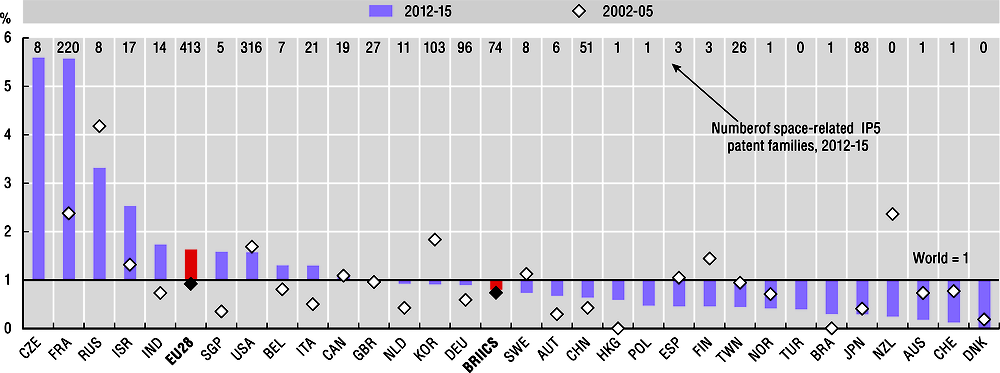
Note: The revealed technological advantage index is calculated as the share of patents of an economy in space-related technologies relative to the share of total patents belonging to the economy. Data refer to IP5 patent families, by priority date and the inventor’s residence using fractional counts. Space-related patents are defined on the basis of their International Patent Classification (IPC) codes. Figures are based on incomplete data from year 2014. Only economies with more than 500 patents in 2012-15 are included.
Source: OECD STI Micro-data lab: Intellectual Property Database, http://oe.cd/ipstats, March 2018.
The Czech Republic has taken the lead in this indicator for the first time, probably because of its investments in space programmes (particularly satellite navigation), and close links with European organisations. The country joined the European Space Agency in 2008, and its capital Prague is the home of the European Union’s European Global Navigation Satellite Systems Agency (GSA) since 2012. The GSA could become after 2021 the European Union’s “Agency for the Space Programme”, a new space agency running the European Union’s space programme. Following the Czech Republic, France, the Russian Federation, Israel, India and the European Union show a relatively large amount of patenting in space activities, compared to other economic sectors.
Policy advice to better assess and support a transformed space sector
The ongoing transformation of the space sector raises multiple issues for governments, in particular when it comes to enabling industry competitiveness, encourage further growth and innovation, and ensure some level of returns on investments of publicly-funded space programmes.
While the private sector has played an important role in space manufacturing in many OECD countries since the first space programmes of the 1950s and 60s, private actors are now increasingly leading the way in the use of innovative materials, technologies and processes. This reflects not only the digitalisation of the sector, innovative players, and technologies coming of age, but also strategic shifts in government policy and project management, focusing increasingly on commercialisation and industry partnerships.
Based on lessons learned from other economic sectors, two approaches could be pursued in order to better assess and enable the growth of space activities, while improving returns on public investments:
-
Increased government use of commercial services, via different procurement and co-funding mechanisms. Institutional space budgets still represent a key driver for commercial space activities, with public administrations already as funders or anchor tenants of many commercial space services. As capabilities from the private sector grow, government can make more extensive uses of commercial space services for increasingly sophisticated tasks.
-
Invest efforts in mapping national space economies, in co-operation with national statistical offices, industry associations and/or private contractors. All countries and firms have the opportunity to participate and benefit from the space sector’s global value chains. Governments that fund space programmes should better track who is doing what in the space industry and beyond, via regular industry surveys and analysis of existing administrative data. This includes mapping the many actors along the value chains in their national space economy.
As the space sector continues its transformation in the face of unrelenting digitalisation, as the next chapters will demonstrate, policymakers will play an important role in enabling the transition for public agencies as well as for existing firms, while at the same time fostering innovation and entrepreneurship. In order to reap the full benefits of existing and future space activities, and to ensure sustainable and equitable growth, targeted policy actions and further international cooperation will be certainly be required.
Many public organisations are in the process of reviewing their procedures for space R&D support and procurement, in order to make the best returns on investments. The schemes differ from country to country, but they aim to foster innovation, enable further private sector development, and reduce government costs; they include:
-
Setting up flexible procedures for procurement of commercial space products and services: Many space agencies and research agencies aim to simplify and accelerate access to funding and facilitate the participation of start-ups and SMEs, through open solicitations or calls, and e-tendering. Some agencies, such as the US Defense Advanced Research Projects Agency (DARPA), use new contract types to reduce companies’ administrative burden. Such contract types include, for instance, transaction authority agreements (OTAs) or Space Act Agreements in the United States and simplified contracts for R&D in Europe. DARPA has found that project funding could come through in as quickly as 2-3 months (using OTAs). Interestingly, established actors sometimes are more reluctant to change than the government agency and do not necessarily support the use of new procedures.
-
Co-funding arrangements for R&D and technology development (pre-commercial procurement), including different types of public-private partnerships (PPPs). These arrangements are increasingly popular among space agencies. The European Space Agency has a long history of using PPPs in satellite communications (e.g. ARTES programme) and is increasingly using them for larger projects (e.g. Ariane 6) with more applications possible in earth observation and space exploration. Programmes often require that the project participant or a third-party funder contribute 50% of the project cost, but the private sector share may be lower in low-TRL projects or when involving SMEs and start-ups. In the United States, private sector co-payment arrangements are often referred to as public-private partnerships. One recent example is partnerships created between NASA and industry in 2017 to ‘Advance Tipping Point Technologies’, totalling USD 17 million, where a minimum of 25% industry contribution is required (NASA, 2017[33]). NASA’s well-established Commercial Orbital Transportation Services (COTS) programme for developing commercial launchers and orbital capsules has also been key in supporting the development of recent new launchers. It already contributed to strengthening competition and diversifying the services on offer by increasing the number of private sector providers of US transportation services. In Italy, public-private partnerships will play a central role in the national Space Economy Strategic Plan, as one of the main instruments for space technology development in satellite telecommunications, Galileo, Copernicus and exploration.
-
Developing targeted R&D grants: R&D support programmes in the space sector are increasingly designed to contribute to other policy goals beyond technology development, such as promoting innovation in small and medium enterprises, enhancing collaboration among firms, fostering entrepreneurship, or university-industry collaboration (France Stratégie, 2016[34]). Space agencies play an important role in supporting domestic space manufacturing activities in a more globalised and competitive market, providing funding, facilities and guidance for the use of new technologies. One example is the German Space Components Initiative. This programme by the German Aerospace Space Centre uses a combination of R&D grants, brokering and marketing activities to support component development, production and sales and in this way increase the market share of German industry in off-the-shelf components for satellites (Feddeck and Fischer, 2016[35]).
References
[26] ASD - Eurospace (2018), The State of the European Space Industry in 2017, https://eurospace.org/.
[29] Bryce Space and Technology (2019), State of the Satellite Industry Report, Prepared for the Satellite Industry Association, Washington DC, USA, https://brycetech.com.
[19] Bryce Space and Technology (2017), Start-Up Space 2017: Update on Investments in Commercial Space Ventures, Bryce Space and Technology, Washington, DC, https://brycetech.com/reports.html (accessed on 22 May 2019).
[5] De Concini, A. and J. Toth (2019), The future of the European space sector, Report prepared by SpaceTec for the European Commission, European Investment Bank.
[6] Erwin, S. (2018), “Air Force is spending more on space, but modernization path still a big question - SpaceNews.com”, Space News March 16, 2018, https://spacenews.com/air-force-is-spending-more-on-space-but-modernization-path-still-a-big-question/ (accessed on 13 August 2018).
[20] ESA (2017), “500 new European companies from space”, Technology transfer website, 18 September, http://m.esa.int/Our_Activities/Space_Engineering_Technology/TTP2/500_new_European_companies_from_space (accessed on 14 June 2018).
[22] ESA BIC Bavaria (2018), Startups website, https://www.esa-bic.de/startup/ (accessed on 18 June 2018).
[12] EUMETSAT (2018), EUMETSAT Annual Report 2017, European Organisation for Meteorological Satellites, Darmstadt.
[31] European GNSS Agency (2017), The 2017 GNSS Market Report, Issue 5, Publications Office of the European Union, Luxembourg, May, https://doi.org/10.2878/0426.
[8] FAA (2018), The Annual Compendium of Commercial Space Transportation: 2018, Washington, DC, https://www.faa.gov/about/office_org/headquarters_offices/ast/media/2018_AST_Compendium.pdf (accessed on 22 May 2018).
[35] Feddeck, P. and H. Fischer (2016), “It’s the components, stupid! Fostering space commercialisation in Germany”, presentation at the OECD Space Forum Workshop: Innovation and Low-Cost Access to Space, 12-13 May, Paris.
[34] France Stratégie (2016), Quinze ans de politiques d’innovation en France, Commission nationale d’évaluation des politiques d’innovation, www.strategie.gouv.fr/publications/quinze-ans-de-politiques-dinnovation-france.
[17] FutureAerospace (2019), 2017-2018 Investment in China’s Commercial Space Sector, 未来宇航, Beijing, January.
[32] IATA (2018), “Industry Statistics: December 2018”, International Air Transport Association, https://www.iata.org/pressroom/facts_figures/fact_sheets/documents/fact-sheet-industry-facts.pdf (accessed on 22 May 2019).
[27] London Economics (2019), Size and Health of the UK Space Industry 2018, Report Commissioned by UK Space Agency, London., https://assets.publishing.service.gov.uk/government/uploads/system/uploads/attachment_data/file/774450/LE-SHUKSI_2018-SUMMARY_REPORT-FINAL-Issue4-S2C250119.pdf.
[7] Luxembourg Ministry of Finance (2017), Projet de Budget 2018: Volume I, https://budget.public.lu/content/dam/budget/lb/budget2018/links-dokumenter/minfinances-vol1-de-budget-2018.pdf (accessed on 13 August 2018).
[33] NASA (2017), NASA Establishes New Public-Private Partnerships, https://www.nasa.gov/press-release/nasa-establishes-new-public-private-partnerships-to-advance-us-commercial-space (accessed on 28 March 2017).
[13] OECD (2019), “Finance”, Main Economic Indicators (database), https://dx.doi.org/10.1787/data-00043-en (accessed on 26 April 2019).
[10] OECD (2018), “Main Science and Technology Indicators”, OECD Science, Technology and R&D Statistics (database), https://doi.org/10.1787/data-00182-en (accessed on 20 March 2018).
[14] OECD (2018), “Prices: Consumer prices, archive (Edition 2018)”, Main Economic Indicators (database), https://dx.doi.org/10.1787/data-00047-en (accessed on 26 April 2019).
[18] OECD (2018), “Private Equity Investment in Artificial Intelligence”, OECD Going Digital Policy Note, Vol. OECD, Paris., http://www.oecd.org/going-digital/ai/private-equity-investment-in-artificial-intelligence.pdf.
[25] OECD (2017), Getting Infrastructure Right: A framework for better governance, OECD Publishing, Paris, https://dx.doi.org/10.1787/9789264272453-en.
[1] OECD (2016), Space and Innovation, OECD Publishing, Paris, https://dx.doi.org/10.1787/9789264264014-en.
[28] OECD (2012), OECD Handbook on Measuring the Space Economy, OECD Publishing, Paris, https://dx.doi.org/10.1787/9789264169166-en.
[11] OECD (2010), Measuring innovation: a new perspective., OECD Publishing, Paris, https://doi.org/10.1787/9789264059474-en.
[21] O’Hare, S. (2017), “Commercialising space technology through start-ups at the ESA BIC Harwell”, presentation at the13th Appleton Space Conference, 7 December, Harwell, https://www.ralspace.stfc.ac.uk/Gallery/Commercialising%20Space%20Technology%20Through%20Start-ups%20at%20the%20ESA%20BIC%20Harwell.pdf (accessed on 18 June 2018).
[16] Seraphim Capital (2019), “Seraphim Global Space Index - 29% Year on Year Growth - January 2018 To December 2018”, https://seraphimcapital.co.uk/insight/news-insights/seraphim-global-space-index-29-year-year-growth-january-2018-december-2018 (accessed on 22 May 2019).
[15] Space Angels (2019), “Space Investment Quarterly: Q4 2018”, https://www.spaceangels.com/post/space-investment-quarterly-q4-2018 (accessed on 22 May 2019).
[9] Space Florida (2016), Space Florida: Financial Statements 2015-2016, http://spaceflorida.gov/docs/default-source/misc/2016-audited-financial-statements---space-florida.pdf?sfvrsn=2 (accessed on 28 April 2017).
[4] Space in Africa (2018), https://africanews.space
[24] St. Jean, D. (2018), “Commercial service providers and data openness”, presentation at the OECD Space Forum Workshop:The Transformation of the Space Industry: Linking Innovation and Procurement, 27 April, Paris.
[30] Tauri Group (2015), 2015 State of the Satellite Industry Report.
[2] UK Department for Transport (2017), Introduction of Space Industry Bill shows UK’s commitment to commercial spaceflight, News releases, https://www.gov.uk/government/news/introduction-of-space-industry-bill-shows-uks-commitment-to-commercial-spaceflight (accessed on 29 January 2018).
[3] UNOOSA (2019), Outer Space Objects Index, data extracted in March 2019, United Nations Office for Outer Space Affairs, http://www.unoosa.org/oosa/osoindex/index.jspx?lf_id= (accessed on 5 April 2019).
[23] US National Geospatial-Intelligence Agency (2018), “NGA signs CRADA with commercial imagery provider Planet”, Press releases website, 3 May, https://www.nga.mil/MediaRoom/PressReleases/Pages/Planet.aspx (accessed on 19 June 2018).