
1. Recent developments in international migration movements and labour market inclusion of immigrants
This chapter provides an overview of recent developments in international migration movements and labour market inclusion of immigrants in OECD countries. The first section analyses the evolution of international migration flows over the last decade, up to 2021. Both permanent and temporary migration flows by category of migration are covered. The chapter then examines recent trends in asylum requests in OECD countries. It then looks at the composition of migration flows and the foreign-born population, as well as trends in acquisition of nationality. The second section of the chapter examines trends in the labour market outcomes of immigrants over the past two decades, with particular attention to the economic crisis provoked by the pandemic. Detailed analysis by sociodemographic characteristics and region of origin is provided.
Migration trends
Permanent migration to OECD countries partially bounced back in 2021 after a record decrease in 2020 due to the COVID-19 crisis. OECD countries counted 4.8 million new permanent immigrants in 2021, a 22% increase relative to 2020 but still over half a million short of the 2019 level.
The increase in permanent migration flows is expected to continue in 2022 as OECD countries lift immigration and travel restrictions.
The United States remains the OECD country receiving the largest inflows of permanent immigrants in 2021 (834 000, 43% more than in 2020, but still 19% less than in 2019). Canada received a record inflow of over 400 000 new permanent migrants, more than double the inflow in 2020.
In the EU27, the upturn in permanent-type migration (+15%) was less pronounced. Free mobility was less affected by the pandemic but still fell by 17% in 2020. The estimated rebound in 2021 was modest (+4%).
The measures against COVID-19 have still severely affected migration flows to Australia, Japan, Korea and New Zealand in 2021.
Family migration increased by 39% in 2021 in the OECD and remained the largest category of inflows, accounting for more than a third of total permanent-type migration to the OECD. At 1.5 million new family migrants, this is however below the pre-COVID-19 level.
At nearly 600 000, family migration increased by 30% in the EU, returning to its 2017-19 average level.
Labour migration to OECD countries rebounded by 45% in 2021 and exceeded 750 000 workers, the highest level in a decade (19% of total permanent-type inflows). This was partly driven by the large increase in the United States, Canada, the United Kingdom and Italy (due to a regularisation programme in this latter country).
In the EU, permanent labour migration rose in line with family migration (+29% compared to 2020), to reach more than 300 000 new workers.
Permanent humanitarian migration to OECD countries rose slightly by 3% in 2021, after four consecutive years of decline. The main destination countries for humanitarian migrants were Germany followed closely by Canada (which registered a +136% increase). Significant declines were observed in a few countries such as Australia and New Zealand, the United Kingdom, the United States, and Spain.
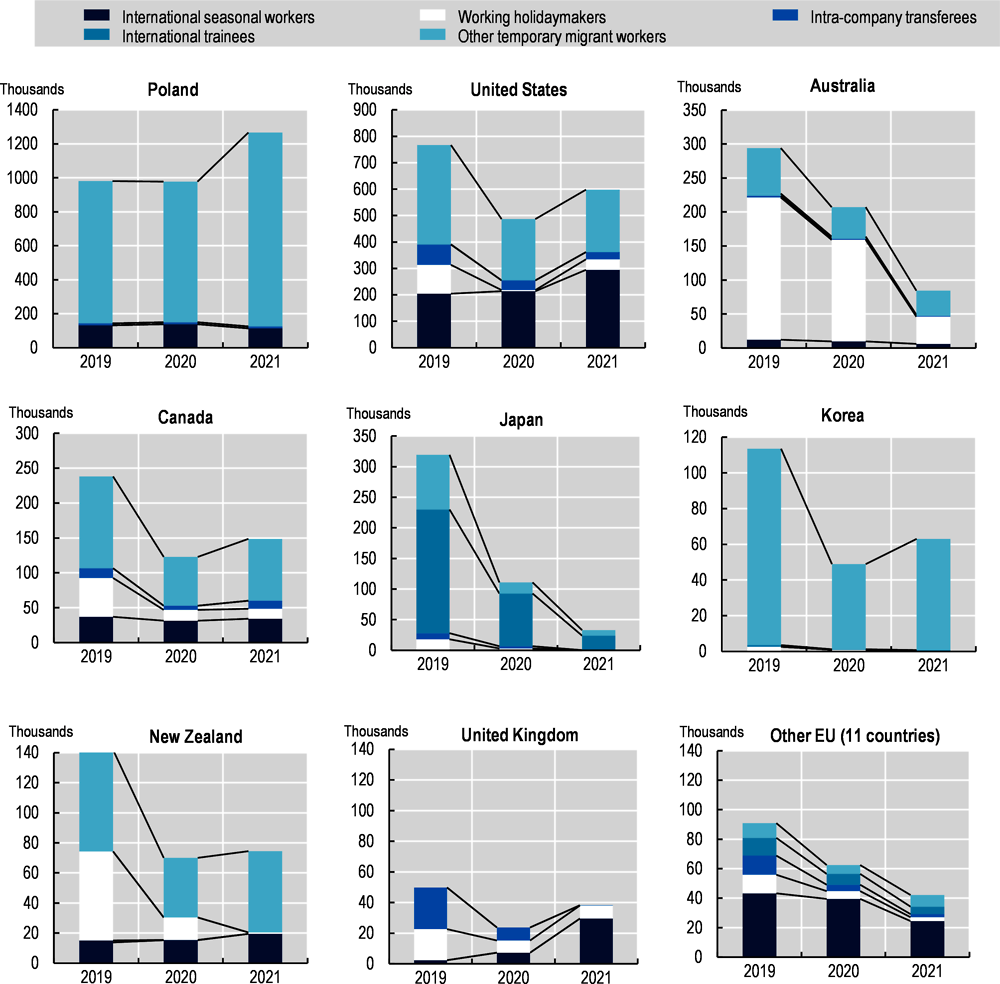
The recruitment of seasonal workers from abroad remained stable at around 460 000 in 2020 and increased by 18% in 2021, mostly driven by the United States, the United Kingdom and France.
Other types of temporary labour migration were more than halved in 2020 and decreased again in 2021.
The inflow of working holiday makers to the top 10 OECD receiving countries decreased by 59% in 2020 and then again by 47% in 2021.
Flows of international trainees decreased by 56% in 2020 in the top 4 OECD receiving countries and again by 69% in 2021. Japan remained the main receiving country despite low inflows (24 000 in 2021 compared with 202 000 in 2019).
Mobility within multinationals was sharply reduced as a result of the pandemic: intra-company transfers fell by 52% in 2020 and by 24% in 2021.
In 2020, almost 3.8 million postings were registered in the EU/EFTA, 19% less than the previous year. In Belgium, Germany, Luxembourg and Sweden, more than a quarter of posted workers were providing services in the construction sector. In Slovenia, posted workers sent abroad account for 30% of the construction sector workforce.
The number of new asylum seekers in OECD countries rebounded by 28% in 2021, to above 1 million. The main origin countries were Nicaragua, Afghanistan and Syria. In the EU, partial figures for 2022 show a further 21% increase compared to 2021.
Resettlement programmes were able to resume but only 57 000 people in need of international protection were transferred to an OECD country in 2021, around half the pre-COVID-19 average.
In 2020, two-thirds of OECD countries received more migrant men than women. The share of men among new migrants in OECD countries was 55.5%.
Despite the pandemic, the foreign-born population living in OECD countries continued to rise in 2021 and reached 138 million, 10.6% of the total population of OECD countries.
Countries where the share of the foreign-born population has increased the most since 2015 are Iceland (+8 percentage points), Luxembourg (+5 percentage points), Chile (+5 percentage points) and Sweden (+4 percentage points).
The COVID-19 pandemic and the resulting border closures led to a decrease in inflows from all top 20 countries of origin. China and India, the two top countries of origin in 2019, experienced the sharpest decrease in outflows to OECD countries.
According to preliminary and partial data, the number of acquisitions of citizenship in OECD countries in 2021 could be the highest ever recorded, at 2.3 million. This represents a 20% increase, partly due to a reduction in the backlogs of applications during the COVID-19 pandemic. Very strong increases have been registered in the United States (+30%), the United Kingdom (+46%), Canada (+22%), Norway (+109%) and Austria (+80%).
Labour market integration
Overall, labour market outcomes for immigrants worsened more compared to native-born in 2020 but bounced back more strongly in 2021 with the economic recovery.
Between 2020 and 2021, the employment rate of immigrants improved in over seven out of ten OECD countries. On average in 2021, almost 70% of immigrants were employed, and 9% were unemployed. In almost half of OECD countries, immigrants have returned to or exceeded their pre-crisis level of employment.
The health crisis caused, for the first time in a decade, an increase in the risk of long-term unemployment in some OECD countries, particularly among immigrants, who have a less developed professional network, poorer language skills, and a higher likelihood of being discriminated against.
The average number of hours worked by foreign-born persons in employment remains lower than the pre-crisis level.
The employment of young migrants increased in 2021 but remains on average below pre-crisis levels. The share of young migrants not in education, employment or training has decreased since 2020. Measures put in place by countries to support the labour market integration of young people have helped to mitigate the effects of the crisis.
The labour market performance of recently arrived immigrants improved more in 2021 compared to their longer-settled counterparts. Among other things, this may be the result of a decrease in the share of inflows of migrants with a weak labour market connection as well as an increase in outflows of recently arrived migrants who have lost their jobs.
Despite a significant improvement in the employment situation of immigrants from Africa and the Middle East since 2019, they remain the most disadvantaged group in most OECD countries.
Permanent-type migration to OECD countries partially bounced back in 2021
Permanent migration to OECD countries increased in 2021 relative to 2020 by approximately 22% and stood at 4.8 million (Figure 1.1). Despite this large increase, the inflow is lower than pre-COVID-19 pandemic permanent flows, which averaged 5.3 million between 2017 and 2019.
Permanent-type migration data presented in this section should be interpreted with caution. First, they should not be interpreted as new arrivals as they include not only new entries but also in-country changes of status from a temporary to a permanent status. The terms “permanent-type migration”, “permanent inflows/immigration”, and “admissions” refer to the same data and are used interchangeably. Border reopenings and the easing of travel restrictions tend to affect in-country transitions less, so these numbers are more stable. Therefore, the observed total increase in permanent flows reflects a larger increase in permanent immigration from abroad. Second, several OECD countries report their migration statistics using fiscal years which do not correspond with calendar years. This is the case for Australia, Ireland and the United States. As a result, the increase in migration flows in calendar year 2021 is only partially reflected in the 2021 national migration statistics for these countries. In this section, however, US data have been adjusted to refer to calendar year from 2019 on.
Third, OECD permanent-type migration includes estimates of migration within free-circulation areas and therefore are not comparable to the total number of new issuances of residence permits.

Note: Sum of standardised and unstandardised figures (refer to Table 1.1, not including Colombia, Costa Rica and Türkiye), including status changes and migration within free-circulation areas. 2021 data are partly estimated based on growth rates published in official national statistics.
Source: OECD International Migration Database (available upon request).
The 2021 rebound was largely driven by permanent-type migration to major receiving countries such as the United States (+43%), Canada (+117%), Spain (+13%), the United Kingdom (+51%), France (+16%), Italy (+82%) as well as Poland (+37%). The United States remains the OECD country receiving the largest inflows of permanent immigrants in 2021 although inflows were 19% below their pre-pandemic level (Table 1.1).
Canada received a record inflow of over 400 000 new permanent migrants, more than double the inflow in 2020. This makes Canada the third largest receiving country after the United States and Germany. In this latter country, permanent flows remained relatively stable. The unprecedented increased admissions in Canada aim at offsetting the shortfall of 150 000 new permanent residents in 2020 due to the COVID-19 pandemic and at filling critical labour market gaps. The 2022-24 Immigration Levels Plan aims to continue welcoming immigrants at a rate of about 1% of Canada’s population, including 431 645 permanent residents in 2022, 447 055 in 2023, and 451 000 in 2024.
Permanent flows rebounded in 2021 in all other OECD countries, with some notable exceptions. The measures against COVID-19 have still severely affected migration flows to Australia, Japan, Korea and New Zealand. Permanent inflows to Australia remained at a similar level in 2021 as in 2020 (fiscal years). In Japan, after continuous growth through 2013-19, the inflow of permanent migrants decreased again in 2021, to 53 400, approximately 40% of the 2019 level. Permanent migration flows to Chile and Colombia continued to decrease. In contrast, permanent migration to Mexico increased again in 2021 (+25% year on year) to a new record level, following a sharp rise in humanitarian admissions.
Permanent flows to the European Union countries increased by 15% in 2021 to 2.1 million. All EU countries experienced an increase in permanent inflows with the exception of Portugal and Ireland. In Italy and Poland, 2021 permanent migration flows were higher than in 2019, largely due to new admissions of immigrant workers – in the case of Italy through a regularisation programme (see comments below and in the country note). Several other Eastern European countries experienced large increases in permanent flows. This is the case of the Slovak (+57%) and the Czech (+29%) Republics, and the Baltic States with the exception of Lithuania, and Hungary (+12%).
In the United Kingdom, new permanent-type migration increased by half to 338 000. New programmes for highly skilled migrants (notably health and care workers) as well as flows from the EU and from Hong Kong (China), largely contributed to boost permanent-type migration back to its pre-COVID19 level.
In 2021, OECD countries received on average four new migrants per thousand inhabitants (Figure 1.2). In nearly six in ten OECD countries, the 2021 ratio is higher than the one for the 2012-20 period. The difference is particularly sharp in several Eastern European and Baltic countries, and in Canada. In Norway and Sweden, Australia and New Zealand, as well as Chile and Colombia, this ratio has declined between 2012-20 and 2021.

OECD countries received around 1.8 million family migrants in 2021, 40% more than in 2020, but slightly less than pre-COVID-19 (Figure 1.3). Family migration is still the largest category of inflows to OECD countries and accounts for a higher share of the total (43%) compared to 2020 (38%). With more than 610 000 admissions, family migration increased by 30% in the EU, returning to its 2017-19 average level.
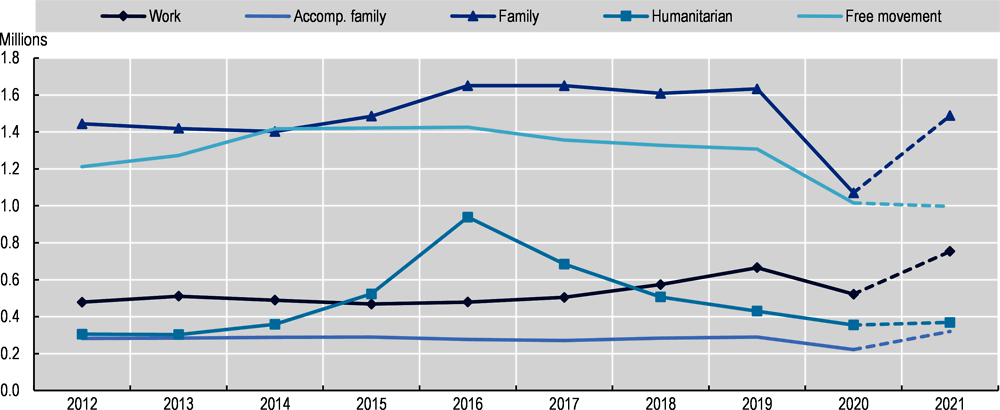
The United States is the main OECD destination country for family migrants, with an inflow of 532 000 in 2021 (+50%). However, the share of the United States in overall family migration to the OECD went down from 43% in 2019 to 38% in 2021, since family migration increased in a number of other important destination countries. In Italy, family migration nearly doubled in 2021, to 120 000 new migrants, above the 2019 level. The United Kingdom also contributed to the rebound with 105 000 family migrants in 2021, including 59 000 permits delivered under the EU Settlement family Scheme. This is the highest level ever registered, and a 62% increase compared with 2020. Canada saw a similar increase of family migration flows (+64% to 80 000) and recovered pre-COVID-19 levels. The other major increase concerned Australia, which delivered 81% more family visas in 2021 than in 2020. Japan and Korea, in the context of strict travel limitations, together with Portugal and Denmark, are among the few OECD countries where family migration decreased in 2021.
Labour migration to OECD countries rebounded by 45% in 2021 and exceeded 750 000 workers, the highest level in a decade. This was largely driven by Canada where permanent labour migration flows tripled in 2021 to 170 000 and Italy where the increase in labour migration was due to the inclusion of regularised migrants. Several other countries received historically high numbers of permanent migrant workers, in particular the United States (103 000, +60%) and the United Kingdom (82 000, +103%). Overall, permanent labour migration in the EU kept pace with family migration, with more than 300 000 new workers (+29% compared to 2020).
Labour migration to Japan was continuously rising until 2019, but fell by 40% in 2021. Australia, New Zealand, Spain and Sweden also showed declines in labour migration.

Note: Includes only countries for which data on standardised permanent-type migration are available (refer to Table 1.1).
Source: OECD International Migration Database (data available upon request).
Despite being relatively less affected by the COVID-19 pandemic, migration within free-circulation areas nevertheless decreased by 22% in 2020 and by an additional 2% in 2021. The 2021 trend is mainly driven by the end of free circulation between the EU and the United Kingdom due to Brexit, and by the sharp decrease registered over the 2021 fiscal year in Australia. In the EU27, the estimated rebound in 2021 was modest (+4%) and this migration category represented 24% of all permanent flows in 2021 (Figure 1.4). In Germany and in Switzerland, these migration movements declined slightly (by 1% and 3%, respectively), but selected destination countries, such as Spain, Denmark, Sweden and Finland, registered double-digit increases.
Permanent humanitarian migration to OECD countries rose by 3% in 2021, after four consecutive years of decline. The main destination countries for humanitarian migrants were Germany followed very closely by Canada, which registered a +136% increase. Many other major destination countries received more humanitarian migrants in 2021 than in 2020, and the increase was higher than 70% in Italy, Austria, Belgium, Denmark and the Netherlands. The latter was among the few countries where refugee inflows did not drop in 2020. Declines were observed in 2021 in Australia and New Zealand, the United Kingdom, the United States and Spain.
Temporary worker migration has not returned to its pre-COVID-19 level
Inflow of international seasonal workers remained stable during the pandemic
International seasonal workers meet temporary labour needs, especially in agriculture and tourism, but also in construction, care and the agri-food industry, depending on the national programmes in place. Within the EU/EFTA, labour needs are largely met through free movement, but, in the past few years, EU countries have also signed bilateral agreements on seasonal worker recruitment, for example between Germany and Georgia in 2020. Following Brexit, the United Kingdom suffered a shortage of seasonal agriculture and horticulture workers and launched a new Seasonal Workers Pilot in 2019.
The COVID-19 pandemic and the ensuing partial closure of national borders and various lockdown measures barely stopped the recruitment of seasonal workers from abroad, primarily for harvesting activities in OECD countries. In 2020, inflows remained stable at around 460 000. Other types of temporary labour migration more than halved (Annex Table 1.A.2).
In 2021, seasonal worker flows increased by 18%, mostly driven by the United States (+38%), Canada (+10%), the United Kingdom (+11%), New Zealand (+27%) and France (+160%). Poland ranked second as a country of destination for seasonal migrants in 2021, despite a 17% decrease in seasonal flows. This drop is due to a change in the legislation: foreign workers granted access to the Polish labour market after 13 March 2020 no longer need a seasonal work permit to work in seasonal jobs.
Other types of temporary labour migration were significantly impacted by the pandemic
Working holidaymaker programmes help meet low-skilled labour needs mainly in tourism and agriculture. During the COVID-19 pandemic, many receiving countries suspended or reduced these mostly bilateral schemes. The inflow of working holiday makers to the top 10 OECD receiving countries decreased by 59% in 2020 and then again by 47% in 2021. Through these programmes, a total of 106 000 young workers arrived in OECD countries in 2021, four times fewer than in 2019.
In 2021, the decrease in the number of working holiday makers was due to a sharp drop in top receiving countries such as Australia (-73%) and New Zealand (-94%). In most other countries, flows rebounded without however reaching their pre-COVID-19 level (Annex Table 1.A.2). The United States became the most popular destination country for working holidaymakers in 2021, when around 40 000 youth participated in the Summer Work Travel Program. This is less than half of the participants in 2019 (108 000).
Flows of international trainees also continued to decrease sharply in 2021. This trend is driven by the decrease in migration to Japan, the main country of destination for trainees in OECD countries. The inflow of trainees to Japan decreased from 200 000 in 2019 to 86 000 in 2020 and 24 000 in 2021 (Annex Table 1.A.2).
There has also been a marked reduction in mobility within multinationals as a result of the pandemic: intra-company transfers fell by 52% in 2020 and by 24% in 2021. The sole exceptions are Poland, which received 11 to 13 000 ICTs each year since 2019, and Canada, where inflows of ICTs bounced back to their pre-COVID-19 level.
Note: Other EU include Austria, Belgium, Germany, Denmark, Spain, Finland, France, Ireland, Italy, Luxembourg and Sweden.
Source: OECD International Migration Database, https://doi.org/10.1787/data-00342-en.
Other national programmes exist for recruiting foreign workers (Figure 1.5). Poland, for example, has signed bilateral simplified recruitment programmes with Armenia, Belarus, Georgia, Moldova and Ukraine. The great majority of workers employed in Poland under the simplified procedure, in particular in manufacturing, construction and agriculture, as well as administrative services, come from Ukraine. For three years running, Polish employers recruited at least 1 million workers per year other than seasonal or ICTs (refer to Annex Table 1.A.3 for details on categories included), and these flows were not greatly affected by the pandemic. Conversely, all other OECD countries registered a sharp reduction in their temporary labour migration. New recruitments continued falling sharply in Australia and Japan in 2021 due to continuing border restrictions (Figure 1.5).
Contrasting trends in the number of worker postings within the OECD-Europe area in 2020
Inside the European OECD countries, posted workers are defined as salaried or self-employed workers who generally carry out their activity in another member country while staying affiliated to the social security system in their home country. When workers are posted in one single country, the posting cannot exceed 24 months (EC No 987/2009 Article 12), whereas there is no time limit for workers posted in two or more countries (EC No 987/2009 Article 13). Stricter enforcement as well as a better understanding of the rules by the employers contributed to a growing trend in reported worker postings over the past years.
COVID-19 temporarily reversed 15 years of continuous growth in postings, although the 2020 level was still higher than the number of postings any year prior to 2018. In 2020, almost 3.8 million postings were registered in OECD-Europe, 19% less than the previous year.
The bulk of postings (2.4 million out of 3.8 million in 2020) fall under Article 12 of the Regulation and take place in a single other member country. They may not exceed 24 months, and, on average, lasted 100 days (shorter than the average of 115 days in 2019). They concerned around 1.4 million workers who were sent abroad 1.7 times per year on average. In 2020, the total number of Article 12 postings issued by EU/EFTA fell sharply by 23%. The main receiving country remained Germany despite a 19% decrease. The Netherlands jumped as the second receiving country with a 78% increase in postings (mainly due to German workers). France, Austria and Switzerland follow, despite a 28 to 32% loss in Article 12 postings compared with the 2019 numbers (Table 1.2).
For all other postings, only the country of origin is known, as they either take place within at least two destination countries (Article 13), as is the case for 1.2 million postings (-8.8% compared to 2019), or are governed by multilateral agreements (Article 16), for 18 400 postings in 2020. Despite an overall decrease in Article 13 postings in 2020, the main origin countries issued more Article 13 posting notifications in 2020 than in 2019 (Poland: 400 000, +3%; Germany: 115 000, +28%), mainly due to the demand in road freight transport which accounts for nearly one in two postings. This type of posting is not limited in time but, on average, lasts 300 days.
In 2020, two-thirds of Article 12 (single country) postings were issued to provide services in the industry and one-third in services (half in the financial and insurance sectors, half in the education, health and social sectors). Agriculture accounted for less than 1% of total Article 12 postings. A quarter of Article 12 postings were in the construction sector. The sectoral distribution varies widely across destination countries: in Germany, nearly half of posted workers were employed in services, and construction accounted only for 7% of total notifications issued. Conversely, more than half of postings were granted to the construction sector in Romania, Slovenia and the Slovak Republic. Interestingly, more than 20% of postings issued by Belgium, Luxembourg and the Netherlands were granted to temporary employment agencies.
Looking at the sectoral distribution from the perspective of receiving countries, it is noteworthy that in Belgium, Germany, Luxembourg and Sweden, more than a quarter of posted workers were providing services in the construction sector. In Belgium, France and the Netherlands, a relatively high share were employed by a temporary employment agency.
Although the share of postings in total employment is modest (1% or 0.4% in full-time equivalent), the impact on the labour market can be significant in some countries and sectors. For instance, in Slovenia, posted workers sent abroad account for 30% of the workforce in the construction sector. In Croatia, Luxembourg, and the Slovak Republic, the corresponding share is as high as 11 to 13%.
Shifts in origin and destination of asylum seekers
A strong rebound in asylum seeking, but not up to pre-COVID-19 levels
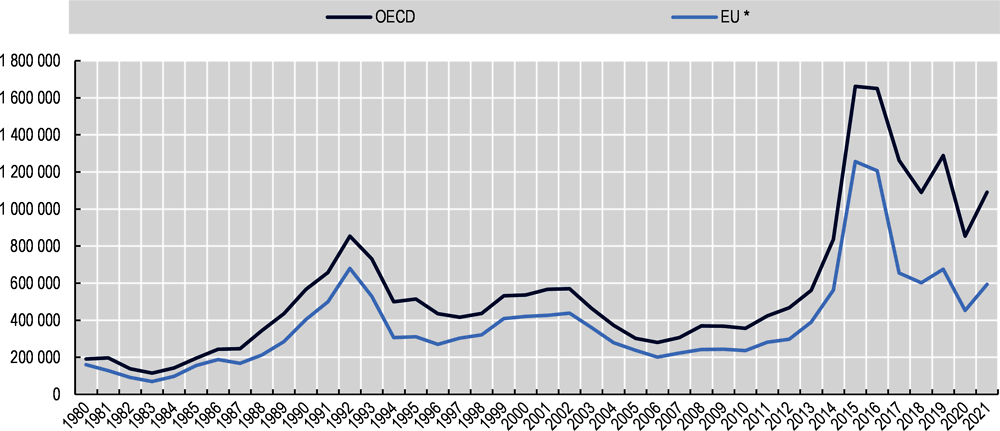
The number of new asylum seekers to OECD countries rebounded by 28% in 2021, to above 1 million (Figure 1.6). Although this is still below the pre-COVID-19 levels, it still exceeds any figure prior to 2015. In the EU, the rise was even sharper (31% to almost 600 000), and partial figures for 2022 show a further 21% increase compared to 2021.
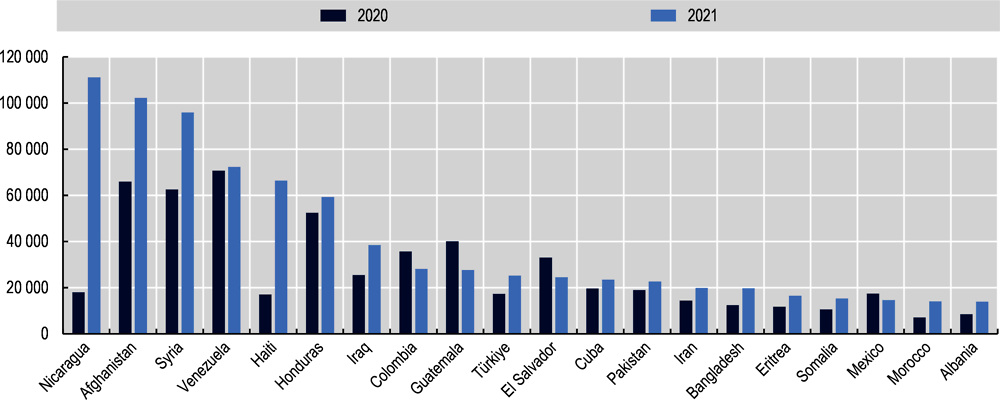
Five OECD countries registered more than 100 000 new asylum applications in 2021. This happened only once before, in 2015. The United States received about 190 000 new asylum applications in 2021, 26% less than in 2020, and 37% less than in 2019. Nevertheless, it remained the main OECD destination country of asylum seekers for the fifth consecutive year (Table 1.3). Citizens from Venezuela accounted for more than 14% of the total and 15% more (27 000) applied for asylum in the United States in 2021 than in 2020. Guatemala, Honduras and El Salvador follow with respectively 23 000, 20 000 and 15 000 new asylum requests. However, these three countries saw a sharp fall, more than third, in comparison to 2020. 13 000 Cuban nationals applied for asylum in 2021, up 35% from 9 500 in 2020. Colombia (11 200) and Haiti (10 000) are the other main origin countries which saw increases. Overall, more than 70% of all asylum seekers in the United States are from Latin America and Caribbean countries.
Germany, second to the United States since 2017, received almost 150 000 new asylum applications in 2021. This represents a surge of about 45% led by asylum requests of citizens of Syria (55 000, +50%), Afghanistan (23 000, +135%) and Iraq (16 000, +58%). Mexico, which prior to 2016 did not appear among the top half of OECD countries in terms of new asylum requests, was third in 2021. Mexico received more than 130 000 applications in 2021, three times more than in 2020. 52 000 of these, or 40%, were Haitian nationals, and 36 000 came from Honduras. Costa Rica follows, confirming the upsurge of the demand for international protection across Central and South America. More than 100 000 of the asylum seekers received by Costa Rica in 2021 came from neighbouring Nicaragua. The number of new asylum applications filed in France reached 104 000 in 2021 (+27%). Countries of origin of asylum seekers in France are relatively diversified as, in addition to the 16 000 requests coming from Afghans, France received more than 3 000 asylum seekers from ten different countries. 62 000 new asylum requests were submitted in Spain (-28%), 56 000 in the United Kingdom (+57%), 44 000 in Italy (+106%) and 37 000 in Austria (+174%).
For the OECD as a whole, the ratio of new asylum seekers to the total population stood at 792 per million in 2021. Costa Rica remains by far the OECD country with the highest ratio (21 000 per million). According to the UNHCR, in March 2022, Nicaraguan refugees and asylum seekers represented 3% of Costa Rica’s population. Austria follows with 4 000, and Greece, Iceland, Luxembourg and Slovenia all received more than 2 000 asylum seekers per million inhabitants. Sweden, which was in the top three until 2019, ranked 16th in 2021 with a ratio of 1 000. Fifteen of the top 20 countries of origin of asylum seekers in 2021 were already in this list in 2019, before the COVID-19 pandemic spread across the world. Countries from Latin America and the Caribbean are found at both extreme of the scale in terms of evolution between 2020 and 2021 (Figure 1.7).
On the one hand, Colombia, Guatemala, El Salvador and Mexico are the only origin countries which saw fewer of their citizens seeking asylum in OECD countries in 2021 than in 2020. On the other hand, the largest increases in new applications are observed for nationals of Nicaragua and Haiti. More than 110 000 Nicaraguans applied for asylum in OECD countries in 2021, six times more than in 2020, and 66 000 Haitians, a fourfold increase. The number of asylum seekers from Afghanistan rose by 55% and exceeded 100 000 for the first time since 2017. 95 000 Syrians submitted an asylum application in an OECD country (+53%), still far from the 2015 and 2016 levels but representing 0.6% of the Syrian population. The number of requests from citizens of Iraq also increased by more than 50% to 39 000. With only 10 000 applications from its citizens, China ranked only 24th in 2021.
Source: UNHCR, Eurostat.
After the very sharp drop in 2020, grants of international protection increased by 3% overall in 2021 (Table 1.4), with large variations across destination countries. Indeed, while the number of new refugees more than doubled in Canada to over 60 000, and rebounded by 40% or more in France (+65% to 51 000), Italy (+45% to 31 000), Austria (+45% to 18 800), the Netherlands (+44% to 14 600), Belgium (+74% to 10 700), it fell by 50% or more in Australia, Greece and Spain. Germany remained the main country of new grants for international protection in 2021 with almost 100 000 positive decisions (4%).
Among other countries with over 10 000 new permanent humanitarian migrants, numbers went up in Mexico (+13%) and in Sweden (+4%) and decreased in the United States (-12%), the United Kingdom (-20%) and Switzerland (-7%). In Poland, the number of positive decisions almost reached 3 000, eight times more than in 2020, and the most since data was collection began.
At the regional level, European OECD countries altogether delivered 325 000 positive decisions of international protection in 2021. This is 2% less than in 2020, but only 8% below the 2019 level. Non-European OECD countries, despite a +17% increase to 145 000 grants, are still 22% under the 2019 figure.
Resettlement programmes are designed to transfer the most vulnerable refugees from a country of first asylum to another one which grants them protection. On average, since 1981, 106 000 refugees per year have benefited from resettlement to OECD countries. During the worst of the pandemic, transfers could not take place, so these programmes came to a halt. They were able to resume in 2021 but despite a 67% jump, only 57 000 people in need of international protection were transferred to an OECD country, around half the pre-COVID-19 average.

Note: Some data presented may differ from statistics published previously due to retroactive changes or the inclusion of previously unavailable data. More information about UNHCR’s resettlement programme can be found at http://www.unhcr.org/resettlement.html.
Source: UNHCR.
In 2021, Canada was back on top of the main resettlement countries, with more than 20 000 refugees received through this channel, more than a third of the total. This is also more than double the 2020 figure for Canada. The United States followed with 13 700 resettlement arrivals (+43%). Sweden registered 6 700 resettlements in 2021, twice as many as in the previous year and more than in any year before, and became the third resettlement country. Following the same pattern, Norway received a very high number of resettled refugees in 2021 (3 600, +138%). Australia, where travel restrictions were particularly severe and lasted all of 2021, is the only large destination country which saw a drop in 2021 (-9% to 3 300 resettlements) and was only the fifth main destination country, while it was regularly third in previous years.
China and India start to lose their lead as main origin countries
The COVID-19 pandemic and the resulting border closures led to a decrease in inflows from all top 20 countries of origin (Figure 1.9). This was due to lockdowns in the countries of origin as well as travel restrictions in both countries of origin and countries of destination. China and India, the two top countries of origin in 2019, experienced the sharpest decrease in outflows to OECD countries. In 2020, China and India each represented 5% of all migration flows to OECD countries, compared with 7% and 6% in 2019.
China lost the lead as largest sending country to the OECD to India. The inflow of immigrants from China dropped by more than 50% relative to 2019 to just over 230 000. This represents the lowest inflow of Chinese immigrants to OECD countries since 2000. The inflow of Chinese immigrants decreased by three-quarters to New Zealand and by two-thirds to Japan.
Migrant inflows from India decreased by 41% year on year, to approximately 230 000. The number of Indians received by the main destination countries, Canada and the United Kingdom, halved in 2020, and decreased sharply also in Germany (-44%).

Note: Migration flows to Colombia, Greece and Ireland are not included. Migration flow series to Germany and Korea are adjusted to exclude short-term immigrants. 2020 migration flow data to Türkiye and the United Kingdom are estimated.
Source: OECD International Migration Database, https://doi.org/10.1787/data-00342-en.
Romania is a close third in the top countries of origin with 223 000 new entries to OECD countries. The decrease in inflows for Romania was small relative to the decrease from China or India (-23%). In particular, the flow of Romanians to Germany, their main country of destination, remained close to 100 000, having decreased only by 11% from 2019 to 2020.
Ukraine displayed a small decline in outflows in 2020 (-12%) and consolidated its position as the fourth country of origin. From 2017 to 2019, inflows to OECD countries from Ukraine increased by more than 40%. Almost 200 000 Ukrainians immigrated to OECD countries in 2020, 55% of them to Poland. Migration flows from Ukraine to Poland remained at a similar level in 2020 relative to 2019 (+2.4%).
Emigration from Venezuela to OECD countries dropped by 37% in 2020 but remained higher than in any year prior to 2019. Other significant drops in flows in 2020 include the sharp decrease of migration from the Philippines, mainly to Canada, and from Cuba, mainly to the United States. Among the top 50 countries of origin, only the Slovak Republic showed an increase in 2020 (+13%), led by a surge in outflows to Hungary (6 000).
Size and composition of foreign-born populations in OECD countries
Foreign-born population continued to rise during the pandemic
Despite the pandemic, the foreign-born population living in OECD countries continued to rise in 2021. The foreign-born population reached 138 million, which represents 10.6% of the total population of OECD countries.
The United States is the main country of residence of immigrants in OECD countries, hosting almost a third of the immigrant population. While the foreign-born population in the United States had plateaued since 2018, it increased from 2020 to 2021, reaching almost 45 million by January 2021. Germany ranks second, hosting almost 14 million immigrants, and the United Kingdom ranks third, with over 9 million foreign-born residents.
Almost half of the foreign-born population in the OECD lives in Europe. EU OECD countries host 37% of the total foreign-born population, and other European OECD countries account for another 10%. A fifth of the foreign-born population lives in a country outside the United States and Europe, mainly in Canada (6%), Australia (5%), Türkiye (2%) and Japan (2%).

Note: Japanese and Korean data refer to the foreign population.
Source: OECD International Migration Database, https://doi.org/10.1787/data-00342-en.
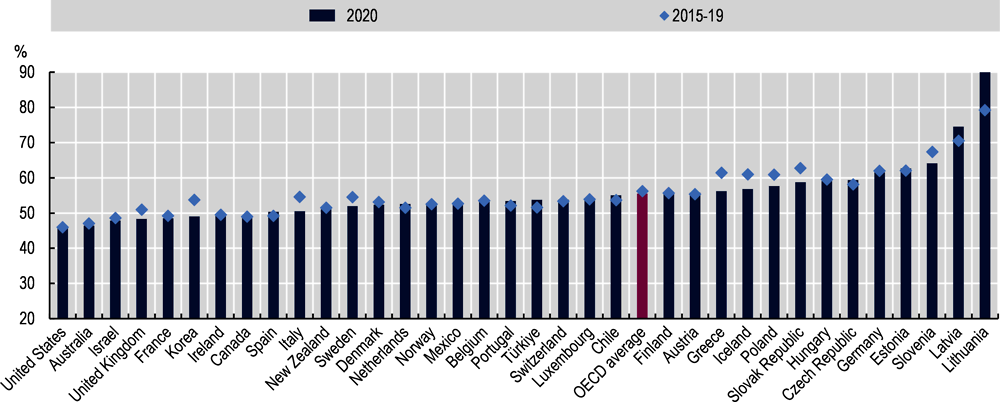
Between 2015 and 2021, the share of immigrants in the population increased in almost all OECD countries. The average share was 14.3% in 2021, up from 12.6% in 2015.
In 2021, the foreign-born population represented 20% or more of the total population in nine OECD countries. These are Luxembourg (48%), Switzerland (30%), the settlement countries – Australia (29%), New Zealand (27%) and Canada (21%) – as well as Israel, Austria and Sweden (20%).
The countries with the largest increases since 2015 in the share of the population that is foreign-born are Iceland (+8 percentage points), Luxembourg (+5 percentage points) and Chile (+5 percentage points). The increase in the share of the foreign-born population in Luxembourg follows a longer-term trend. The share of immigrants in the population in Chile tripled in this period, driven partly by the recent arrival of Venezuelans, who now account for a third of the foreign-born population.
The immigrant population increased also significantly in Sweden (+3.7 percentage points) and Germany (+2.9 percentage points), partly due to humanitarian inflows in the mid-2010s. Other countries with a significant increase in the share of immigrants in this period are Austria, New Zealand, Portugal and Spain, with increases close to 3 percentage points.

Note: Data refer to 2015, or closest available year, and to 2021, or most recent available year. The OECD average is a simple average of the rates presented in this figure. For Japan and Korea, the data refer to the foreign population rather than the foreign-born population.
Source: OECD International Migration Database, Eurostat, UNDESA.
Men still account for more than half of migration flows but their share decreased in 2020
In 2020, two-thirds of OECD countries received more migrant men than women. However, the average share of men among new migrants to OECD countries declined and stood at 55.5%, compared with 56.2% over the preceding five-year period.
The gender composition of migrants differs across countries and is partly driven by the composition of migration inflows. Countries with a large share of men among new immigrants are typically countries with relatively large labour migration inflows, such as countries in Central and Eastern Europe and Korea. The United States remained the country with the lowest share of men in its migrant inflows in 2020 (46.2%).
Several countries saw significant declines in the share of men in migration flows. In Slovenia, men represented 64.1% of migration flows in 2020, 3.3 percentage points below the 2015-20 average. In the Slovak Republic, Poland and Iceland the drop stood between 2 and 4 points, and reached 5 points in Greece, which registered the sharpest decline. Among countries with relatively low percentages of men among new immigrants, the largest decline was seen in Korea with 5 points compared to 2015-20, with women now a majority of Korea’s inflows (50.9%). Flows to the United Kingdom also comprised fewer men than women in 2020 (48.3% of men, – 2.7 points). In Latvia, on the other hand, the already high proportion of men increased in 2020 to almost 75%.
Note: The OECD average is the average of the countries featured in the figure above. For Chile, data refer to 2016 instead of 2020, for Canada, Mexico, Türkiye and the United Kingdom, data refer to 2019 instead of 2020.
Source: OECD International Migration Database, https://doi.org/10.1787/data-00342-en.
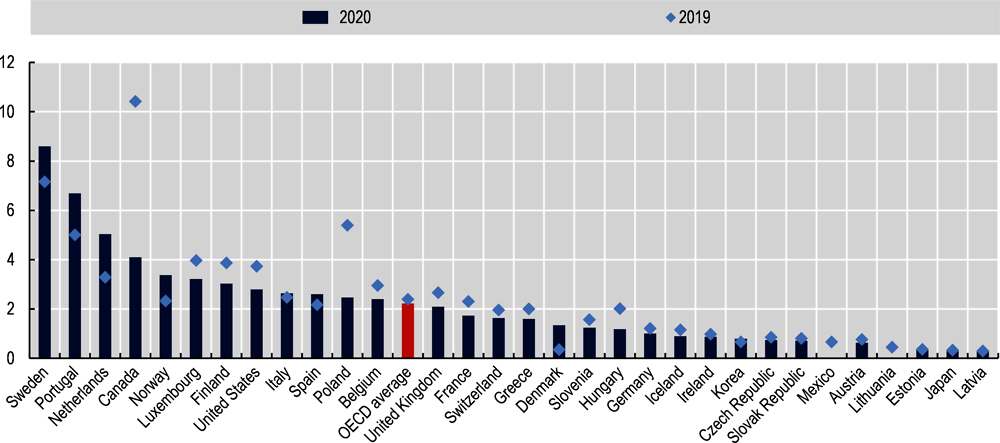
Record acquisitions of citizenship in OECD countries in 2021
According to preliminary and partial data, the number of acquisitions of citizenship in OECD countries in 2021 could be the highest ever recorded, at 2.3 million (Figure 1.13). This represents a 20% increase, partly due to a processing of backlogged applications during the COVID-19 pandemic.

Note: The estimation for 2021 is based on preliminary data for 17 OECD countries accounting for 87% of the 2020 total.
Source: OECD International Migration database, https://doi.org/10.1787/data-00342-en.
Among countries for which 2021 data are available, strong increases have been registered in the United States (+186 000, +30%), the United Kingdom (+60 000, +46%), Canada (+24 000, +22%), in Norway – where citizenship acquisitions more than doubled (+21 000, +109%) – and in Austria (+7 000, +80%). Surprisingly, some countries saw declines in naturalisation numbers in 2021. This is the case of Luxembourg (-26%) and Finland (-15%), both countries where naturalisations have been declining for several years, and of Denmark (-8%), which had seen a high level in 2019.
Note: The OECD average is the average of the countries featured in the figure above.
Source: OECD International Migration Database, https://doi.org/10.1787/data-00342-en.
Among OECD countries, on average, 2.2% of the foreign population acquired host-country citizenship in 2020 (Figure 1.14). This is a similar share as in 2019.
In 2020, Sweden again became the OECD country in which the largest share of foreigners acquired host country nationality. Almost 9% of its foreign residents became Swedish citizens, substantially more than in 2019. Portugal and the Netherlands followed with respectively 6.7% and 5%, each representing a 1.7 percentage point increase. Canada ranked first in 2019, but the share of foreign residents who became Canadian citizens was only 4% in 2020, down from more than 10% in 2019.
Source: OECD International Migration Database, https://doi.org/10.1787/data-00342-en.
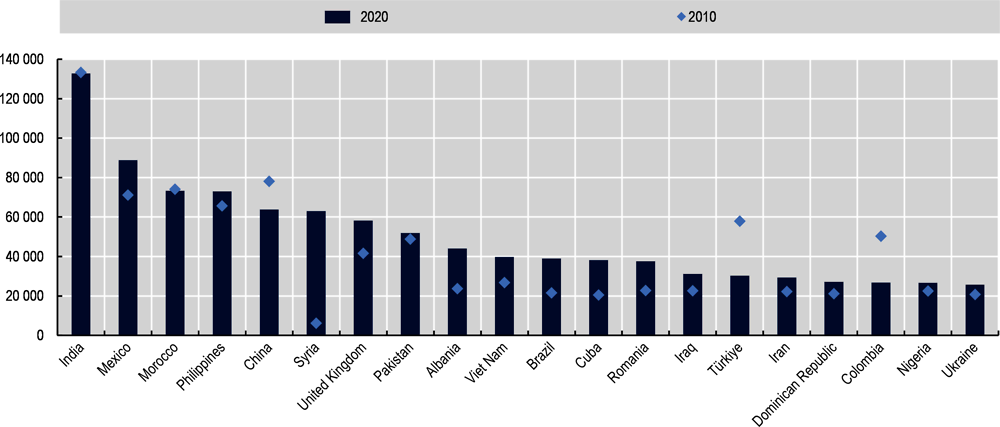
India has long been the top origin nationality of new citizens of OECD countries and remained in first position in 2020 with over 130 000 grants of citizenship (Figure 1.15). Three-quarters of these grants took place in only three countries: the United States (47 000), Australia (38 000) and Canada (15 000).
Mexicans remain the second top nationality despite the severe drop of naturalisations in the United States, their main country of destination. Morocco, the Philippines and China follow as the other main nationalities of origin.
The number of Syrians acquiring an OECD citizenship has increased every year between 2014 and 2021 following the large humanitarian inflows around 2015. Over this 8-year period, 100 000 Syrians became citizens in Sweden alone.
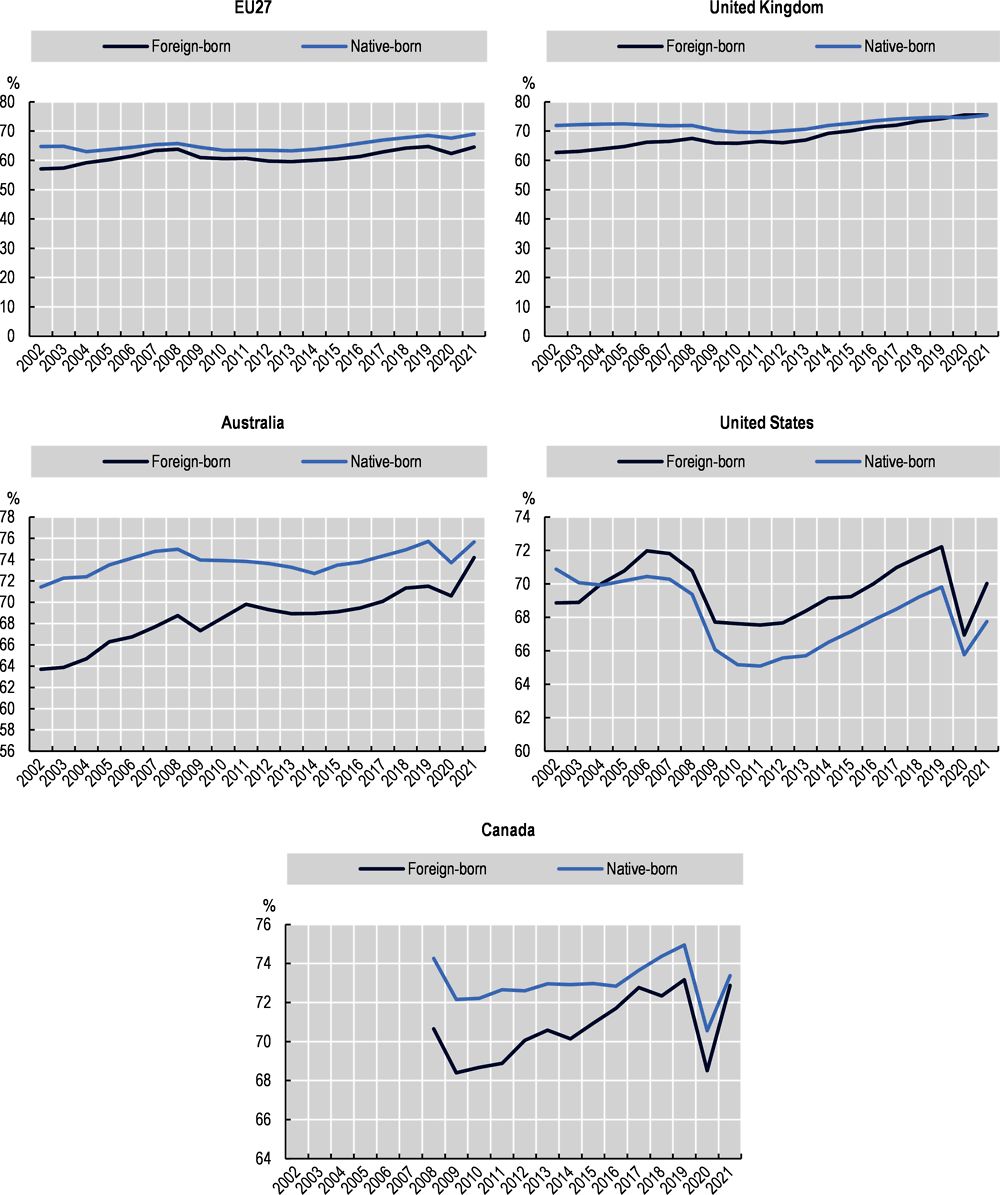
In 2021, the labour market situation of immigrants improved in most OECD countries
Although the COVID-19 pandemic put an end to ten years of continuous improvement in the labour market situation of immigrants in OECD countries, in 2021 the latter had almost fully returned to their pre-crisis employment levels. Overall, the labour market situation of immigrants deteriorated more sharply in 2020 than that of their native-born counterparts, but improved more as the economy recovered in 2021. The employment rate of immigrants in OECD countries increased from 67.9% in 2020 to 69.4% in 2021, 0.5 percentage points lower than before the health crisis. Their unemployment rate fell from 10.3% to 9.1%, but is still 0.7 percentage points higher than before the pandemic (Table 1.5).
In 2021, the employment rate of immigrants in OECD countries was on average 1 percentage point lower than that of the native-born, and the unemployment rate was 3 percentage points higher. However, in more than half of countries, this gap had narrowed significantly in 2021. Indeed, the more prominent increase in the labour market outcomes of immigrants in 2021 – observed in at least two-thirds of OECD countries – led to a narrowing of the gap with the native-born. One reason for this is the cyclical nature of the jobs held by immigrants (OECD, 2019[2]). Because the labour market outcomes of immigrants are more sensitive to cyclical variations, a period of economic expansion or recovery, such as in 2021, leads to a decrease in the employment and unemployment gaps between immigrants and the native-born.
This trend towards an improvement in the employment situation of immigrants in 2021 varied across host countries, depending in particular on the extent to which each country maintained employment safeguards and health restrictions in 2021. Despite an overall reduction, a gap in the employment rate between immigrants and the native-born still persists, particularly in Western Europe, in contrast to other OECD countries such as the United States and Latin American countries where migrants have higher employment rates than the native-born. In the EU27, the employment rate of the native-born remains 4.5 percentage points higher than that of immigrants. In most OECD countries, immigrants are also more likely to be unemployed than the native-born, again with the exception of the United States where the labour market is particularly flexible, and immigrants are more mobile than their native-born counterparts.
The employment rate of immigrants increased in more than seven out of ten OECD countries between 2020 and 2021, and almost half of OECD countries recorded an increase in the foreign-born employment rate compared to the pre-crisis situation. The increase in the employment rate of the migrant population since 2019 is particularly significant in Poland (+6 percentage points), Denmark (+4 percentage points) and New Zealand (+3 percentage points). In Poland, this dramatic increase can be explained in part by the substantial decrease in the number of immigrants, due to both a reduction in temporary immigration and an increase in out-migration. On the other hand, only eight OECD countries experienced an increase in the employment rate and a concomitant decrease in the unemployment rate (Australia, France, Poland, Portugal, Greece, Luxembourg, New Zealand and Denmark).
In several countries, the improvement in the employment rate of immigrants in 2021 was not enough to offset the negative impact of the 2020 crisis. This is particularly the case in the United States, where employment support mechanisms were limited (OECD, 2022[3]), and immigrants are largely concentrated in sectors and regions with high unemployment. Indeed, despite a substantial increase in the labour market outcomes of immigrants between 2020 and 2021, their employment rate remains significantly lower than in 2019 and their unemployment rate higher (Table 1.5). Nevertheless, in 2021, the number of immigrants fell sharply in areas of high unemployment while it rose in areas of lower unemployment, suggesting greater mobility of migrants to areas with greater employment opportunities (Capps, 2021[4]).
While the situation for the native-born has returned to or exceeded the pre-crisis level, a decline in the employment rate of immigrants compared to 2019 can also be observed in the three Baltic States, Iceland, Switzerland, the Slovak Republic, Italy, Spain, and to a lesser extent Germany (Table 1.5). In most of these countries, this has been accompanied by a worsening of their unemployment rate, as well as a decline in their participation rate. The deterioration of this situation reflects the persistence of the factors that led to the downturn in economic activity during the health crisis, with a greater impact on migrants. In Spain, Italy and Germany, the number of migrants employed in the hospitality sector decreased during the crisis, and the increase in migrant employment in other sectors did not offset this loss. In the Baltic States, the decline in the employment rate of the immigrant population may also be the result of a cohort effect – many 55-64 year-old migrants have left the labour market – and the worsening situation for younger people who have become inactive.
Finally, the employment rate of immigrants residing in Latin American countries, where job retention schemes were limited, remains significantly lower than in 2019. However, the impact of the crisis on the native-born in these countries has been even more acute.
While the labour force participation rate of immigrants had declined in 2020, mainly as a result of the many lockdowns that limited their availability and prevented effective job searches, an increase was recorded in 2021 in the majority of OECD countries, except for the Baltic States, Colombia, Slovenia and Switzerland. On average, 75.9% of immigrants were active in the labour market in 2021 compared to 74.6% in 2020. Moreover, the gap with the native-born narrowed slightly in 2021: the labour force participation of migrants is on average 0.6 percentage points higher than that of the native-born and almost half of OECD countries have a higher participation rate among migrants than among the native-born. This gap is particularly high in Poland (12 percentage points), Portugal (8 points), Luxembourg, Hungary and the Czech Republic.
The risk of long-term unemployment for migrants increased as a result of the crisis
Despite this improvement, the COVID-19 pandemic has led to an increase in the risk of long-term unemployment for migrants as well as for the native-born. After a steady decline, the long-term unemployment rate of active immigrants has increased for the first time in a decade in Canada, the United States and Europe. In times of crisis, immigrants face greater difficulties finding a job and are therefore more vulnerable to long-term unemployment because of their less developed networks, their poorer language skills, their concentration in the most exposed sectors, and the hiring discrimination they may face, which increases in times of crisis (OECD, 2009[5]). This last factor also plays a role in the higher probability of migrants being laid off during the pandemic. Auer (2022[6]) highlights the evidence of discrimination in firms in Germany during the first wave of COVID-19: after controlling for sectoral effects, migrants have a higher probability of being fired while people born in Germany are more likely to be included in short-time working schemes. While demand for labour is decreasing, many individuals are discouraged in their job search. These factors favour an increase in long-term unemployment, which can have major repercussions on future labour market outcomes (OECD, 2021[7]).
In the United States, 1.3% of foreign-born were unemployed for more than 12 months in 2021, almost 1 percentage point more than in 2019. More striking is the reversal of the trend: while this proportion was slightly higher among native-born before the crisis, migrants are now more likely to be in long-term unemployment. In the EU27 countries, the incidence of long-term unemployment for immigrants rose from 1.8% in 2020 to 2.3% in 2021, a higher share than that of the native-born population, with immigrant women being even more likely to be in long-term unemployment. In Canada, the long-term unemployment rate has also worsened more significantly for immigrants than for their native-born counterparts.
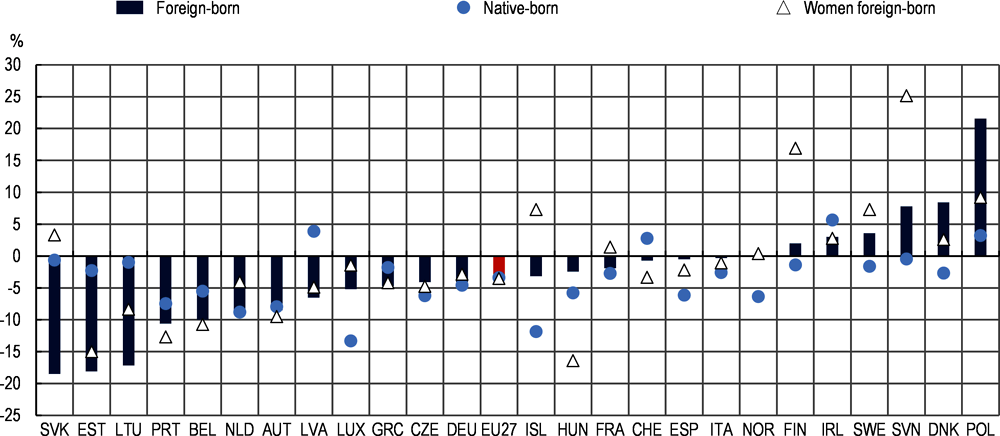
A closer look at the changes in the average number of hours worked by migrants since the beginning of the pandemic helps round out the analysis in this chapter. The outbreak of the COVID-19 pandemic led to a substantial decrease in the number of hours worked for the population as a whole, but much more markedly for migrants, who were over-represented in the sectors most affected by the crisis. On average in the EU27 countries, migrants saw the number of hours they worked fall by 17% between the second quarter of 2019 and the second quarter of 2020, compared with 12% for the native-born. In the second quarter of 2020, 20% of employed migrants reported not working (an 8 percentage points increase compared to the first quarter), while this was the case for 16% of the employed native-born population. The number of hours increased in the third quarter of 2020, as the first wave of the pandemic subsided.
By the fourth quarter of 2021, migrants had on average almost regained the number of hours worked pre-crisis: in the EU27 countries, the average number of hours worked by migrants fell by 4% in the fourth quarter of 2019, while it shrank by 3% among the native-born population as a whole. However, this average hides significant disparities between EU countries. In Belgium, Estonia, Lithuania, Portugal and the Slovak Republic, the average number of hours worked by employed migrants remains 10% to 18% lower than before the crisis (Figure 1.16). In contrast, the native-born in these countries are working almost as much as before the crisis, except in Belgium and Portugal. However, in some countries where migrants have returned to relatively similar working hours as prior to the pandemic (Hungary, Iceland, Luxembourg, Norway and Spain), there has been a reduction in the number of hours worked by the native-born. In addition, the number of hours worked by migrants has increased in Denmark, Poland, Slovenia and Sweden.
In the second quarter of 2020, the number of hours worked by migrant women fell immediately, more significantly than for their male counterparts and for native-born women. Indeed, school closures created an even greater domestic and family workload for women. On the other hand, women, especially migrant women, were over-represented in “front line” jobs, and their working hours increased steeply from the third quarter of 2020 onwards. Nevertheless, in Figure 1.16 the analysis reveals both a continuation of the effects of the crisis on the situation of women in the fourth quarter of 2021 in some European countries (Hungary, Estonia, Portugal, Belgium, Austria) and a substantial increase in the average number of hours worked compared to pre-crisis levels in Nordic countries such as Denmark (+3%), Finland (+17%) or Sweden (+7%) and in Eastern European countries such as Slovenia (+25%) and Poland (+9%). These countries also recorded the highest increases in the participation rate of migrant women, some of whom had to make up for the potential loss of spousal income due to the crisis. These trends could suggest better future labour market integration prospects for migrant women.
Finally, data on changes to the number of hours worked by migrants also indicate a sharper decline in the working hours of young people, individuals with a low level of educational attainment, and those on temporary contracts.
Note: The data correspond to the weekly number of hours actually worked. A change in the methodology of the Labour Force Survey caused a break in series in 2021. The data on the number of hours worked are not adjusted.
Source: Labour Force Surveys (Eurostat).
Post COVID-19 changes in the labour market outcomes of migrants differ according to certain socio-demographic characteristics
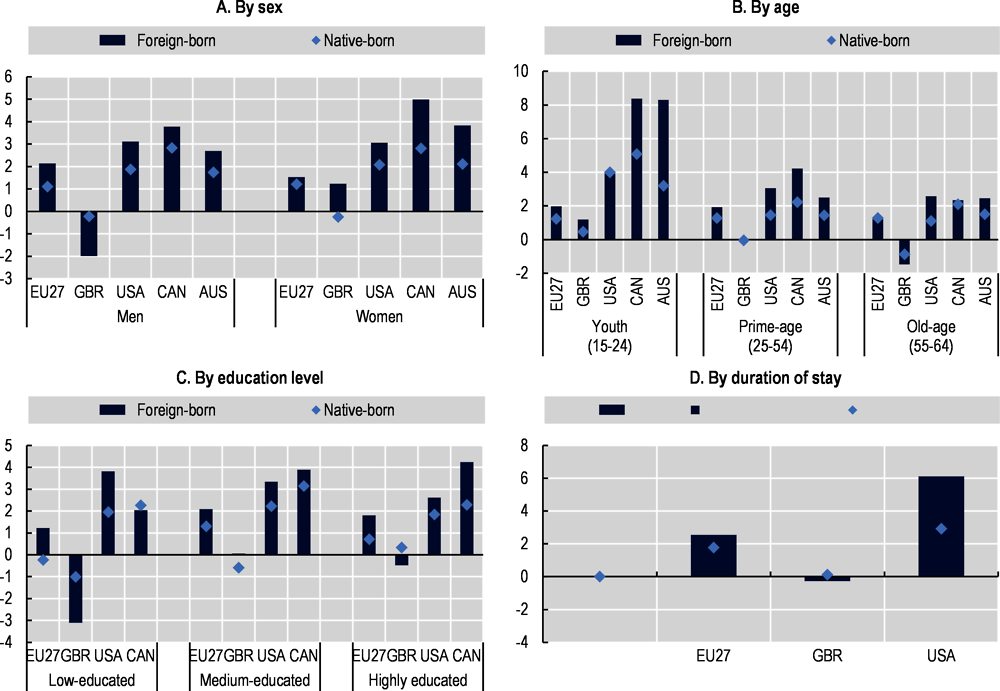
Improved labour market integration of women compared to 2019
Studies have shown that the pandemic has had a greater impact on the employment outcomes of migrant women, mainly due to their over-representation in the sectors most affected by the crisis, but also as a result of the increased domestic workload, school closures and the greater difficulty they have in teleworking (Fasani and Mazza, 2020[8]). That said, an examination of changes in the labour market outcomes of the migrant population by gender between 2019 and 2021 does not reveal any particularly striking differences between women and men, with the exception of the United Kingdom where the employment rate of migrant women is well above its pre-crisis level while that of their male counterparts remains significantly lower (Figure 1.17). In Australia and Canada, the labour market situation of migrant women has also improved more than that of migrant men and native-born women. Conversely, in the EU27 countries, the employment rate of migrant men improved more than for their female counterparts in 2021 (Annex Figure 1.A.3).
The increase in the employment rate of migrant women was particularly significant in the Nordic countries and some Eastern European countries, such as Poland (+13 percentage points) and Slovenia (+6 percentage points), while the employment rate of migrant men increased more strongly in Austria, Greece and the three Baltic States. Likewise, an increase of more than 5 percentage points in the labour market participation rate of migrant women has been observed in several Nordic and Eastern European countries. This could reflect an increase in the number of previously inactive women joining the labour market to make up for the potential loss of spousal income, as is the case in the Nordic countries. (Sánchez Gassen, 2021[9]). Only Colombia, Estonia, Italy and the Slovak Republic recorded a decline in the labour force participation of migrant women of more than 1 percentage point.
Furthermore, foreign-born women residing in Australia and the United Kingdom, have now reached their highest employment rate of the last 20 years. Although the employment rate of migrant men remains substantially higher than that of women, the gap narrowed in 2021 in Australia, Canada and the United Kingdom. This is not the case in the United States, where the gap – of 22 percentage points in 2021 – has always been particularly high (see Annex Figure 1.A.2).

Note: The reference population is the working age population (aged 15-64). “Low-educated” refers to less than upper secondary education, “Medium” to upper secondary and post-secondary non-tertiary education, and “Highly” to tertiary education. The employment rates of the native-born and foreign-born populations in the EU27 countries in 2019 and 2020 have been adjusted for the break in series caused by the change in methodology of the European Union Labour Force Survey (EU-LFS) in 2021. Calculations have been made by the Secretariat using the adjusted series for the whole population provided by Eurostat. EU27 does not include the United Kingdom.
Source: European countries: Labour Force Surveys (Eurostat); Australia, Canada, United Kingdom: Labour Force Surveys; United States: Current Population Surveys.
Employment of young migrants has increased compared to 2020 but remains below the pre-crisis level
People aged 15-24, whether native-born or foreign-born, are more vulnerable in the labour market than the general population as a result of the COVID-19 pandemic, mainly because they are over-represented in the sectors most affected by the crisis, are more likely to work on fixed-term contracts, and have less work experience, which puts them at a higher risk of losing their job (OECD, 2021[10]). Disruption to training programmes and apprenticeships is another factor affecting the transition from education to the labour market. In addition to these difficulties, which are common to all young people, young migrants face specific structural barriers. In 2019 and still in 2021, they are for example more likely than their native-born counterparts to work part-time or in temporary jobs.
Generally speaking, despite all these factors, the negative impact of the crisis on the employment rate of young immigrants has not been more marked than for the rest of the immigrant population and their native-born counterparts – except in Australia and Canada (Figure 1.17). Indeed, in Europe, the United Kingdom and to a lesser extent the United States, the employment rate of young people (aged 15-24) has declined to a similar extent to that of non-migrants. In Canada and Australia, the employment rate of migrant youth has even improved and the gap with native-born youth has been narrowing since 2019 (Figure 1.17). Australia put in place a number of measures to support young people during and after the COVID-19 pandemic, including an incentive scheme to hire young people between October 2020 and October 2021 (the JobMaking Hiring Credit), measures to promote the recruitment of apprentices, and the expansion and strengthening of programmes to support the transition to employment (OECD, 2021[10]). Similar measures were put in place in the majority of OECD countries, which has helped to mitigate the lasting effects of the crisis on young people. However, the significant improvement in their labour market situation between 2020 and 2021 (see Annex Figure 1.A.3), has not been enough to offset the negative effects of the crisis, and the employment rate of young immigrants remains, on the whole, below the pre-crisis level.
In the EU27 countries, the share of young people not in education, employment or training (NEET rate) decreased in 2021 among the migrant population while it slightly increased among the native-born population (Figure 1.18). However, the NEET rate for migrants has increased in the Czech Republic, Luxembourg and Norway. In the United States and Canada, the NEET rate for young migrants had increased significantly by 2020 and for the first time in 10 years. In 2021, this rate decreased from 18% to 15% in the United States, a rate still 2 percentage points higher than in 2019. Since the beginning of the crisis, most OECD countries have introduced measures to encourage the hiring of apprentices and vocational training. Some countries, notably France, Sweden, Poland, Austria, Chile and New Zealand, have implemented specific measures targeting vulnerable young people or those from disadvantaged backgrounds – including migrants (OECD, 2021[10]).
Finally, highly educated migrants across OECD countries have almost regained their pre-crisis employment rate, while the situation for low and medium-educated migrants remains significantly worse than in 2019 (Figure 1.17).

Note: The NEET rates of the native and foreign-born populations in the 27EU countries in 2019 and 2020 have been adjusted for the break in series caused by the change in methodology of the European Union Labour Force Survey (EU-LFS) in 2021. Calculations have been made by the OECD Secretariat taking into account the adjusted series for the whole population provided by Eurostat.
Source: European countries: Labour Force Surveys (Eurostat); Canada: Labour Force Surveys; United States: Current Population Surveys; United Kingdom: National Labour Force Survey.
The labour market situation of recently arrived migrants significantly improved in 2021
The negative impact of the health crisis on migrant employment in 2020 was, paradoxically, less pronounced for recent immigrants (who arrived in the country less than five years ago) than for settled migrants. Overall, the improvement in the employment situation for recently arrived immigrants in the host country was also much more significant in 2021 (Figure 1.17). In the EU27 countries, the employment rate of recent immigrants increased by 2.3 percentage points between 2020 and 2021, a 1.4 percentage point increase compared to 2019. In contrast, the less marked improvement in the employment situation of immigrants who have been in the country for more than five years in 2021 has not made up for the deleterious effect of COVID-19 in 2020. Similarly, Canada and the United States recorded a dramatic increase of 8 and 6 percentage points respectively in the employment rate of recently arrived immigrants in 2021, exceeding the pre-pandemic level, while the employment rate of longer-settled immigrants declined compared to 2019 (Figure 1.17). In Canada, the number of recently arrived immigrants in employment increased by 71% between 2020 and 2021, while the number of settled migrants in employment increased by only 5%. In the United States, these increases were 35% and 2% respectively.
However, recent immigrants are less likely to remain in employment than their counterparts who have been in the country for more than five years. In European countries, 66% of settled immigrants are in employment compared to 55% of recent immigrants. The unemployment rate of recent immigrants is also higher, with the exception of the United States where it is similar (6%).
There are several factors behind these results. First, the health crisis in 2020 led to a significant decrease in migration flows and in particular in the number of arrivals of migrants with a weak connection to the labour market, such as asylum seekers, refugees and, in several countries, family migrants. In addition, exemptions to the entry restrictions imposed by OECD countries in 2020 and 2021 were granted primarily for work-related reasons, notably in the health, agriculture and transport sectors. In response to labour shortages, some OECD countries have also allowed expansion of work rights for asylum seekers already in the country, particularly in the agricultural sector. This is the case in Spain, where they can be employed six months after submitting an application for international protection. Since December 2020, the United States has also allowed temporary migrants in the agricultural sector to extend their visas and to start working before their new visas are officially approved (EMN/OECD, 2021[11]).
At the same time, the COVID-19 pandemic led to increased outflows of recently arrived immigrants in some OECD countries. Some studies suggest that the immigrants most likely to return to their country of origin are recent immigrants with weaker labour market ties or who lost their jobs during the pandemic. In Norway, the reduction in the number of posted workers during the pandemic mitigated the impact on employment of resident immigrants and native-born (Bratsberg and Raaum, forthcoming[12]).
Disparities in terms of labour market integration based on origins persist in 2021
The labour market situation of foreign-born varies significantly depending on their place of origin. Several factors can explain these variations. The characteristics of the migrant population, such as the share of women, young people, low or highly educated individuals, differ depending on the region of origin. In addition, the degree of language proficiency of migrants and the recognition of foreign diplomas by the host country are other decisive factors for their labour market integration and vary significantly from one region to another. Finally, these disparities also result from the types of migration waves, which influence migrants’ status and duration of stay, as for example in the case of humanitarian migration waves. In addition, some studies have revealed a more significant negative effect of the health crisis on ethnic minorities (Fasani and Mazza, 2020[8]; OECD, 2022[13]), which may indicate a higher vulnerability due to labour market discrimination, but also structural effects due to their over-representation in sectors exposed to the crisis. So the effects of the pandemic may not just vary between migrants and native-born, but also between different migrant groups.
The analysis of the changes in employment, unemployment and participation rates by region of origin in 2021 has shown that the employment situation of migrants in 2021 improved in most OECD countries. However, the extent to which this improvement has enabled migrants to regain a similar or better employment situation than before the COVID-19 pandemic varies significantly depending on the region of origin (Table 1.6).
Compared to the pre-crisis level, the employment rate of immigrants from Sub-Saharan Africa, North Africa and the Middle East has increased more than that of other migrant groups in most OECD countries, with the exception of the United States where it has gone down (Table 1.6). Within the EU27, this group has been showing an improvement since 2019. In Europe and Australia, the increase has been accompanied by a decline in their unemployment rate, which has fallen below 10% in Australia for the first time in ten years. Despite this progress, this group remains the most disadvantaged: in 2021, their employment rate was the lowest and their unemployment rate the highest in most OECD countries. In Europe, for example, the gap with immigrants from EU27 countries is substantial: in 2021, 72% of EU27 immigrants were in employment compared to 51.5% of immigrants from North Africa and 56% of those from the Middle East.
Moreover, there has been a significant increase in the employment rate of immigrants from Asia in the United Kingdom and Australia between 2019 and 2021. This can be explained by an increase in departures and a corresponding decrease in entries of international students from Asia due to the pandemic, thus mechanically decreasing their employment rate in these major destination countries for international students.
In the United States, although the employment rate of migrants increased between 2020 and 2021, regardless of their region of birth, no group has managed to regain its pre-crisis level. In particular, despite a significant increase in their employment rate and a significant decrease in their unemployment rate in 2021, the situation of immigrants from Mexico, other Central and South American countries, and the Caribbean has deteriorated significantly compared to 2019. In contrast, the employment rate of immigrants from Asia, Canada and Europe is almost similar (within 0.6 percentage points) to the level observed before the pandemic.
References
[6] Baert, S. (ed.) (2022), “Firing discrimination: Selective labor market responses of firms during the COVID-19 economic crisis”, PLOS ONE, Vol. 17/1, p. e0262337, https://doi.org/10.1371/journal.pone.0262337.
[12] Bratsberg, B. and O. Raaum (forthcoming), Bruken av utenlandsk arbeidskraft gjennom COVID-19 pandemien.
[4] Capps, R. (2021), Immigrants’ U.S. Labor Market Disadvantage in the COVID-19 Economy: The Role of Geography and Industries of Employment, Washington, DC: Migration Policy Institute.
[1] De Wispelaere, F., L. De Smedt and J. Pacolet (2022), Posting of workers: Report on A1 portable documents issued in 2019, Publications Office of the European Union, Luxembourg, https://doi.org/10.2767/487681.
[11] EMN/OECD (2021), The impact of Covid-19 in the migration area in EU and OECD countries, European Migrant Network/OECD, https://www.oecd.org/migration/mig/00-eu-emn-covid19-umbrella-inform-en.pdf.
[8] Fasani, F. and J. Mazza (2020), “Being on the Frontline? Immigrant Workers in Europe and the COVID-19 Pandemic”, Institute of Labor Economics (IZA) IZA Discussion Papers No. 13963.
[3] OECD (2022), “Riding the waves: Adjusting job retention schemes through the COVID-19 crisis”, OECD Policy Responses to Coronavirus (COVID-19), OECD Publishing, Paris, https://doi.org/10.1787/ae8f892f-en.
[13] OECD (2022), “The unequal impact of COVID-19: A spotlight on frontline workers, migrants and racial/ethnic minorities”, OECD Policy Responses to Coronavirus (COVID-19), OECD Publishing, Paris, https://doi.org/10.1787/f36e931e-en.
[7] OECD (2021), OECD Employment Outlook 2021: Navigating the COVID-19 Crisis and Recovery, OECD Publishing, Paris, https://doi.org/10.1787/5a700c4b-en.
[10] OECD (2021), “What have countries done to support young people in the COVID-19 crisis?”, OECD Policy Responses to Coronavirus (COVID-19), OECD Publishing, Paris, https://doi.org/10.1787/ac9f056c-en.
[2] OECD (2019), International Migration Outlook 2019, OECD Publishing, Paris, https://doi.org/10.1787/c3e35eec-en.
[5] OECD (2009), International Migration Outlook 2009, OECD Publishing, Paris, https://doi.org/10.1787/migr_outlook-2009-en.
[9] Sánchez Gassen, N. (2021), Integrating Immigrants into the Nordic Labour Markets: The impact of the COVID-19 pandemic, Nordic Council of Ministers.
Note: The reference population is the working-age population (15-64). In the EU27, years between 2010- 2020 have been subject to adjustments for the break in series caused by the change in the methodology of the European Labour Force Survey in 2021. Calculations were made by the Secretariat taking into account the adjusted series for the whole population provided by Eurostat. EU27 does not include the United Kingdom.
Source: European Countries: Labour Force Surveys (Eurostat); Australia, Canada and the United Kingdom: Labour Force Surveys; United States: Current Population Surveys.
Note: The reference population is the working-age population (15-64). “Low-educated” here refers to less than upper secondary attainment, “Medium-educated” to upper secondary and post-secondary non-tertiary, “Highly educated” to tertiary. The employment rates of native-born and foreign-born populations in the EU27 countries in 2019 and 2020 have been subject to adjustments for the break in series caused by the change in the methodology of the European Labour Force Survey in 2021. Calculations were made by the OECD Secretariat taking into account the adjusted series for the whole population provided by Eurostat. EU27 does not include the United Kingdom.
Source: EU27: Labour Force Surveys (Eurostat); Australia, Canada and the United Kingdom: Labour Force Surveys; United States: Current Population Surveys.