copy the linklink copied! Chapter 6. What can students do in mathematics?
This chapter describes the range of mathematical competences assessed in PISA 2018 and reports the proportion of students who performed at each level of proficiency.
The PISA assessment of mathematics focuses on measuring students’ capacity to formulate, use and interpret mathematics in a variety of contexts. These include not only familiar settings related to personal experience, such as when preparing food, shopping or watching sports, but also occupational, societal and scientific contexts, such as costing a project, interpreting national statistics or modelling natural phenomena. To succeed on the PISA test, students must be able to reason mathematically and use mathematical concepts, procedures, facts and tools to describe, explain and predict phenomena. Competence in mathematics, as defined in PISA, assists individuals in recognising the role that mathematics plays in the world and in making the well-founded judgements and decisions needed to be constructive, engaged and reflective citizens (OECD, 2019[1]).1
Performance in mathematics described in this way encompasses more than the ability to reproduce the mathematics concepts and procedures acquired in school. PISA seeks to measure how well students can extrapolate from what they know and apply their knowledge of mathematics in a range of situations, including new and unfamiliar ones. To this end, most PISA mathematics units refer to real-life contexts in which mathematics abilities are required to solve a problem. The focus on real-life contexts is also reflected in the possibility of using “tools”, such as a calculator, a ruler or a spreadsheet, to solve problems, just as one would do in a real-life situation.
-
On average across OECD countries, 76 % of students attained Level 2 or higher in mathematics. At a minimum, these students can interpret and recognise, without direct instructions, how a (simple) situation can be represented mathematically (e.g. comparing the total distance across two alternative routes, or converting prices into a different currency). However, in 24 countries and economies, more than 50 % of students scored below this level of proficiency.
-
Six Asian countries and economies had the largest shares of students who scored at Level 5 or higher in mathematics: Beijing, Shanghai, Jiangsu and Zhejiang (China) (44 %), Singapore (37 %), Hong Kong (China) (29 %), Macao (China) (28 %), Chinese Taipei (23 %) and Korea (21 %). These students can model complex situations mathematically, and can select, compare and evaluate appropriate problem-solving strategies for dealing with them.
-
About one in six 15-year-old students in Beijing, Shanghai, Jiangsu and Zhejiang (China) (16 %), and about one in seven students in Singapore (14 %), scored at Level 6 in mathematics, the highest level of proficiency that PISA describes. These students are capable of advanced mathematical thinking and reasoning. On average across OECD countries, only 2.4 % of students scored at this level.
-
Compared to countries of similar average performance in PISA, Germany and Korea have a larger share of students who performed at the highest levels of mathematics proficiency, but also of students who performed at the lowest levels. This reflects the wide variation in mathematics performance within these countries.
Mathematics was tested using computers (as were reading and science) in 70 of the 79 participating countries and economies; the remaining 9 countries delivered the test in a pencil-and-paper format. All countries/economies, regardless of the assessment mode, used the same mathematics questions.2 Results of the PISA mathematics test can be compared across all 79 participating countries and economies. Annex A5 discusses the differences between paper- and computer-based assessments. It explains how, in order to report results on the same scale and enable fair comparisons, 32 (out of 82) items were deemed to vary in difficulty between the computer-based and paper-and-pencil tests (6 items were deemed easier on computer; 26 items were deemed more difficult).
copy the linklink copied! The range of proficiencies covered by the PISA mathematics test
As discussed in Chapter 2, student performance in PISA is reported on a scale. To help interpret what students’ scores mean in substantive terms, the scale is divided into levels of proficiency that indicate the kinds of tasks that students whose scores are above a lower score limit are capable of completing successfully. The six proficiency levels used in the PISA 2018 mathematics assessment were the same as those established for the PISA 2003 and 2012 assessments, when mathematics was the major area of assessment. The process used to produce proficiency levels in mathematics is described in Chapter 2. Table I.6.1 illustrates the range of mathematical skills that are covered by the PISA test and describes the skills, knowledge and understanding that are required at each level of the mathematics scale.
Since it is necessary to preserve the confidentiality of the test material in order to continue to monitor trends in mathematics beyond 2018, the questions used in the PISA 2018 assessment of mathematics cannot be presented in this report. However, it is still possible to illustrate the proficiency levels with questions from previous assessments. Sample items that illustrate the different levels of mathematics proficiency can be found in PISA 2012 Results: What Students Know and Can Do (OECD, 2014, pp. 125-142[2]).
copy the linklink copied! Percentage of students at the different levels of mathematics proficiency
Figure I.6.1 shows the distribution of students across the six proficiency levels in each participating country and economy. Table I.B1.2 (in Annex B1) shows these same percentages of students at each proficiency level on the mathematics scale, with standard errors.
Proficiency at Level 2 or above
This report considers students who scored below Level 2 as “low-achieving students”. Indeed, at Level 2, students begin to demonstrate the ability and initiative to use mathematics in simple real-life situations. The global indicators for the United Nations Sustainable Development Goals (see Chapter 11) identify Level 2 proficiency as the “minimum level of proficiency” that all children should acquire by the end of secondary education. While students who score below this minimum level can be considered particularly at risk, Level 2 proficiency is by no means a “sufficient” level of mathematics proficiency for making well-founded judgements and decisions across a range of personal or professional situations in which mathematical literacy is required.
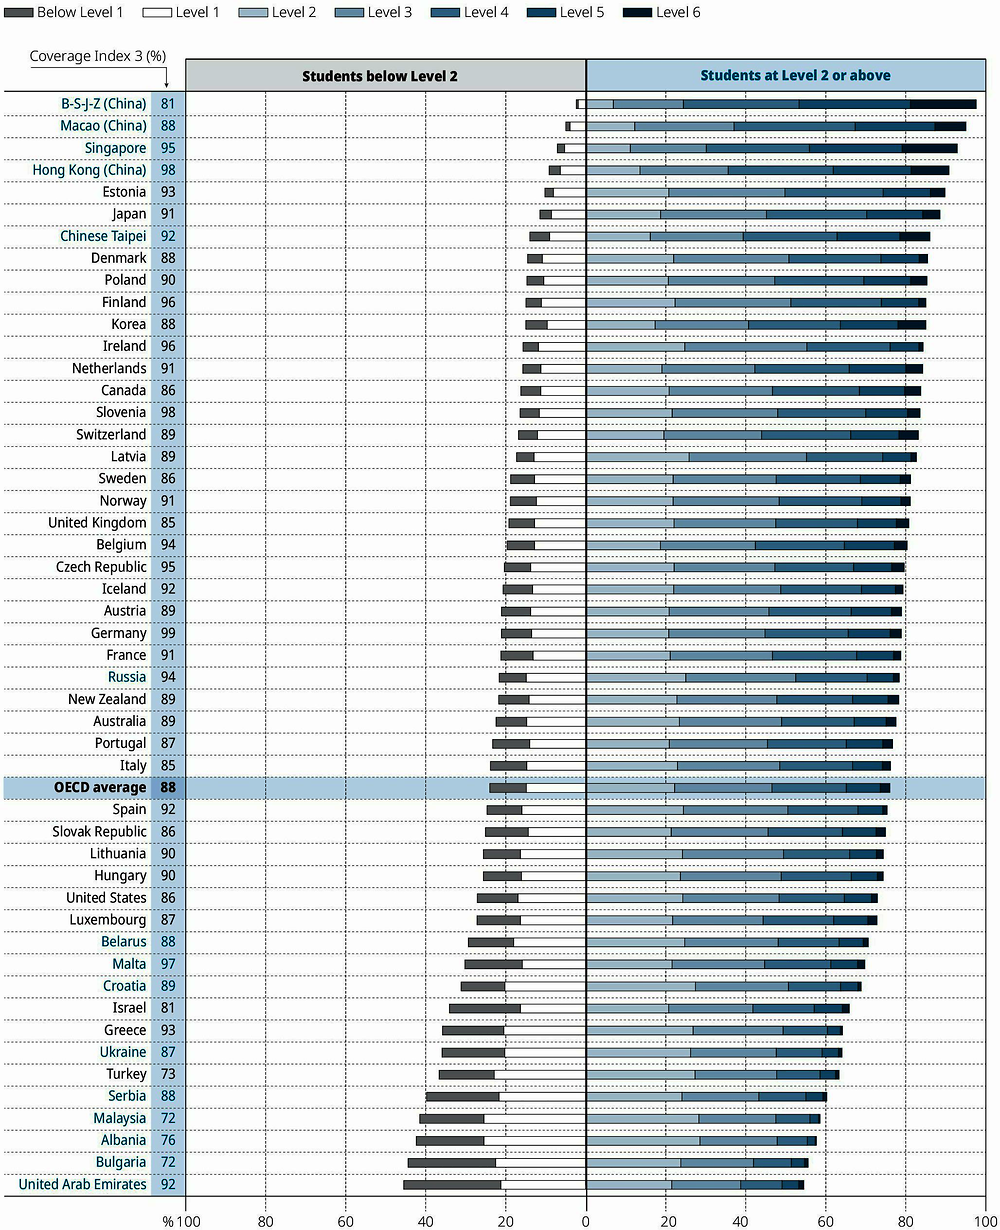

Note: Coverage Index 3 is shown next to the country/economy name.
Countries and economies are ranked in descending order of the percentage of students who performed at or above Level 2.
Source: OECD, PISA 2018 Database, Tables I.B1.2 and I.A2.1.
Skills requirements are likely to evolve over time and to depend on the context and the tools, such as technologies, that one can make use of in that context. As more advanced technologies that can substitute for certain human skills become available, the skills required for participation in labour markets, for example, are likely to increase (Goldin and Katz, 2008[3]; Elliott, 2017[4]; Frey and Osborne, 2017[5]).
Proficiency at Level 2
At Level 2, students can use basic algorithms, formulae, procedures or conventions to solve problems involving whole numbers – e.g. to compute the approximate price of an object in a different currency or to compare the total distance across two alternative routes. They can interpret and recognise situations in contexts that require no more than direct inference, extract relevant information from a single source and make use of a single representational mode (such as graphs, tables, equations, etc). Students at this level are capable of making literal interpretations of results.
More than 90 % of students in Beijing, Shanghai, Jiangsu and Zhejiang (China) (hereafter “B-S-J-Z [China]), Hong Kong (China), Macao (China) and Singapore, and close to 90 % in Estonia achieved this benchmark. On average across OECD countries, 76 % of students attained Level 2 or higher (that is, were proficient at Level 2, 3, 4, 5 or 6; Figure I.6.1 and Table I.B1.2). Meanwhile, fewer than one in ten students in the Dominican Republic (9.4 %), and only 19 % of students in Panama and the Philippines attained this baseline level of mathematics proficiency. In 21 other countries, more than 20 % but less than 50 % of 15-year-old students attained this level of proficiency.
Proficiency at Level 3
At Level 3, students can execute clearly described procedures, including those that require sequential decisions. They typically show some ability to handle percentages, fractions and decimal numbers, and to work with proportional relationships. Their interpretations are sufficiently sound to be the basis for building a simple model or for selecting and applying simple problem-solving strategies. Students at this level can interpret and use representations based on different information sources and reason directly from them. Their solutions show that they have engaged in basic interpretation and reasoning.
Across OECD countries, 54 % of students were proficient at Level 3 or higher. More than 90 % of students were proficient at Level 3 or higher in B-S-J-Z (China); and at least two out of three students in Estonia, Hong Kong (China), Japan, Korea, Macao (China), Singapore and Chinese Taipei attained this level. This shows that in some education systems, virtually all children develop a solid foundation in mathematics. In contrast, in 24 countries and economies with comparable data, three out of four students did not attain this level (Figure I.6.1 and Table I.B1.2).
Proficiency at Level 4
At Level 4, students can work effectively with explicit models on complex, concrete situations that may involve constraints or call for making assumptions. They can select and integrate different representations, including symbolic representations (such as equations and formulae), linking them directly to aspects of real-world situations. Students at this level can reason with some insight. They can construct and communicate explanations and arguments based on their interpretations, reasoning and actions.
Across OECD countries, 29 % of students performed at proficiency Level 4, 5 or 6. More than one in two students in B-S-J-Z (China) (73 %), Singapore (63 %), Macao (China) (58 %) and Hong Kong (China) (55 %) performed at one of these levels. Between 40 % and 50 % of students in Chinese Taipei (47 %), Korea (44 %), Japan (43 %), the Netherlands (42 %) and Estonia (40 %) scored at or above Level 4. By contrast, in 27 participating countries and economies with comparable data – including all of the Latin American countries that participated in PISA 2018 – less than 10 % of students attained this level (Figure I.6.1 and Table I.B1.2).
Proficiency at Level 5
At Level 5, students can develop and work with models for complex situations, identifying constraints and specifying assumptions. They can select, compare and evaluate appropriate problem-solving strategies for dealing with complex problems related to these models. Students at this level can work strategically using broad, well-developed thinking and reasoning skills, appropriate linked representations, symbolic and formal characterisations, and insights pertaining to these situations. They have begun to develop the ability to reflect on their work, and to communicate conclusions and interpretations in written form.
Across OECD countries, 11 % of students were top performers in 2018, meaning that they were proficient at Level 5 or 6. Amongst all countries and economies that participated in PISA 2018, B-S-J-Z (China) had the largest proportion of top performers (44 %), followed by five other Asian countries and economies: Singapore (37 %), Hong Kong (China) (29 %), Macao (China) (28 %), Chinese Taipei (23 %) and Korea (21 %). The strong performance of these Asian countries dispels the notion that children in these countries merely memorise subject-matter content: Level 5 proficiency requires students to master a high level of conceptual understanding and mathematical reasoning. In all remaining countries and economies, less than 20 % of students attained this level of proficiency in mathematics.
Countries with similar mean performance may have significantly different shares of students who are able to perform at the highest levels in PISA (Figure I.6.1 and Table I.B1.2). A smaller share of top-performing students, compared to countries of similar average performance, means that student performance varies more narrowly around the mean. For example:
-
Estonia (mean score: 523 points) had significantly fewer top-performing students (15.5 %) compared to Japan and Korea (mean scores: 527 and 526 points, respectively; top performers: 18.3 % and 21.4 %, respectively)
-
Germany and Ireland performed similarly, on average (mean score of 500 points in both countries), but 13.3 % of students in Germany were top performers, compared to just 8.2 % in Ireland
-
Croatia and Israel also performed similarly, on average (mean scores of 464 points and 463 points, respectively); yet 5.1 % of students in Croatia were top performers compared to 8.8 % of students in Israel.
Proficiency at Level 6
Students at Level 6 on the PISA mathematics scale can successfully complete the most difficult PISA items. These students can conceptualise, generalise and use information based on their investigations and modelling of complex problem situations, and can use their knowledge in relatively non-standard contexts. They can link different information sources and representations together and move flexibly amongst them. Students at this level are capable of advanced mathematical thinking and reasoning. These students can apply this insight and understanding, along with a mastery of symbolic and formal mathematical operations and relationships, to develop approaches and strategies for addressing novel situations. Students at this level can reflect on their actions, can formulate and precisely communicate those actions and reflections and can explain why they were applied to the original situation.
On average across OECD countries, only 2.4 % of students attained Level 6. About one in six students scored at this level in B-S-J-Z (China) (16 %), and about one in seven students in Singapore (14 %). In Hong Kong (China), Korea, Macao (China) and Chinese Taipei, between 5 % and 10 % of students attained proficiency Level 6. In 36 participating countries and economies, between 1 % and 5 % of students performed at this level; in 21 countries/economies, between 0.1 % and 1 % of students scored at Level 6; and in 15 other countries/economies, fewer than 1 in 1 000 students (0.1 %) performed at Level 6 (Figure I.6.1 and Table I.B1.2).
Proficiency below Level 2
The PISA 2018 mathematics assessment identified one proficiency level below Level 2. Students who scored at or below this level are considered low achievers in mathematics.
Proficiency at Level 1
At Level 1, students can answer mathematics questions involving familiar contexts where all of the relevant information is present and the questions are clearly defined. They are able to identify information and carry out routine procedures according to direct instructions. They can only perform actions that are obvious and that follow immediately from the given stimuli.
On average across OECD countries in 2018, 15 % of students were proficient only at Level 1. In B-S-J-Z (China) (2.4 %), Macao (China) (5.0 %), Singapore (7.1 %) and Hong Kong (China) (9.2 %), less than 10 % of students performed at or below Level 1 (Figure I.6.1 and Table I.B1.2). But in 21 countries and economies, Level 1 was the median level of proficiency, meaning that the score which divides 15-year-old students into two equal halves – 50 % scoring above it, and 50 % scoring below it – fell within the range of Level 1.
Proficiency below Level 1
Some 9.1 % of students on average across OECD countries scored below Level 1 in mathematics. By contrast, in the Dominican Republic (69 %), the Philippines (54 %) and Panama (54 %), more than one in two students scored below Level 1, the lowest described level of proficiency in PISA. In 26 participating countries and economies, between 20 % and 50 % of students did not reach Level 1 on the mathematics scale.
The PISA mathematics test included too few tasks of the appropriate difficulty that would help describe an additional level of proficiency below Level 1. However, based on the few PISA 2012 mathematics items whose difficulty lies below Level 1 (four of which were also included in the PISA 2018 mathematics assessment), students who score below Level 1, but not too far from it, can be expected to perform some direct and straightforward mathematical tasks. These include reading a single value from a well-labelled chart or table, where the labels on the chart match the words in the stimulus and question, so that the selection criteria are clear and the relationship between the chart and the aspects of the context depicted are evident. They may also be able to perform simple arithmetic calculations with whole numbers by following clear and well-defined instructions.
Given the large number of students who scored at these levels in many PISA-participating countries, the group of international experts working on the PISA 2021 test is trying to broaden the range of fundamental mathematical capabilities that PISA assesses, based partly on approaches piloted in the PISA for Development project (OECD, 2018[6]).
All PISA-participating countries and economies have students who score at or below Level 1, but the largest proportions of students who score at these levels are found in the lowest-performing countries. In some cases, countries with similar mean performance may have significantly different shares of students who score below Level 2 in mathematics. For example, in Estonia, whose mean performance in 2018 (523 score points) was not significantly different from that of Korea or the Netherlands, only 10.2 % of students scored at or below Level 1, while 15.0 % did so in Korea and 15.8 % in the Netherlands. This shows that in Korea and the Netherlands, student performance in mathematics varied more widely than in Estonia, despite similar average performance. And while mean performance in Germany and Ireland was similar (500 score points), the percentage of low achievers in Germany (21.1 %) was about 5 percentage points higher than that in Ireland (15.7 %).
copy the linklink copied! Accounting for out-of-school 15-year-olds
When evaluating countries’ success in equipping young adults with solid reading, mathematics or science skills, it is also important to consider whether these comparisons may change if 15-year-olds who are not part of the PISA target population were also included. For this reason, Figure I.6.1 reports, next to the name of each country/economy, the proportion of 15-year-olds who were covered by the PISA sample (Coverage Index 3).3
In many middle- and low-income countries, less than 75 % of 15-year-olds were covered by the PISA sample; indeed, in these countries, a significant portion of 15-year-olds were not eligible to participate in PISA because they had dropped out of school, had never attended school, or were in school but enrolled in grade 6 or below (see Chapter 3). It is not possible to know for certain, in any country, how the 15-year-olds who were not represented by the PISA sample would have scored had they taken the assessment. However, for countries where many 15-year-olds were not enrolled or were retained in grade 6 or below, mean performance and the percentage of students reaching Level 2 or higher would likely be lower than the estimates in this report suggest (see Box I.5.1 in Chapter 5). Accounting for changing rates of out-of-school 15-year-olds is particularly important when comparing countries’ performance over time (see Chapter 9), or when assessing countries’ performance against global development goals for the education of all children (see Chapter 10).
References
[10] Echazarra, A. et al. (2016), “How teachers teach and students learn: Successful strategies for school”, OECD Education Working Papers, No. 130, OECD Publishing, Paris, https://dx.doi.org/10.1787/5jm29kpt0xxx-en.
[4] Elliott, S. (2017), Computers and the Future of Skill Demand, Educational Research and Innovation, OECD Publishing, Paris, https://dx.doi.org/10.1787/9789264284395-en.
[5] Frey, C. and M. Osborne (2017), “The future of employment: How susceptible are jobs to computerisation?”, Technological Forecasting and Social Change, Vol. 114, pp. 254-280, https://doi.org/10.1016/j.techfore.2016.08.019.
[3] Goldin, C. and L. Katz (2008), The Race between Education and Technology, Belknap Press of Harvard University Press.
[1] OECD (2019), PISA 2018 Assessment and Analytical Framework, PISA, OECD Publishing, Paris, https://dx.doi.org/10.1787/b25efab8-en.
[6] OECD (2018), “PISA for Development Mathematics Framework”, in PISA for Development Assessment and Analytical Framework: Reading, Mathematics and Science, OECD Publishing, Paris, https://dx.doi.org/10.1787/9789264305274-5-en.
[9] OECD (2016), Equations and Inequalities: Making Mathematics Accessible to All, PISA, OECD Publishing, Paris, https://dx.doi.org/10.1787/9789264258495-en.
[2] OECD (2014), PISA 2012 Results: What Students Know and Can Do (Volume I, Revised edition, February 2014): Student Performance in Mathematics, Reading and Science, PISA, OECD Publishing, Paris, https://dx.doi.org/10.1787/9789264208780-en.
[8] OECD (2010), Mathematics Teaching and Learning Strategies in PISA, PISA, OECD Publishing, Paris, https://dx.doi.org/10.1787/9789264039520-en.
[7] OECD (2004), Learning for Tomorrow’s World: First Results from PISA 2003, PISA, OECD Publishing, Paris, https://dx.doi.org/10.1787/9789264006416-en.
Notes
← 1. Mathematics was the major domain assessed in 2003 and 2012. In the 2018 PISA assessment, an update on overall performance in mathematics is presented. For more in-depth analyses of the mathematics assessment and student performance in mathematics, see the reports based on data from PISA 2003 and PISA 2012 (OECD, 2004[7]; OECD, 2010[8]; OECD, 2014[2]; OECD, 2016[9]; Echazarra et al., 2016[10]).
← 2. Only one item included in the PISA 2018 paper-based assessment was not included in the PISA 2018 computer-based assessment. As a result, the total number of items in the paper-based assessment is 83, while the total number of items in the computer-based assessment is 82 (see Annex A5 for details).
← 3. While the number of 15-year-olds who are covered by the PISA sample is estimated from school-enrolment estimates (for all schools) and from student lists (for sampled schools), the total population of 15-year-olds is based on demographic projections provided by PISA national centres. The difference between the two numbers may also reflect errors in the projections. Fifteen-year-olds who are not represented by PISA samples also include students and schools that were excluded from sampling (see Chapter 3 and Annex A2) and a small fraction of students who were in the process of transferring between schools at the time of the PISA test.