
Gross pension wealth
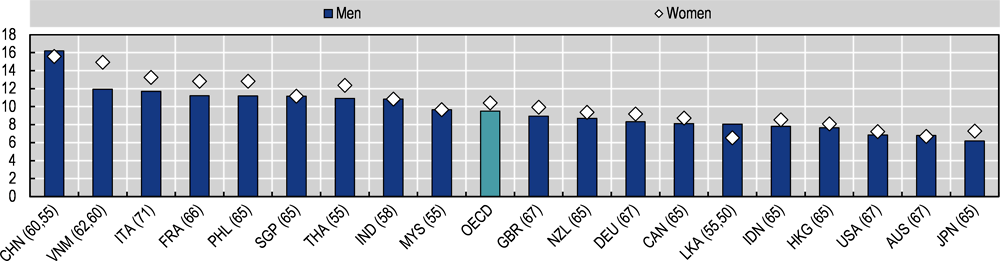
Pension wealth relative to individual earnings before retirement measures the total discounted value of the lifetime flow of all retirement incomes in mandatory pension schemes at retirement age. For average earners, pension wealth for men is 10.1 times and for women 10.7 times annual individual earnings on average in Asian economies. Gross pension wealth relative to annual individual earnings is higher for women because of their longer life expectancy. The main determinants of differences across countries are differences in the gross replacement rate, in the length of the retirement period measured by remaining life expectancy at the normal retirement age, and in indexation rules.
Replacement rates give an indication of the pension promise relative to individual earnings, but they are not comprehensive measures of cumulated pension payments; they look only at the benefit level relative to individual earnings at the point of retirement, or more generally at a given, later age. For a full picture, life expectancy, normal retirement age and indexation of pension benefits must also be taken into account. Together, these determine for how long the pension benefit is paid, and how its value evolves over time. Pension wealth – a measure of the stock of future discounted flows of pension benefits – takes account of these factors. It can be thought of as the lump sum needed at the retirement age to buy an annuity giving the same flow of pension payments as that promised by mandatory retirement-income schemes.
In defined benefit systems there is often no or a weak link between the replacement rate and the expected duration of benefit withdrawal. However, in the long run, ensuring financial sustainability imposes a trade-off between the replacement rate and the duration of retirement. When retirement ages and pension benefits are held constant, pension wealth increases with longevity gains. In defined contribution systems there is a more direct link between the size of the benefit and the expected duration of benefit withdrawals. In these systems the pension wealth measure is equal to the accumulated assets and therefore independent of longevity increases as these automatically reduce the monthly benefits.
Gross pension wealth at individual earnings equal to the average wage is highest in China at 16.2 times annual individual earnings for men and 15.6 times for women. It is also larger than 11 times for men and women in the Philippines, Singapore and Viet Nam. The lowest pension wealth for both men and women is found in Pakistan at 5.8 and 6.8, respectively, due to low replacement rates, while Hong Kong (China), Indonesia and Sri Lanka are all around 8 times for men and women.
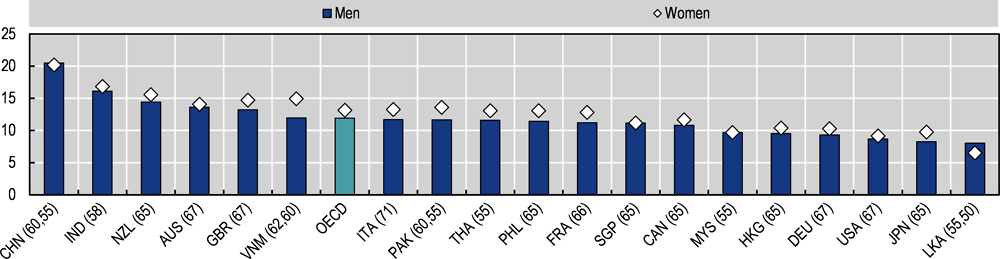
This indicator is built based on the gender-specific average mortality rates within countries. It thus assumes away differences in life expectancy across income levels. Given that individuals with low (high) income generally have a lower (higher) life expectancy, this implies that the computed numbers overestimate pension wealth for low earners and underestimate it for high earners. With this caveat in mind, higher individual replacement rates for low earners than for average earners mean that the computed pension wealth relative to individual earnings is also higher for low earners. For men with individual earnings equal to half average-earnings, pension wealth is 11.8 times their annual earnings on average and it is 12.5 times for women. In the economies where pension wealth for low earners is highest (China and India), its value is 20 and 16 times individual earnings for men, respectively and 20 and 17 times individual earnings for women.
Impact of life expectancy
In countries where the duration in retirement is shorter, such as Indonesia and Pakistan, pension wealth is smaller. The effect is the opposite in Hong Kong (China) and Singapore, where life expectancy is high. Similarly, since women’s life expectancy is longer than men’s, pension wealth for women is higher in all countries that use unisex mortality tables to compute annuities or that have defined benefit systems. In addition, some countries still have lower retirement ages for women; this extends the payment period even further.
Impact of indexation
Pension wealth is affected by indexation rules at a given initial replacement rate level. China has a discretionary indexation to a mix of wages and prices but all other Asian economies index to prices when they have a withdrawal system in place. Those with lump-sum withdrawals are assumed to have a price indexed annuity for comparison purposes.
Definition and measurement
The calculation of pension wealth uses a uniform real discount rate of 2%. Since the comparisons refer to prospective pension entitlements, the calculations use country-specific mortality rates by age and sex at the year of retirement. Pension wealth is expressed as a multiple of gross annual individual earnings.
Source: OECD pension models.
Source: OECD pension models.