
9. Benchmarking countries
Chapter 9 addresses the benchmarking of countries. Although Chapter 5 summarises the mastery levels across countries, equally weighting the countries because of sample size differences, the current chapter discusses the results by country without disclosing the nationalities. The countries are labelled A through E for anonymity. The data presented include only countries that tested entering and exiting students, which are Chile, Finland, Mexico, the United Kingdom and the United States. Italy tested exiting students only and, therefore, is not included in these results.
The first section of the chapter presents the mastery levels for entering and exiting students by country. The second section of the chapter covers the summary statistics for entering and exiting students by country. Both sections together provide insight into student performance on the CLA+ by examining patterns of performance across countries.
Table 9.1 presents the percentage of entering and exiting students at each mastery level by country. The difference between the percentage of exiting and entering students is shown in the row labelled “Difference” (exiting minus entering). The expectation is that exiting students would perform better than entering students given that exiting students have completed several years of post-secondary education. We would expect to see a lower percentage of exiting students classified into the Emerging and Developing mastery levels (negative difference) and a higher percentage of exiting students classified into the Proficient, Accomplished and Advanced mastery levels (positive difference). The results show this is generally the case for four of the five countries. Country C shows small percentage differences across the mastery levels, some of which are in the direction opposite to what is expected (e.g. a slightly higher percentage of students in the exiting cohort are classified as Developing compared to entering students). The results for Country C suggest that students’ performance on the CLA+ was similar for entering and exiting students.

Figure 9.2 shows a different perspective. It presents the mastery level percentage difference values (exiting minus entering) found in Table 9.1 by country and mastery level. Although the patterns are the same for Countries A, B, D and E, the results for Countries D and E show more dramatic changes than Countries A and B. That is, the percentage of students classified into each mastery level differs to a greater extent based on entering and exiting status.

Several factors come into play when interpreting cross-country results:
Do post-secondary education systems support the development of critical thinking skills?
Are there systematic differences in the entering and exiting student groups? High-achieving entering students and low-achieving exiting students will show smaller differences than low-achieving entering students and high-achieving exiting students.
Given that each country’s education system and political environment are unique, the other chapters in the book provide insight into the purposes and goals for administering the CLA+ to the samples of students chosen to participate. The growth between entering and exiting students’ skills may be interpreted in the context of those factors.
The importance of effort and engagement on CLA+ scores was highlighted in Chapter 5. Students who reported high interest and engagement in the Selected-Response Question (SRQ) and Performance Task (PT) sections achieved higher section scores. The results tended to be linear. With each successive endorsement of a higher rating of effort and engagement, there was an incremental increase in PT and SRQ section scores.
Another means of assessing effort and motivation is to look at whether students used all the allotted time to complete the SRQ and PT sections. Typically, we find that most students do not use all the time. On occasion, some of the students do not answer the final few questions on the SRQ section. Between time use and question response, we hypothesise that motivation may be a factor for some students.
Summary statistics
This section presents CLA+ summary results by country and cohort. Table 9.2 shows the mean, the 25th and 75th percentile rank scores, and the interquartile range for entering and exiting students. The difference between the mean exiting and entering student scores is presented in the last column (mean difference). These percentile rank scores convey variability in student scores that is not subject to the outlier values.
Surprisingly, the average CLA+ total scores across countries were relatively similar. For example, the lowest and highest average CLA+ total scores for entering students were 1 060 and 1 111, respectively. However, the lowest value was classified as the Developing mastery level and the highest value was classified as the Proficient mastery level. The largest mean differences between exiting and entering students were observed for Countries D and E for each CLA+ test component. These results provide a consistent picture with the results presented above. There were greater score gains from the entering to exiting cohorts for Countries D and E compared to the other countries. The mean difference values for Country C indicate that the performance of entering and exiting students was similar.
The interquartile ranges were widest for the CLA+ SRQ score for each country. Recall that the SRQ section is out of 25 raw score points, compared to 18 raw score points for the PT. However, the largest mean difference values were observed for the PT section scores, indicating a gain in written communication skills measured by the CLA+ assessment.
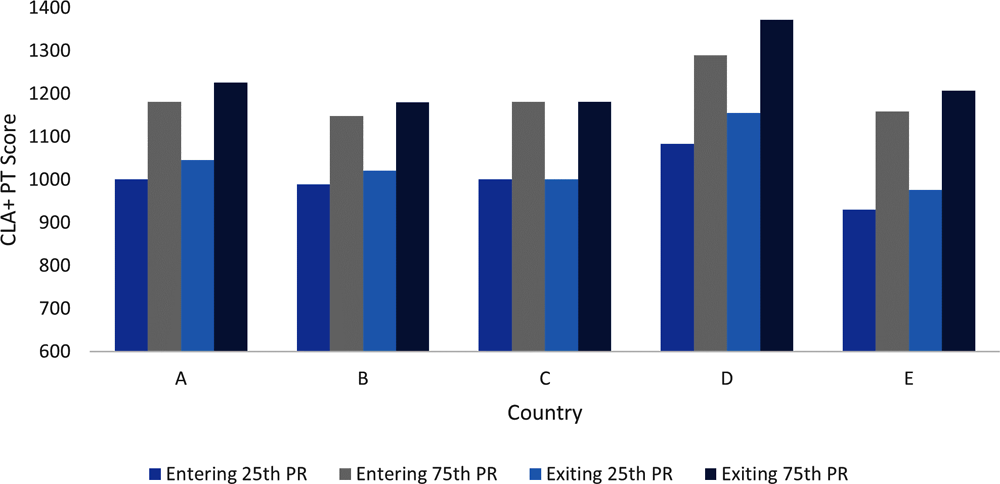
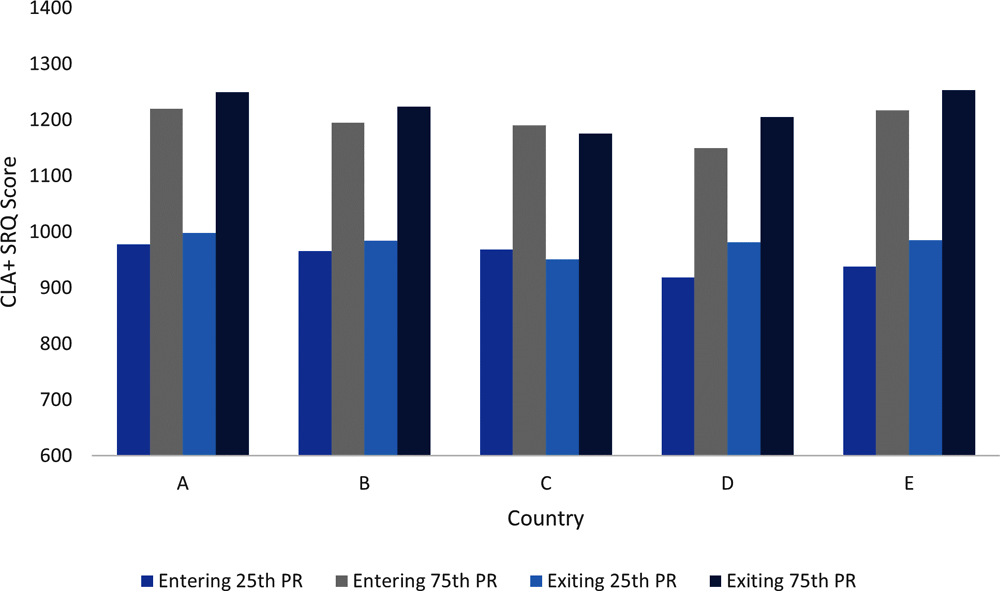
To get a sense of how these values compare across countries, Figure 9.3, Figure 9.4 and Figure 9.5 illustrate the scale scores at the 25th and 75th percentile ranks by cohort and country for the CLA+ total test score, PT section score and SRQ section score, respectively. The first thing to notice across the figures is the variability across countries. The differences are more pronounced for the PT section compared to the SRQ section and total test score. For example, compare Countries D and E for the PT results. Educational systems may place different emphasis on written communication skills, resulting in higher achievement for some countries. Overall, these results suggest that different countries tend to have different strengths on the PT and SRQ sections.

Chapter 9 addressed the benchmarking of countries by discussing the country-level results without disclosing the nationalities. These results provide insight into the patterns of performance on the CLA+ across countries. The first section of the chapter presented the mastery levels for entering and exiting students by country. As expected, a lower percentage of exiting students were classified into the Emerging and Developing mastery levels and a higher percentage of exiting students classified into the Proficient, Accomplished and Advanced mastery levels compared to their entering university peers. One exception was observed. Student performance was similar for the entering and exiting students for one country.
The second section of the chapter presented summary statistics for entering and exiting students by country. The 25th and 75th percentile rank values showed variability across countries. Differences were more pronounced for the Performance Task (PT section) compared to the Selected-Response Question (SRQ) section and total test scores. Overall, these results suggest that the five countries display different levels of variability in CLA+ scores and display relative strengths and weaknesses on the PT and SRQ sections.