Chapter 6. Evolution of the tax burden (2000-18)
The chapter presents the evolution of the tax burdens on labour income between 2000 and 2018. The chapter contains Tables 6.1 to 6.24 that are grouped by tax measures for the eight household types: Tables 6.1 to 6.8 containing the (average) tax wedge comprising income taxes plus employee and employer social security contributions (including any applicable payroll taxes) less cash benefits; Tables 6.9 to 6.16 providing the (average) burden of personal income taxes; and the Table 6.17 to 6.24 depicting the (average) burden of income taxes plus employee social security contributions less cash benefits (net personal average tax rates).
Historical trends
The evolution of the tax burden for the eight household types over the period 2000 to 2018 is presented in Tables 6.1 to 6.24 in the last section of this chapter titled “Tables showing income taxes, social security contributions and cash benefits”. Each of the Tables 1 to 24 corresponds to a tax burden measure for a particular household type.
The discussion focuses on the main observable trends over the period and highlights selected important year-to-year changes1.
Important trends
The OECD average tax wedge, the personal income tax burden and the net tax burden (personal income tax plus social security contributions less cash benefits) have all declined between 2000 and 2018 for each of the selected household types.
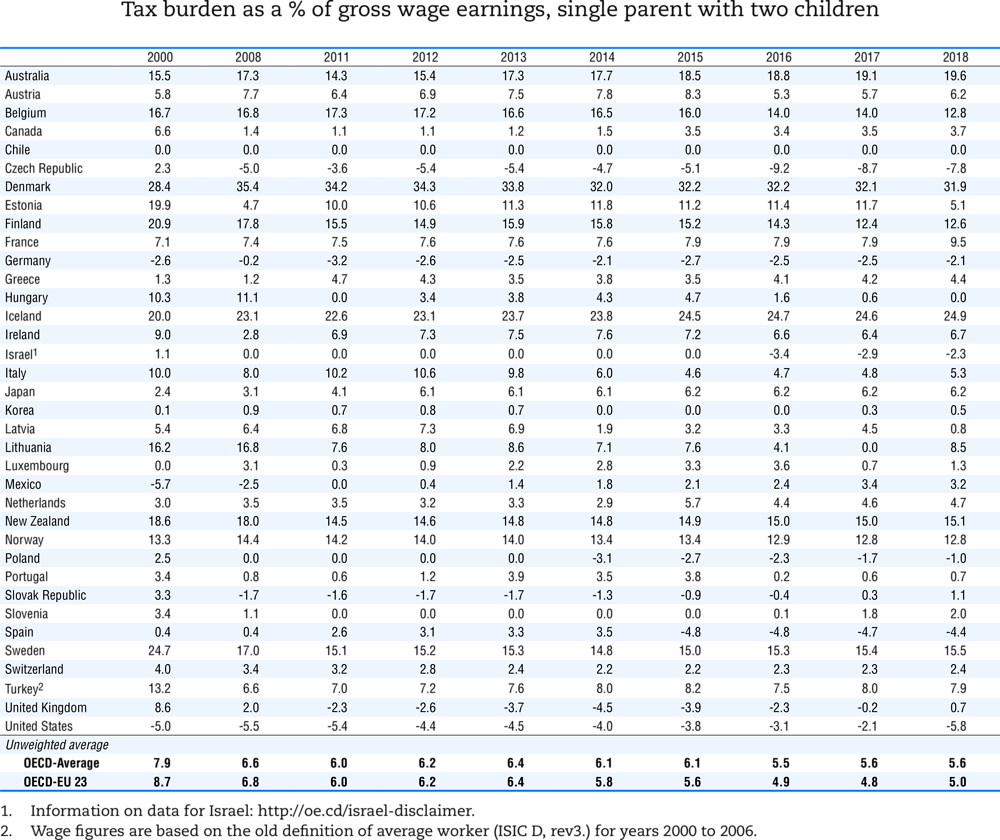
The reductions over the period in the OECD average tax wedge ranged from 1.3 percentage points (for single persons on average wage (AW) and the single worker earning 167% of the AW) to 4.1 percentage points (for single parents at 67% of the AW).
The decrease in the OECD average personal income tax burden ranged from 0.9 percentage points (for single persons on AW) to 2.3 percentage points (for single parents at 67% of the AW).
The OECD net personal average tax burden has also declined for all household types in the period considered. The reduction ranged from 0.8 percentage points (for single persons on AW) to 3.6 percentage points (for single parents at 67% of the AW).
Tax wedge
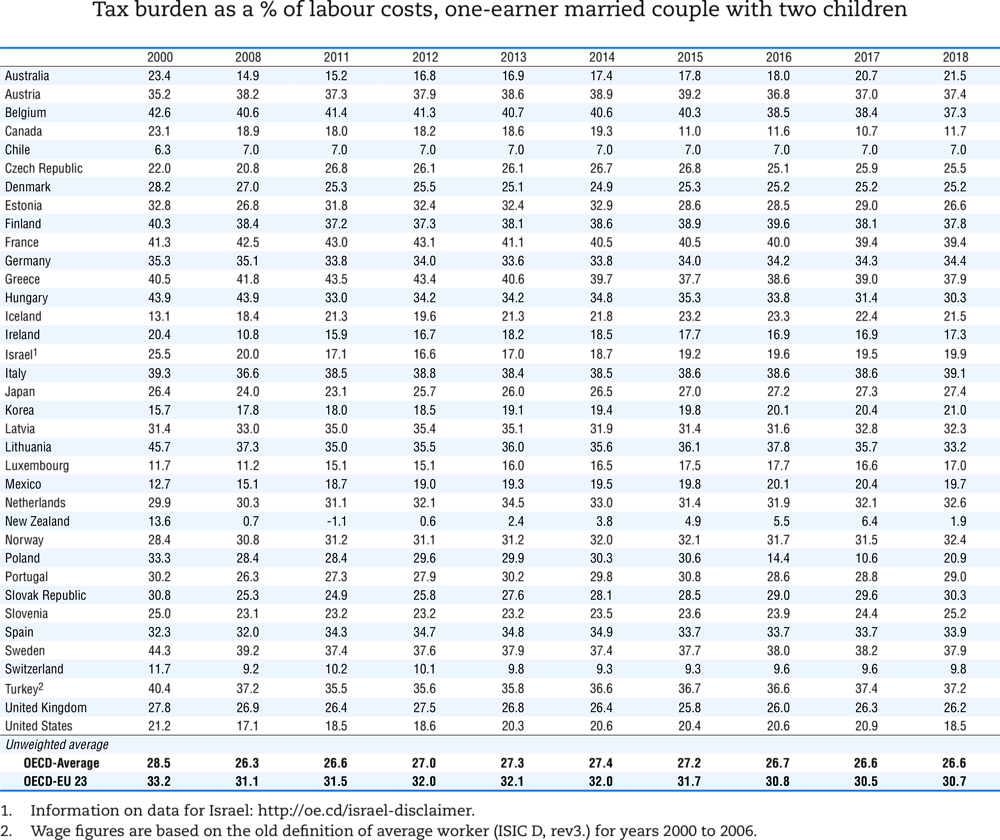
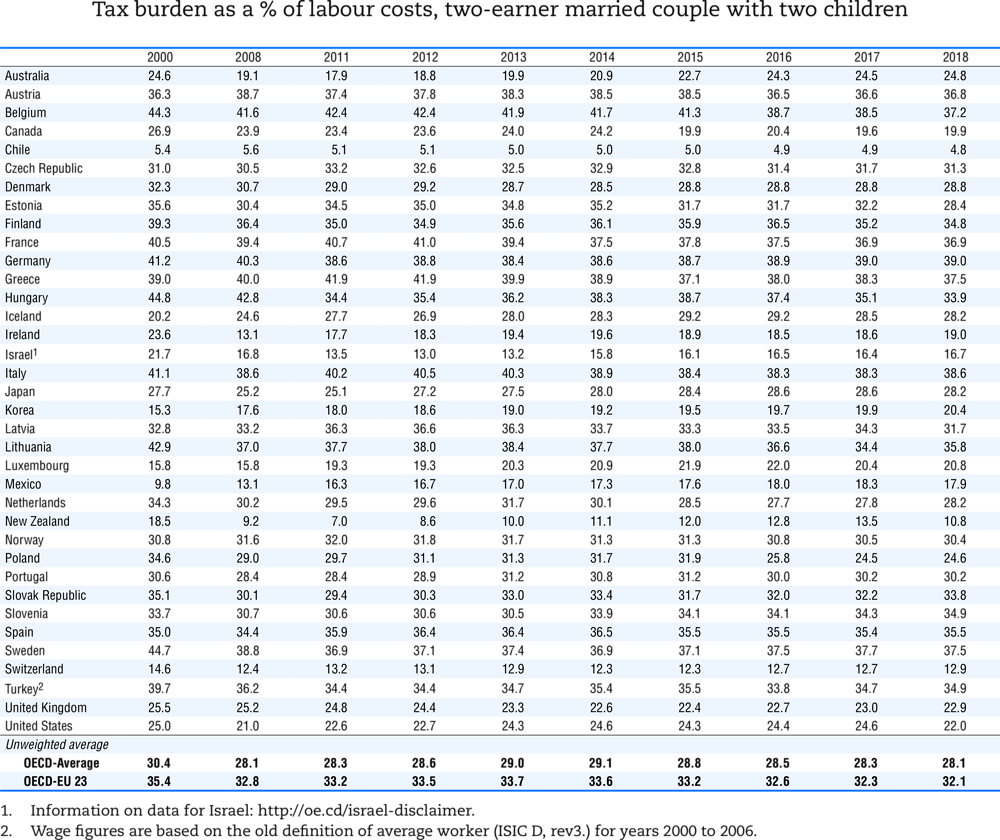
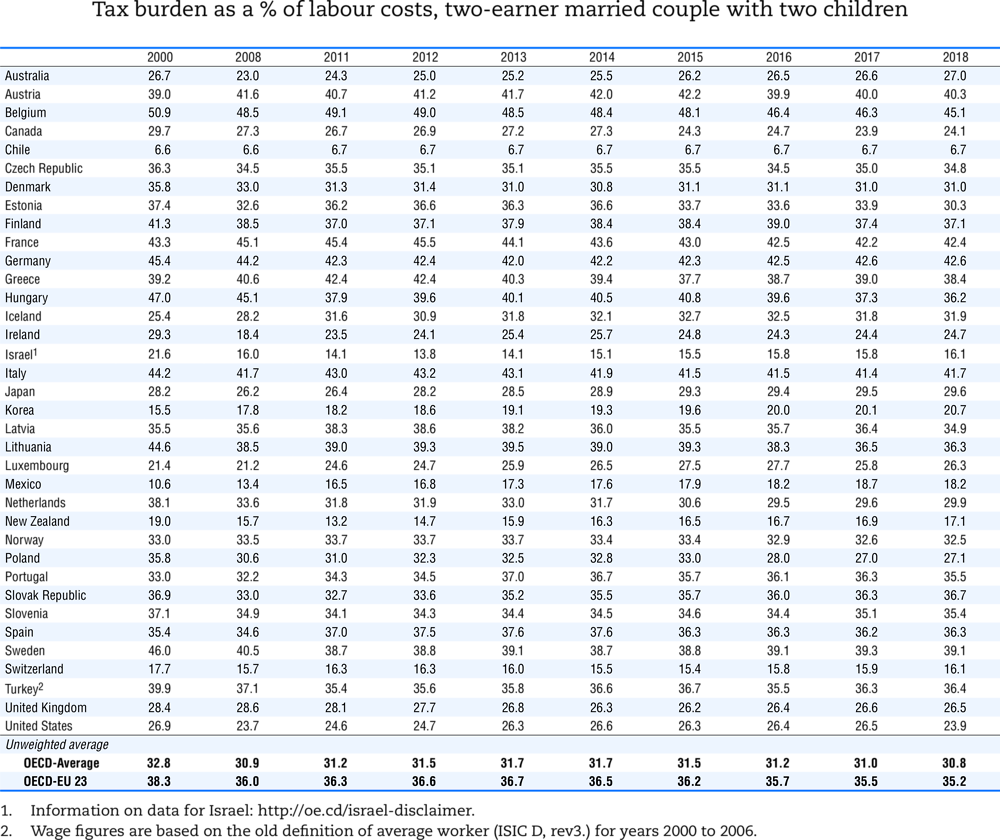
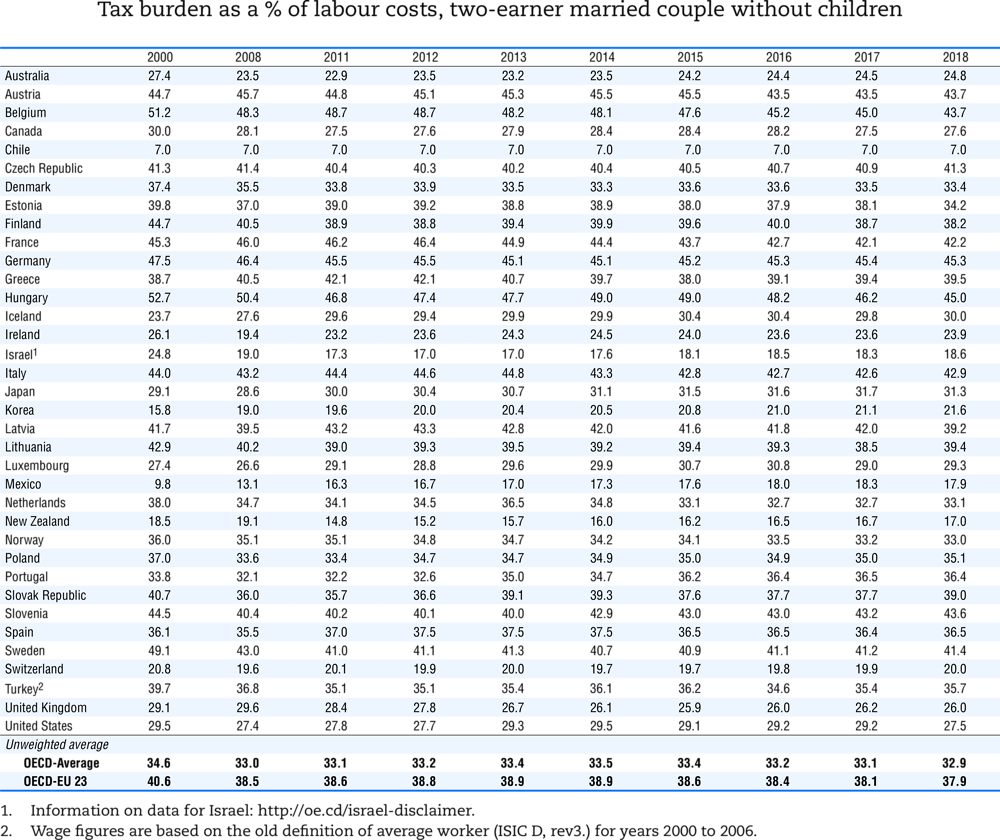
Focusing on the overall (average) tax wedge (Tables 6.1 to 6.8), there are fifteen OECD member countries with a reduction of more than 5 percentage points between 2000 and 2018 for at least one household type – Belgium, Canada, Denmark, Estonia, Finland, France, Hungary, Ireland, Israel, Lithuania, the Netherlands, New Zealand, Poland, Sweden and Turkey.
The largest decline was observed in Poland where the single parent benefited from a reduction in the tax wedge of 41.8 percentage points. In the latter country, the one-earner couple on the AW with children also experienced a large decrease in the tax wedge, by 12.4 percentage points. Reductions of more than 10 percentage points in the tax wedge for at least one household type were also observed in Canada, Hungary, Ireland, Lithuania, the Netherlands and New Zealand.
In Canada, the tax wedge decreased by 14.9 percentage points for the single parent at 67% of the AW and by 11.4 percentage points for the one-earner married couple on the AW with two children. In Hungary, there were reductions of more than 10 percentage points for five out of the eight household types. The largest decreases were for the single person earning 167% of the AW (14.1 percentage points) and the one-earner married couple, with two children, earning the AW (13.6 percentage points). In Ireland, the tax wedge decreased by 13.4 percentage points for the single parent on 67% of the AW. In Lithuania, there were decreases of more than 10 percentage points for the one-earner couple on the AW with children (12.5 percentage points) and the single parent on 67% of the AW (12.4 percentage points). In the Netherlands, the tax wedge decreased by 19.3 percentage points for the single parent on 67% of the AW and by 11.5 percentage points for the single person on 67% of the AW without children. In New Zealand, the single parent earning 67% of the AW benefited the most from the reduction in the tax wedge (17.5 percentage points). It also decreased by 11.6 percentage points for the one-earner married couple earning the AW with two children.
In contrast, between 2000 and 2018, there were increases in the tax wedge of more than 5 percentage points for at least one household type in seven countries – the Czech Republic, Iceland, Korea, Luxembourg, Mexico, Norway and Turkey. The largest increase was in Iceland where the tax wedge raised by 13.6 percentage points for the single parent on 67% of the AW and also by between 6 and around 9 percentage points for five other household types. In the Czech Republic, it increased by 8.8 percentage points for the single parent on 67% of the AW. In Mexico, seven of the household types experienced increases between 7 and around 8 percentage points. In Turkey, the single person earning 167% of the AW had the tax wedge increased by 7.5 percentage points. In Korea, there were increases between 5 and around 7 percentage points for five of the household types. In Norway, it increased by 6.0 percentage points for the single parent on 67% of the AW. In Luxembourg, the tax wedge raised by 5.3 percentage points for the one-earner couple on AW with children.
The tax wedge has decreased for all household types in fifteen of the OECD member countries (Belgium, Canada, Denmark, Estonia, Finland, Germany, Hungary, Ireland, Israel, Lithuania, New Zealand, Poland, Sweden, Switzerland and the United States) while it has increased across all household types in three countries (Korea, Luxembourg and Mexico).
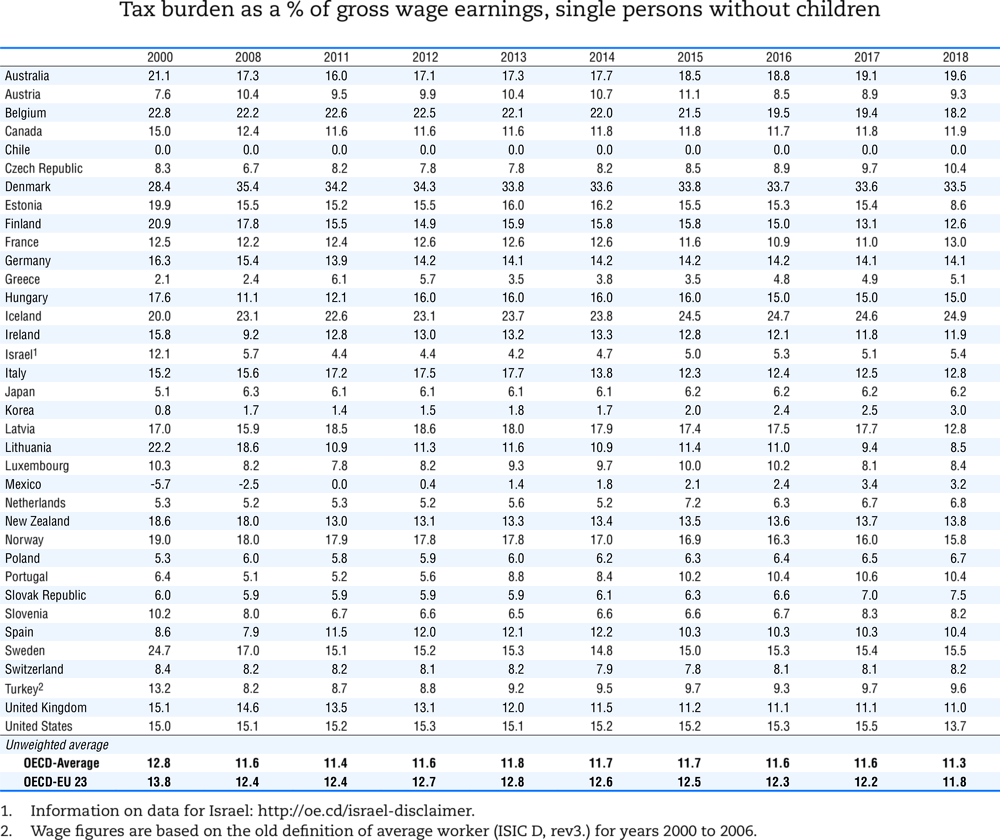
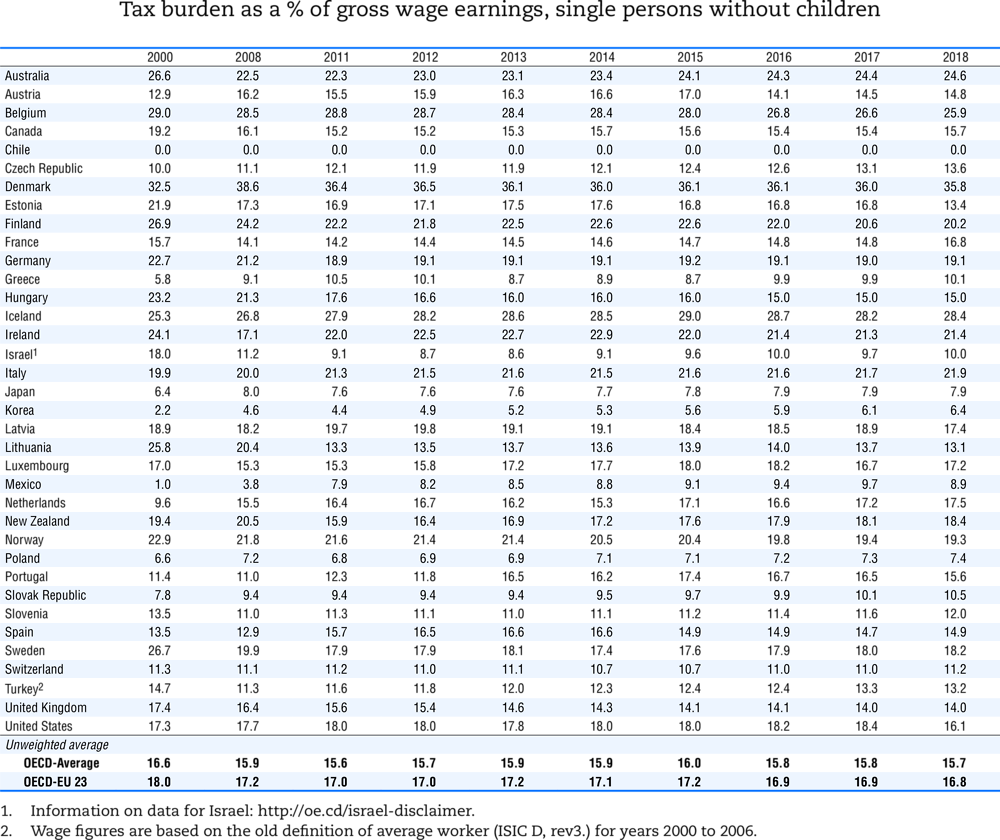
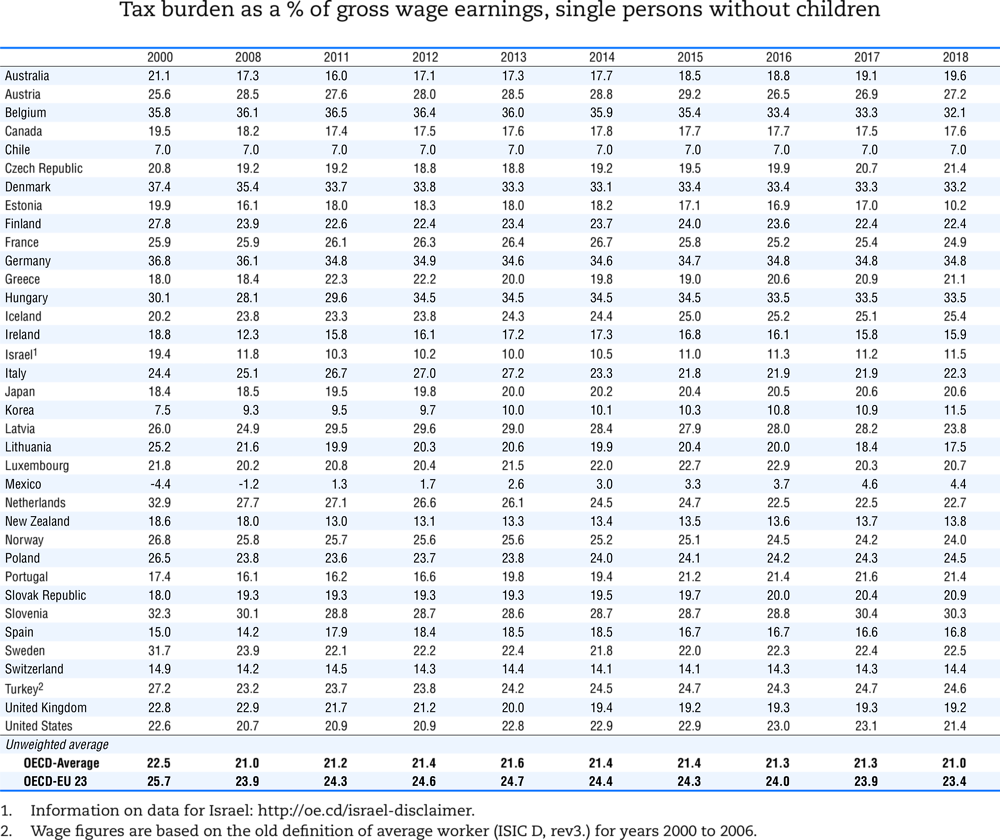
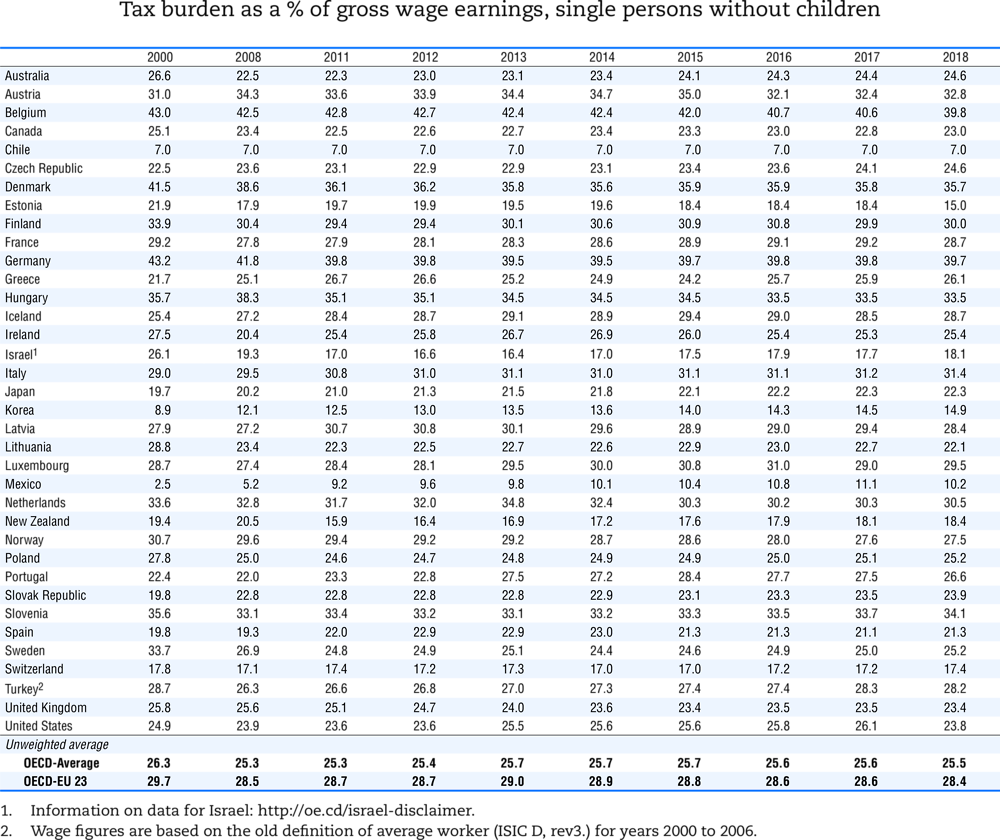
Average personal income tax rate
Between 2000 and 2018, the average personal income tax burden (Tables 6.9 to 6.16) decreased for the eight household types in fifteen of the OECD member countries: Belgium, Canada, Estonia, Finland, Hungary, Israel, Latvia, Lithuania, New Zealand, Slovenia, Sweden, Switzerland, Turkey, the United Kingdom and the United States. Among those countries, the most significant reductions affecting most of the household types are noted in Hungary where there were significant decreases of 15.3 percentage points for the single person earning 167% of the AW, 13.5 percentage points for the one-earner married couple earning the AW with children, and 10.3 percentage points for the single parent earning 67% of the AW with two children. For the latter household type, there was a reduction of 14.8 percentage points during the same period in Estonia where all the other household types also experienced reduced average personal income tax rates. For the other household types, they decreased by between 8.5 and 11.5 percentage points except for the single worker on 167% of the AW (3.9 percentage points). In Lithuania, the average personal income tax rates decreased by between 13.7 and 12.2 percentage points for most of the household types, the exception being the single parent on 67% of the AW. For the latter it decreased by 7.7 percentage points. In Sweden, seven out of the eight household types had decreases of around 9 percentage points except the single taxpayer earning 167% of the AW for whom the decrease was 4.3 percentage points. In Finland, it decreased by 6 to around 8 percentage points for all the household types. In Israel, the average income tax rate decreased by 6 to around 8 percentage points for all the household types except for the single parent at 67% of the AW who had a reduction of 3.4 percentage points. Other decreases of more than 5 percentage points were observed in the United Kingdom for the single parent at 67% of the AW (7.9 percentage points), Belgium for two-earner couples with and without children (up to 6 percentage points) and Turkey for the single parent at 67% of the AW (5.4 percentage points).
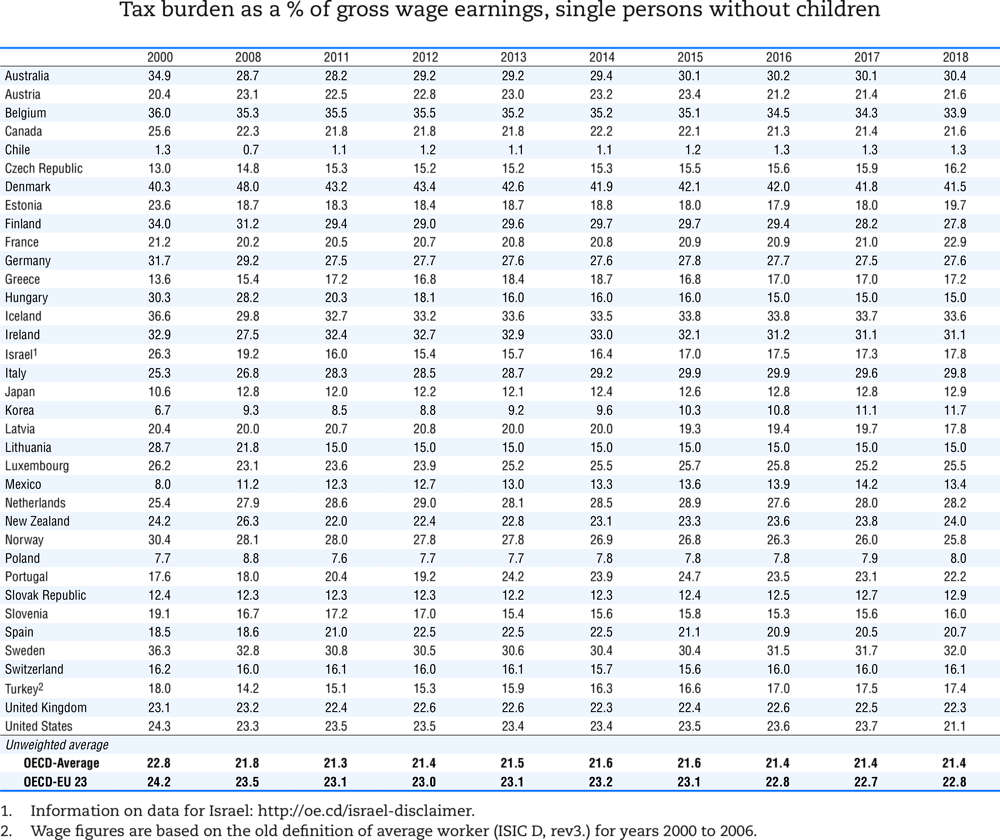
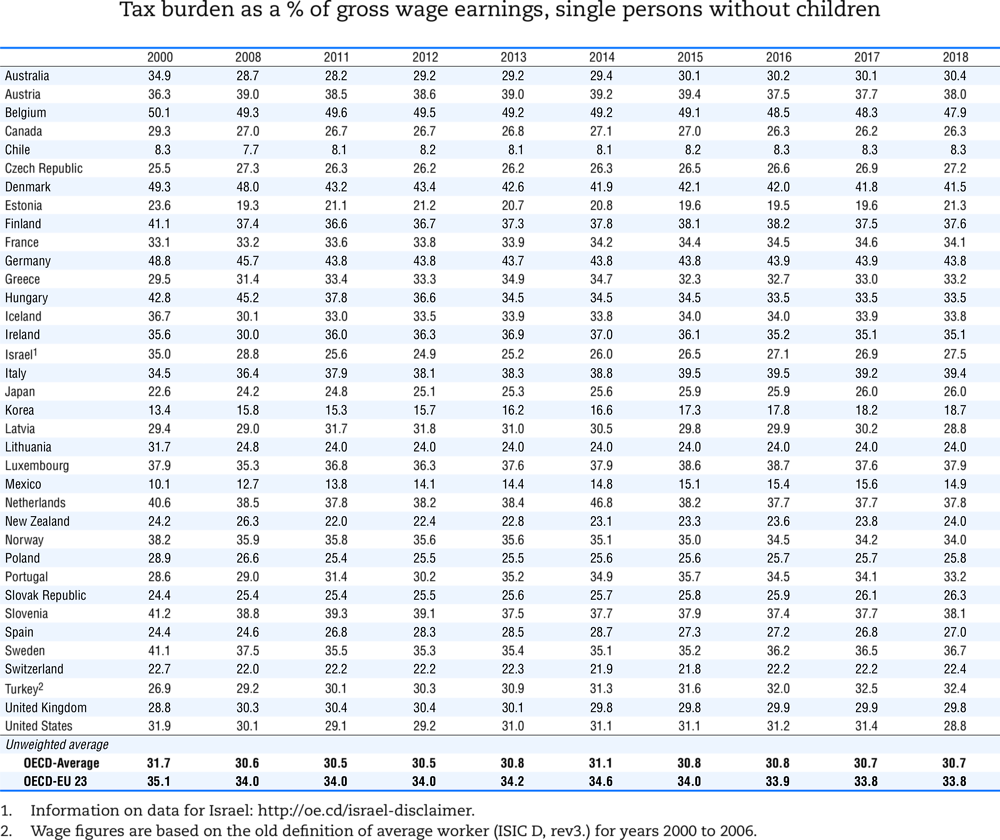
At the other extreme, the average personal income tax rate increased across all the eight household types in eight OECD member countries: Austria, Denmark, France, Greece, Japan, Korea, Mexico and the Netherlands. In the Netherlands, there were increases of 12.3 percentage points for the one-earner married couple with two children and 7.9 percentage points for the single person on AW. In Mexico the increases were within a range of 5 to 9 percentage points over the eight household types. The average personal income tax rates increased by more than 5 percentage points in Denmark for the one-earner couple on AW with children (5.9 percentage points), the two-earner couples on 133% of the AW with or without children (both 5.4 percentage points) and the single person at 67% of average earnings without children (5.01 percentage points),.
There were twelve other OECD member countries with both reductions and increases in the average personal income tax among the household types: Australia, the Czech Republic, Germany, Iceland, Ireland, Italy, Luxembourg, Norway, Poland, Portugal, the Slovak Republic and Spain. Significant changes were observed in the Czech Republic where there were reductions of 10.1 percentage points for the single parent on 67% of the AW and 9.1 percentage points for the one-earner couple on AW with children, and in Iceland where there was an increase of 5.2 percentage points for the one-earner couple on the AW with children.
In contrast, in Chile the average income tax rates stayed constant for all the household types between 2000 and 2018.
Net personal average tax rate
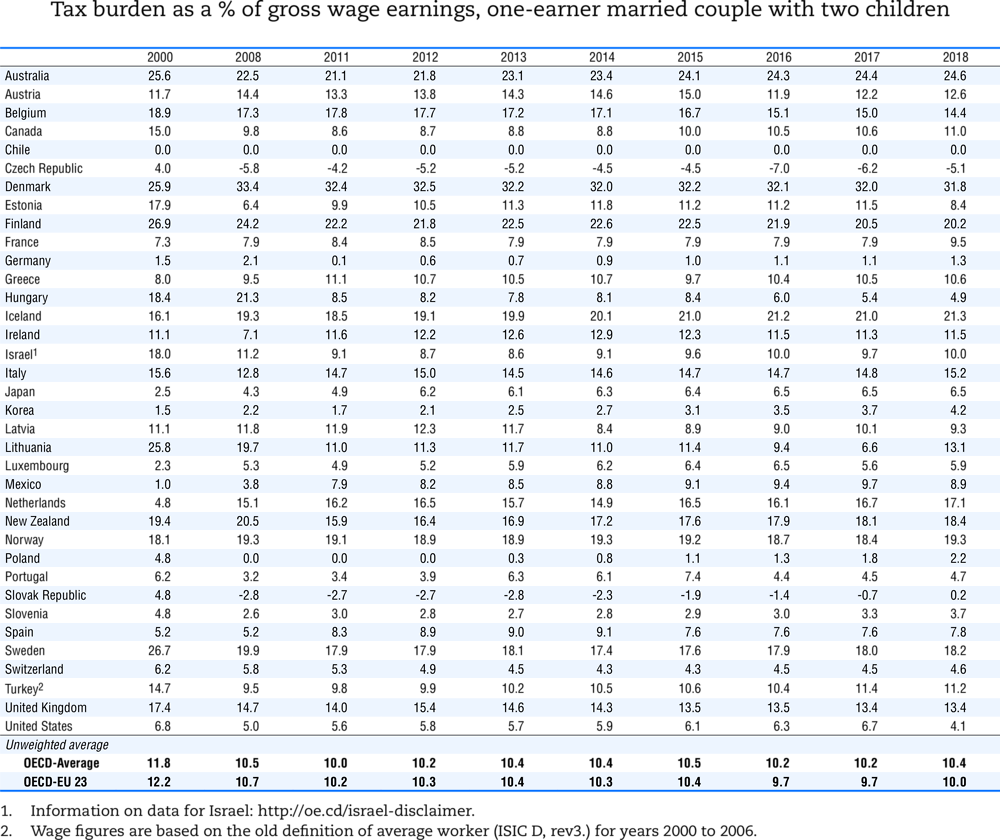
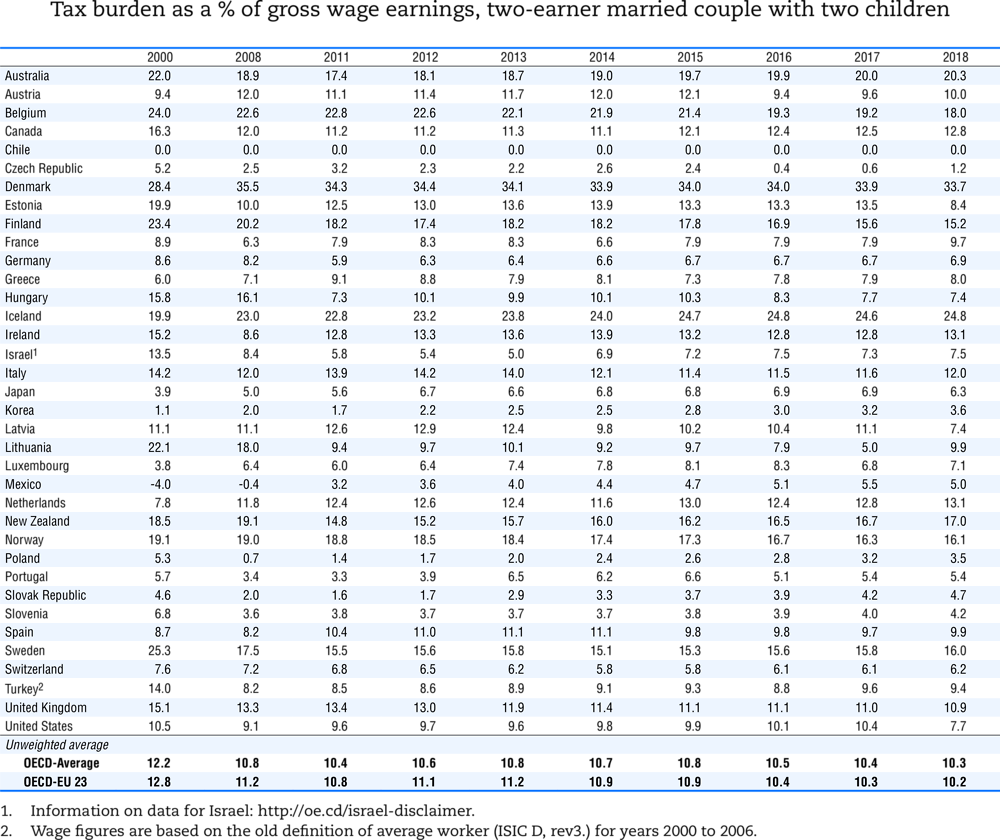
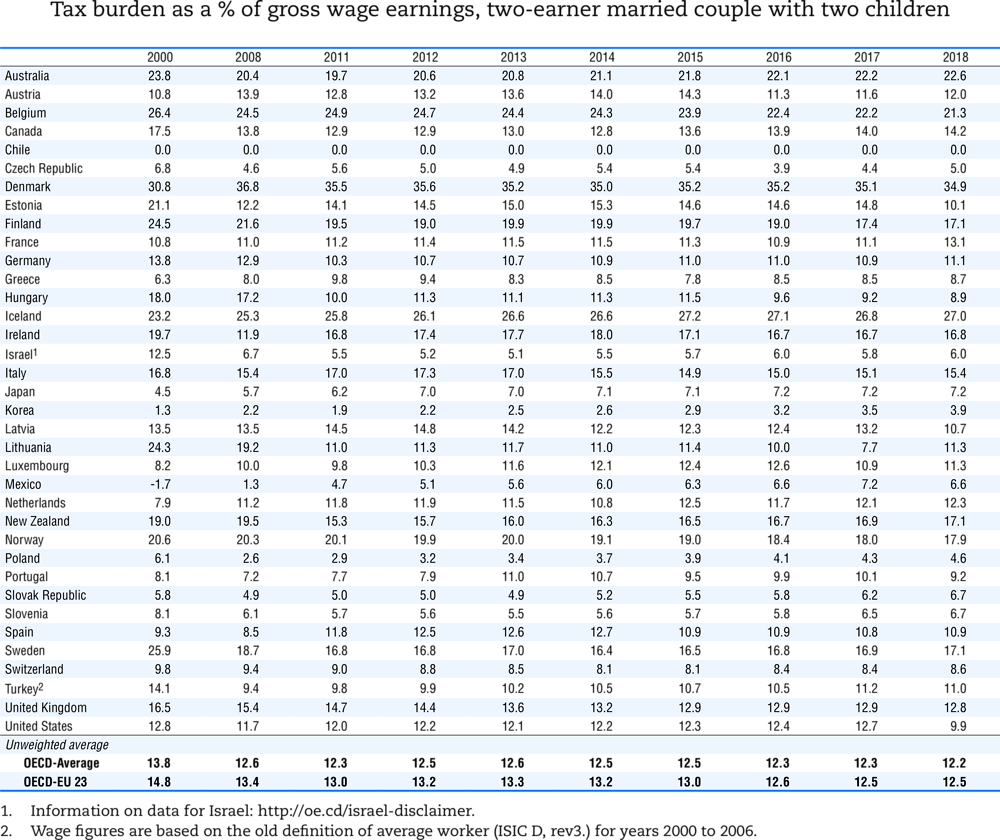
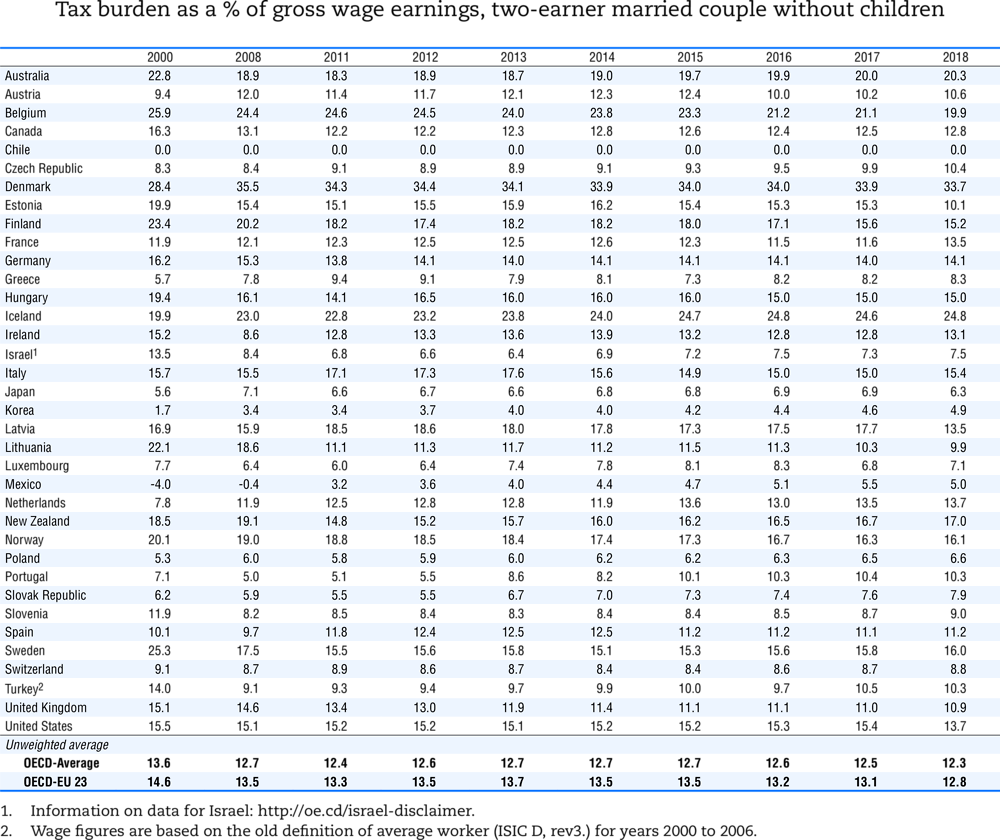
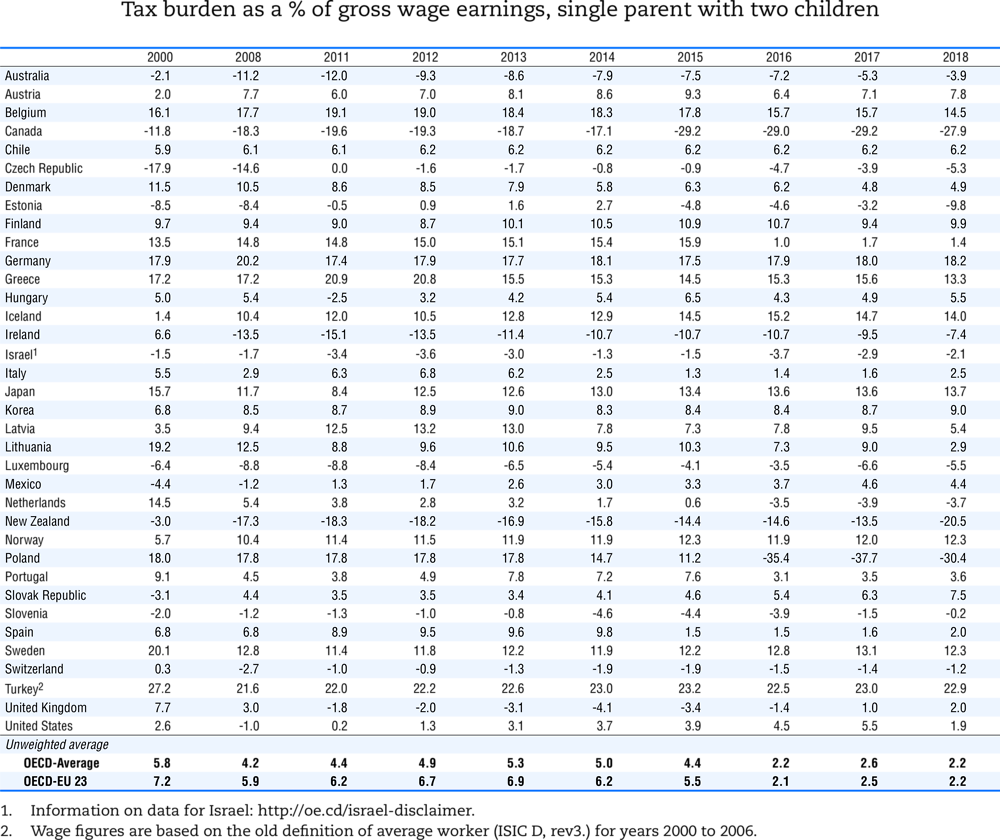
The net personal average tax rate takes into account personal income taxes and employee social security contributions as well as cash benefits (Tables 6.17 to 6.24). It decreased between 2000 and 2018 for the eight household types in twelve OECD countries: Belgium, Canada, Denmark, Estonia, Ireland, Israel, Lithuania, New Zealand, Poland, Sweden, Switzerland and the United States. Among those countries, the most significant reductions were observed in Poland, where the net personal average tax rate fell by 48.4 percentage points for the single parent earning 67% of the AW and by 14.2 percentage points for the one-earner married couple on AW with two children. In New Zealand, the net personal average tax rate decreased by 17.5 percentage points for the single parent on 67% of the AW. In Lithuania, it decreased by between 6 and around 16 percentage points for all the household types. The highest decrease was observed for the one-earner couple on the AW with children (16.4 percentage points) and the single parent on 67% of the AW (16.3 percentage points). There were decreases of more than 10 percentage points also in Canada for the single parent on 67% of the AW (16.1 percentage points) and the one-earner couple on the AW with children (12.3 percentage points), in Ireland for the single parent on 67% of the AW (13.9 percentage points) and in Estonia for the two-earner couple on 133% of the AW with children (10.6 percentage points). In Sweden, seven out of the eight household types had reductions in net personal average tax rates exceeding 7 percentage points. It decreased the most for the two-earner couple on 133% of the AW without children (9.4 percentage points) and for the single person on 67% of the AW without children (9.2 percentage points). In Israel reductions ranging between 5 and 8 percentage points were observed for all but one household type, the exception being the single parent on 67% of the AW for whom the reduction was 0.6 percentage points. In Denmark, there were decreases for all household types and three of them saw decreases of above 5 percentage points ranging from 5.8 (for the single person earning the AW without children) to 7.8 (for the single person earning 167% of the AW). In Belgium, the net personal average tax rate decreased by more than 6 percentage points for the two-earner couples on 133% of the AW with or without children (6.7 and 7.5 percentage points respectively).
In contrast, the net personal average tax rate increased across all household types in four OECD member countries: Austria, Korea, Mexico and the Slovak Republic. All of those countries experienced increases of more than 5 percentage points. The largest change was in the Slovak Republic where it increased by 10.6 percentage points for the single parent on 67% of the AW. In Mexico, the net personal average tax rates increased by between 7 and around 9 percentage points for all household types except the single person on 167% of the AW (4.8 percentage points). In Korea, the net personal average tax rate increased by 6.0 percentage points for the single person on the AW and by 5.3 percentage points for the single person on 167% of the AW. In Austria, the single parent experienced a rise of 5.7 percentage points in the net personal average tax rate.
There were twenty other OECD member countries with both reductions or increases in the net personal average tax rate among the household types: Australia, Chile, the Czech Republic, Finland, France, Germany, Greece, Hungary, Iceland, Italy, Japan, Latvia, Luxembourg, the Netherlands, Norway, Portugal, Slovenia, Spain, Turkey and the United Kingdom. There were significant decreases in the Netherlands where the net average personal tax rate fell by 18.3 percentage points for the single parent on 67% of the AW and by 10.3 percentage points for the single person on 67% of the AW without children. In France, there was a reduction of 12.1 percentage points for the single parent on 67% of the AW. In Hungary, the net personal average tax rate decreased by 9.3 percentage points for the single person on 167% of the AW without children. Reductions of more than 5 percentage points were also observed for the single parent on 67% of the AW in the United Kingdom (5.6 percentage points) and Portugal (5.5 percentage points), for the single person on 67% of the AW without children in Finland (5.5 percentage points) as well as for the two-earner couple on 133% of the AW without children in Finland (5.4 percentage points). In contrast, there were significant increases in the net personal average tax rate in Iceland where it increased by 12.6 percentage points for the single parent on 67% of the AW and by between 5 and around 7 percentage points for five other household types. In the Czech Republic, it increased by 12.6 percentage points for the single parent on 67% of the AW and by 5.6 percentage points for the one-earner couple on the AW with children. In Norway, there was an increase of 6.6 percentage points for the single parent on 67% of the AW. In Turkey the net personal average tax rate increased by 5.5 percentage points for the single person earning 167% of the AW.
Progressivity
The degree of progressivity of the personal income tax system can be assessed by comparing the burden faced by single persons earning 67% of the AW with that faced by their counterparts earning 167% of the AW. Hence Table 6.9 is compared with Table 6.11. For all OECD countries (except Hungary) and for all years between 2000 and 2018 the higher paid worker always pays a higher percentage of income in personal income tax than the lower paid worker. In Hungary, the exceptions are that the levels of tax burden are the same for both workers from 2013 onwards. In Mexico, from 2000 to 2010, the personal income tax was negative for the single persons earning 67% of the AW due to non-wastable tax credits.
On average, the progressivity of the personal income taxes increased in OECD countries. On average (excluding Mexico), the single person earning 67% of the AW paid 55% of the tax burden of the person earning 167% of the AW in 2000 and 53% in 2018.
Comparing the situation in each OECD country, personal income taxes have become more progressive in nineteen countries. The most significant changes were in Estonia where the tax burdens on lower paid worker fell from 85% to 43%, in Lithuania where it fell from about 77% to 57% and in Sweden where it decreased from 68% to 48%.
Between 2000 and 2018, personal income taxes became slightly less progressive (using this measure) in fourteen OECD countries: Australia, Austria, Denmark, Greece, Hungary, Iceland, Korea, Mexico, the Netherlands, Poland, Portugal, the Slovak Republic, Spain and the United States. The most significant changes occurred in Hungary where the ratio rose from about 58% of the higher paid person in 2000 to 100% from 2013 onwards and in Iceland where it rose from 55% in 2000 to 74% in 2018. The tax burden ratio remained at the same level in Chile, Japan and the Czech Republic in 2000 and 2018.
Families
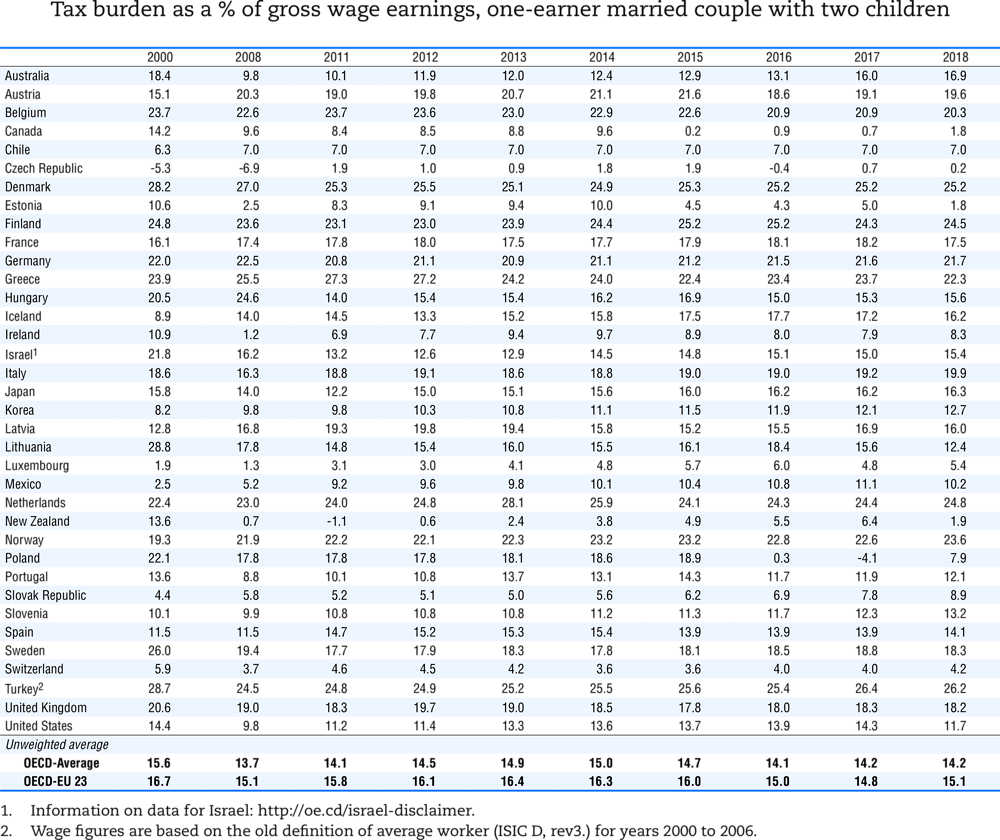
The results presented in Tables 6.21 and 6.18 can be used to compare the net tax burdens (personal income tax plus employee social security contributions less cash benefits) faced by a one-earner married couple earning the AW with two children, and the childless single person at the same income level. The OECD average tax savings for the married couple compared with the single person represented 10.7% of gross income in 2000 and 11.2% in 2018.
Between 2000 and 2018, the savings for the one-earner married couple increased in sixteen countries and declined in nineteen others. There were six countries where the tax savings have increased by more than 5 percentage points: in Poland increasing by 11.6 percentage points from 5.7% to 17.3% of gross income, in New Zealand increasing by 10.7 percentage points from 5.8% to 16.5% of gross income, in Canada increasing by 10.3 percentage points from 10.9% to 21.2% of gross income, in Lithuania increasing by 9.8 percentage points from 0% to 9.8% and in Portugal increasing by 5.7 percentage points from 8.8% to 14.5% of gross income. There were corresponding reductions of more than 5 percentage points in Norway where the tax savings decreased by 7.5 percentage points from 11.4% to 3.9% of gross income and in the Netherlands with a reduction in the tax savings by 5.6 percentage points from 11.2% to 5.6% of gross income.
Tables showing the income taxes, social security contributions and cash benefits
The evolution of the income taxes, social security contributions and cash benefits for the eight household types across the OECD over the period 2000 to 2018 is presented in Tables 6.1 to 6.24.
-
Tables 6.1 to 6.8 containing the (average) tax wedge comprising income taxes plus employee and employer social security contributions (including any applicable payroll taxes) less cash benefits,
-
Tables 6.9 to 6.16 providing the (average) burden of personal income taxes, and the
-
Tables 6.17 to 6.24 depicting the (average) burden of income taxes plus employee social security contributions less cash benefits (net personal average tax rates).
Tables 6.25 and 6.26 show the average gross and net earnings of a single individual between 2000 and 2018 in US dollar using purchasing power parities of national currencies and in national currencies.
|
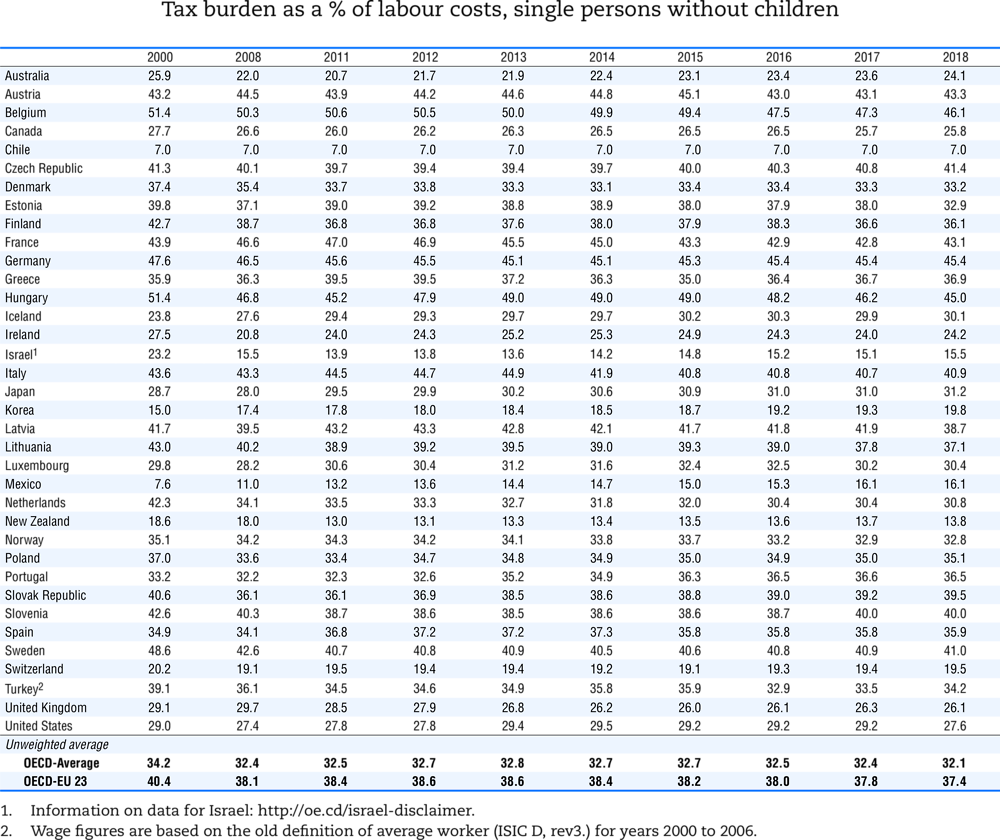
Table 6.1. Income tax plus employee and employer contributions less cash benefits, single persons at 67% of average wage
|
|---|
 |
|
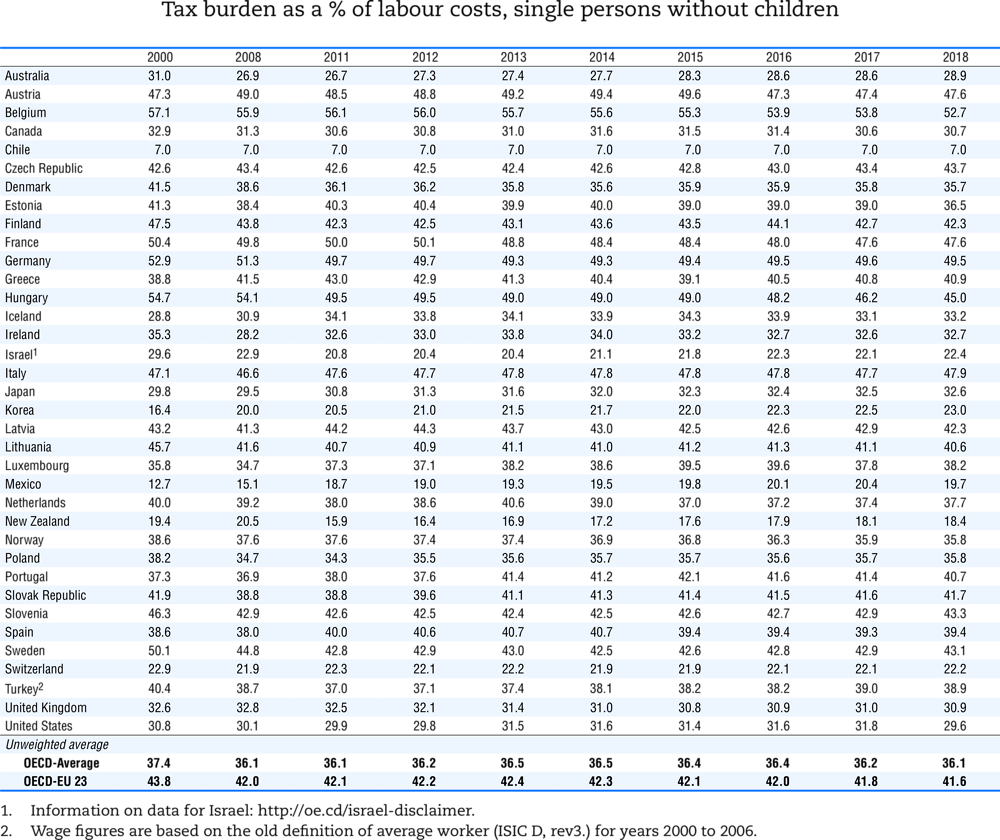
Table 6.2. Income tax plus employee and employer contributions less cash benefits, single persons at 100% of average wage
|
|---|
 |
|
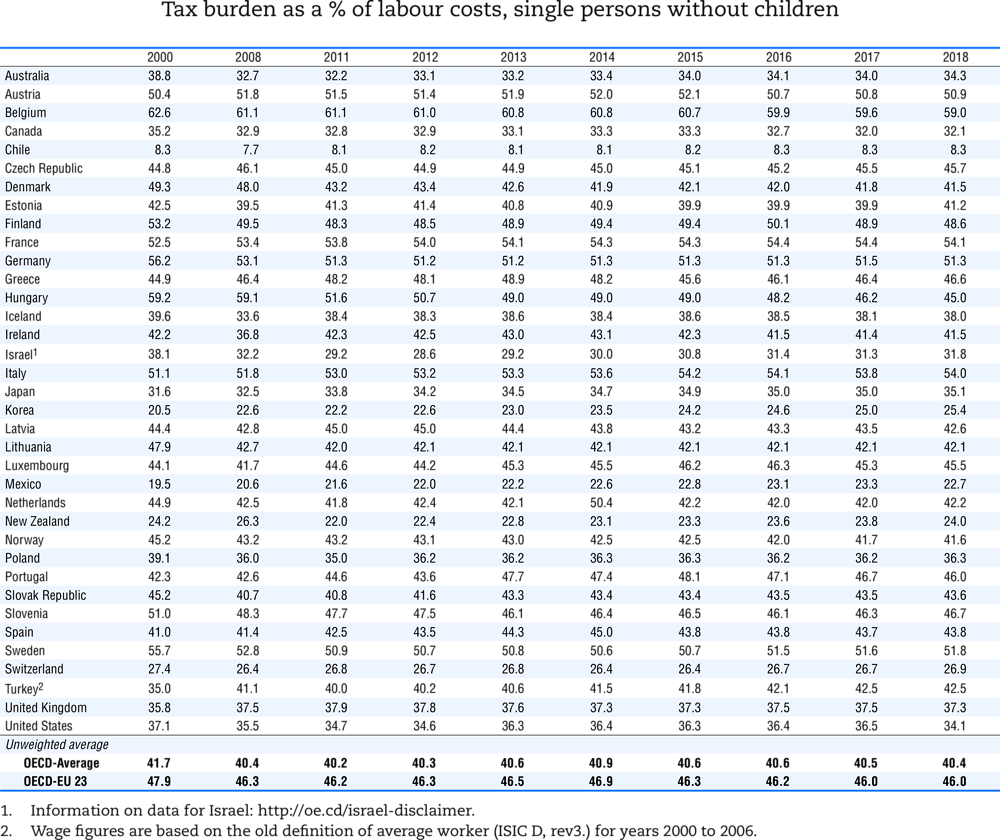
Table 6.3. Income tax plus employee and employer contributions less cash benefits, single persons at 167% of average wage
|
|---|
 |
|
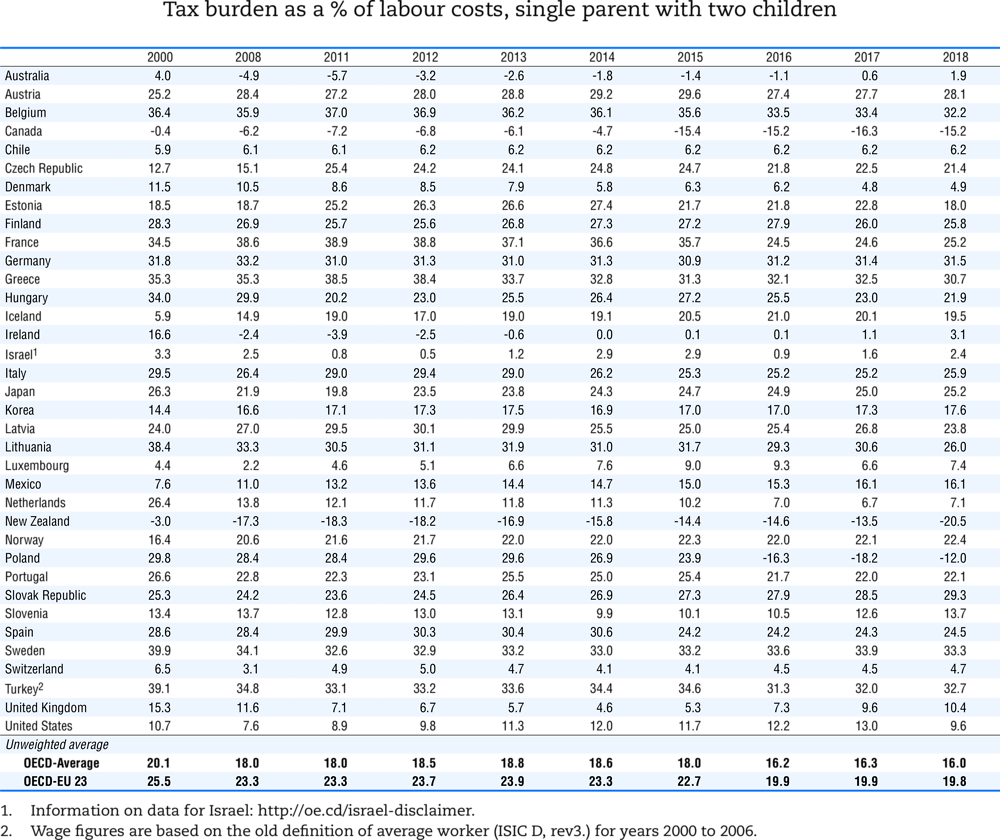
Table 6.4. Income tax plus employee and employer contributions less cash benefits, single parent at 67% of average wage
|
|---|
 |
|
Table 6.5. Income tax plus employee and employer contributions less cash benefits, married couple at 100% of average wage
|
|---|
 |
|
Table 6.6. Income tax plus employee and employer contributions less cash benefits, married couple with two children, at 100% and 33%
of average wage
|
|---|
 |
|
Table 6.7. Income tax plus employee and employer contributions less cash benefits, married couple at 100% and 67% of average wage
|
|---|
 |
|
Table 6.8. Income tax plus employee and employer contributions less cash benefits, married couple at 100% and 33% of average wage
|
|---|
 |
|
Table 6.17. Income tax plus employee contributions less cash benefits, single persons at 67% of average wage
|
|---|
 |
|
Table 6.18. Income tax plus employee contributions less cash benefits, single persons at 100% of average wage
|
|---|
 |
|
Table 6.19. Income tax plus employee contributions less cash benefits, single persons at 167% of average wage
|
|---|
 |
|
Table 6.20. Income tax plus employee contributions less cash benefits, single parent at 67% of average wage
|
|---|
 |
|
Table 6.21. Income tax plus employee contributions less cash benefits, married couple at 100% of average wage
|
|---|
 |
|
Table 6.22. Income tax plus employee contributions less cash benefits, married couple with two children, at 100% and 33% of average wage
|
|---|
 |
|
Table 6.23. Income tax plus employee contributions less cash benefits, married couple at 100% and 67% of average wage
|
|---|
 |
Note
← 1. Tables 6.1 to 6.24 shows figures rounded to the first decimal. Due to rounding, changes in percentage points that are presented in the text may differ by one-tenth of a percentage point relative to those in the Tables.