
5. Working time and its regulation in OECD countries: How much do we work and how?
Working time is a crucial variable shaping the labour market and its adaptability to shocks. It can affect key labour market outcomes, such as workers’ well-being, productivity, wages and employment. Documenting how OECD countries regulate working time, and understanding how different regulatory settings shape working time outcomes is crucial for policy makers seeking to balance equity, efficiency and welfare considerations. This chapter offers a detailed review of regulations governing working hours, paid leave, and teleworking in OECD countries. It discusses the role of collective bargaining in negotiating working hours or working time arrangements, and how OECD countries have adapted their working time regulation during the COVID-19 crisis. The chapter also provides an update on working time patterns and trends in time use across OECD countries and socio-demographic groups. It measures how differences across workers in working time outcomes have changed over time and driven inequalities in work-life balance.
On average in OECD countries, usual weekly hours for full-time employees remained fairly constant between 1995 and 2019, despite small cross-country variations. The median full-time employee usually worked 40.5 hours per week in 2019, ranging from 37 hours in Denmark to 48 hours in Mexico and Colombia. Since the mid-2000s, the incidence of paid overtime has remained stable at just over 7.5% of full-time employees, while that of unpaid overtime decreased slightly, from 6.2% to 5.1%. For those working overtime, the average number of additional hours is considerable, amounting to 8.3 for paid overtime (7.7 for unpaid overtime), or one additional day per week in 2019.
Leisure accounts for the third largest share of people’s time after personal care (which includes sleep) and paid work. Time allocated to leisure decreased by 1.5 hours per week for a full-time worker between the 1970s and the 2010s, on average in the 14 OECD countries for which data are available. This decrease started in the 1990s and accelerated over time. There are significant cross-country variations in work/leisure ratios: in the 2010s, Mexican workers spent more than three times as much time on paid work as on leisure, while Korean workers spent twice as much and German, Finnish and Norwegian workers spent about the same amount of time on both activities.
On average in the 11 OECD countries analysed, weekly hours actually worked per worker have decreased by 8 hours since 1970, but at a slowing pace (from 0.9% annually in the 1970s to 0.2% in the 2010s). Over the same period, hourly productivity has grown, also at a decreasing rate, from 3.7% annually in the 1970s to 0.7% in the 2010s. Comparing average trends in hours worked, leisure and productivity suggests that productivity growth has not led to extra leisure time for full-time employees.
Several insights emerge from this chapter’s review of the way working hours, paid leave and teleworking were regulated in 2020 in OECD countries, both through legislation and collective bargaining:
OECD countries can be clustered in six groups with different patterns of working hours governance. Those are characterised by the extent to which the limits on normal and maximum weekly hours can vary upwards: for example, in Chile, Israel and Mexico, rules are uniform – no variation is allowed, while some variation is possible either through derogation or averaging mechanisms in France or Lithuania; Austria, New Zealand or Sweden allow rules to vary to a larger degree. However, these patterns only affect usual weekly hours to a limited extent: in many countries where the possibility to exceed normal hours limits exists, it has no significant effect on median usual weekly hours – which are largely capped by statutory limits. Similarly, there is no strong relationship between patterns of governance and the frequency or duration of paid overtime.
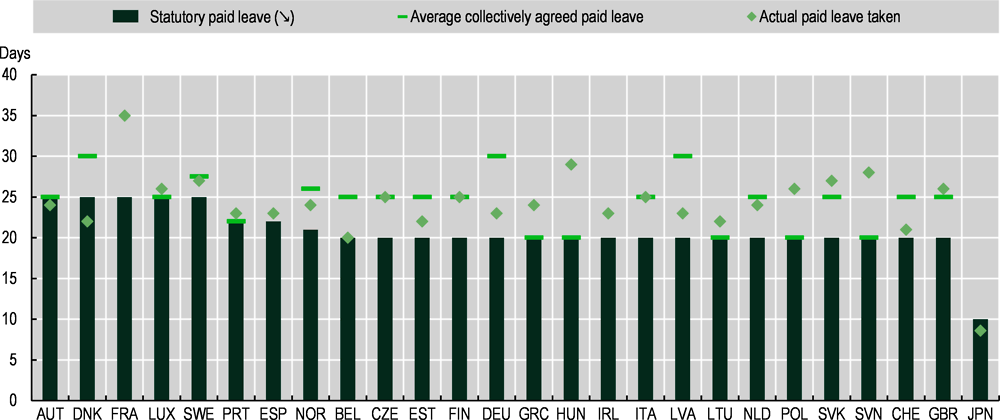
In the majority of OECD countries, workers are entitled to a minimum amount of statutory paid annual leave. In a number of countries, collective agreements provide for substantially longer annual leave than this statutory minimum. In almost all countries, the amount of paid leave actually taken is higher than the statutory minimum.
Access to teleworking is not guaranteed in all OECD countries. Legal rights to request teleworking, where they exist, can cover all employees (as in New Zealand or Spain) or some categories (as in Lithuania). In the Netherlands, Portugal and the United Kingdom employees have an enforceable right to request teleworking, while in some other countries employers can easily refuse to accommodate such requests. The way in which teleworkers’ working conditions are regulated (comprehensively or not, through dedicated legal frameworks or national/sectoral collective agreements, etc.) also vary. These regulatory differences affect access in practice: while the use of teleworking remained limited until the COVID-19 outbreak, it was higher on average in countries where there was an enforceable right to request teleworking, and highest in countries where this right was granted through collective bargaining.
OECD countries have used working time as an adjustment mechanism during the COVID-19 crisis. They introduced policies enabling to work longer hours, to take more paid leave, to facilitate averaging arrangements and to telework more easily – which was reflected in the surge in the incidence of teleworking, from 16% in 2019 to 37% of employees in March/April 2020.
Hours worked and working time arrangements vary significantly between different groups of workers:
The prevalence of very short hours of work is higher and the prevalence of very long hours lower for women and low-educated workers, compared with men and highly educated workers respectively. However, while gender differences in working hours have been narrowing, educational gaps have been widening since 1999.
Flexible working hours arrangements, which allow workers to choose their schedule, are most often used by highly educated and highly paid employees. The education gap in access to flexible hours has been widening over the past decade, while the income gap has narrowed. By contrast, the incidence of variable scheduling – whereby workers have no control over their schedule – is highest for employees without tertiary education and low-paid employees.
Prior to the COVID-19 crisis, teleworking arrangements were most often used by men, highly educated and highly paid employees in the majority of OECD countries. Disparities between educational and income groups widened during the first lockdowns, when 55% of highly educated workers were able to work from home on average, against 19% of low educated workers.
Available data for ten OECD countries reveal important work-leisure imbalances between men and women. Throughout the last 20 years, women have consistently enjoyed less leisure time per hour of work (paid and unpaid) than men. Ratios in the last decade are more comparable across educational groups, with workers of all education-levels spending on average 1.5 times as much time on work as on leisure. Higher paid workers spent on average less time on paid work and more time on leisure than lower-paid ones.
The share of workers defined as “time-poor” (i.e. those for whom the share of time devoted to leisure and regenerative activities is less than 60% of the median) increased over time for the ten OECD countries for which data are available, rising from 1.4% on average in the 2000s to 1.8% in the 2010s for men, and from 1.3% to 1.8% for women. In the last 20 years, the incidence of time poverty was lowest for the most highly paid third of workers.
There are also important differences in the amount of work needed to achieve a given level of material well-being. In several OECD countries in 2019, a single childless minimum wage worker had to work more than 40 hours per week (i.e. more than the limit on normal weekly hours in most countries) to escape poverty.
Overall, 43% of workers in OECD countries were dissatisfied with the amount of time that they spent working in 2015, with working too much being the dominant cause of dissatisfaction. The development of innovative collective bargaining practices and firm-level experimentation around working time reduction in recent years might be a sign that this dissatisfaction is being heeded, although more research is needed to confirm this conjecture.
Working time is a key component of people’s working lives. Regulating its duration and its organisation is necessary to correct possible market failures (due e.g. to asymmetry in market power between workers and employers) leading to inadequate protection of workers’ health and work-life balance, and to prevent negative externalities linked to excessive working hours or unpredictable schedules. Workers also need to be protected against the risks that unilateral cuts in working time and the corresponding reduction in income would pose to their material well-being. At the same time, worked hours being a production factor, the regulation of working time also impacts other key labour market outcomes, such as productivity and employment. In times of crisis, working time is a crucial policy instrument that can be adjusted to provide internal flexibility for firms. Therefore, understanding how different regulatory regimes relate to working time outcomes is key for policy makers seeking to balance equity, efficiency and welfare concerns.
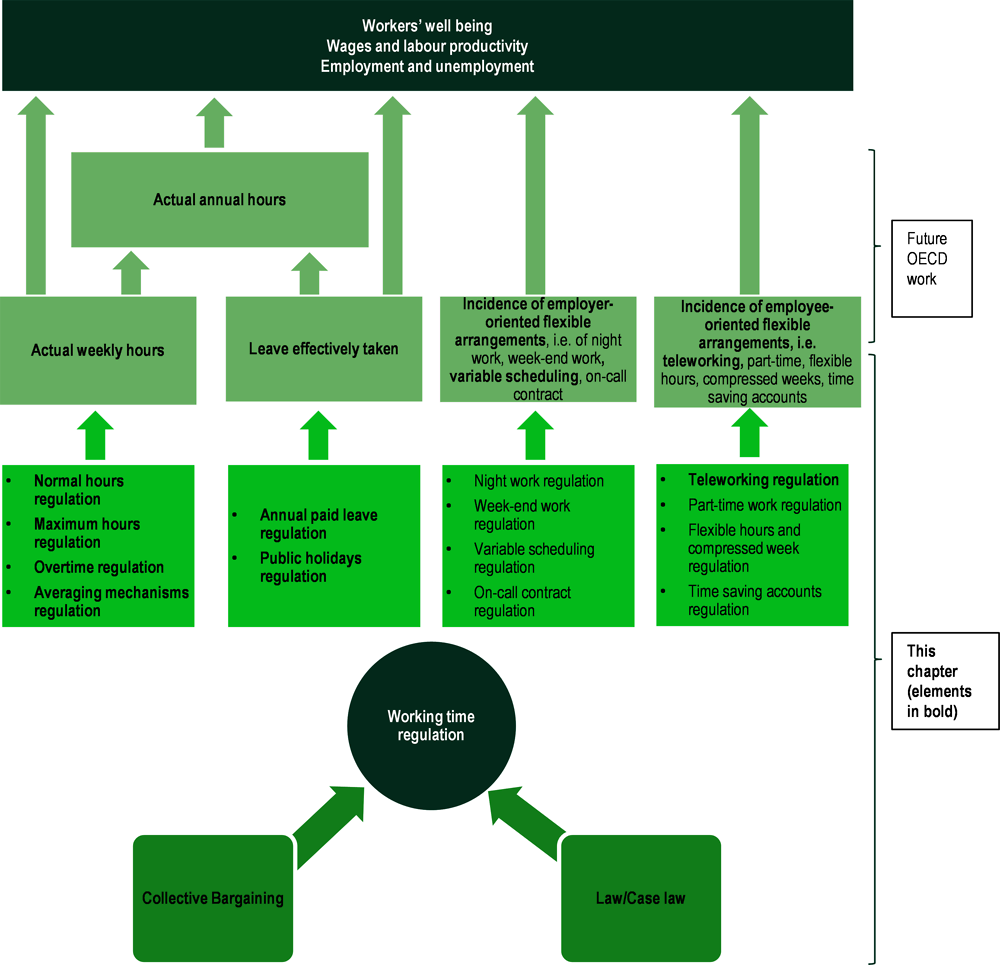
This chapter focuses on three key dimensions of working time (see Box 5.1 for definitions): weekly working hours (both normal weekly hours excluding overtime and maximum weekly hours including overtime); paid leave and public holidays; and teleworking, as well as their corresponding outcomes (e.g. hours actually worked, leave effectively taken or actual incidence of teleworking). These have all been instrumental in providing internal flexibility to firms as a response to the COVID-19 crisis.
Section 5.1 documents the diversity of working time regulatory settings in OECD countries, looking both at the governance of working time rules (i.e. the way in which these rules are set, through law or through various types of collective bargaining, conditions for derogations, and the hierarchy between different types of statutory and negotiated rules) and the content of working time rules (such as the upper limits for weekly working hours, or the level of overtime premium). Taking into account the rules negotiated through collective bargaining is particularly important, since working time is typically one of the areas where social partners have margins of manoeuvre to factor in specific local needs, possibly leading to a large variation in practices (OECD, 2019[1]). Finally, the section reviews recent regulatory changes implemented as a response to the COVID-19 crisis.
This comprehensive picture of working time regulatory settings is an essential first step to assess how working time regulation may relate to actual working time outcomes. These, in turn, may impact labour market outcomes, such as workers’ well-being, productivity and employment. This chapter concentrates on the first relationship, i.e. between rules and working time outcomes (see Figure 5.1).1 While it is often overlooked or taken for granted in the literature, this relationship might be expected to vary substantially with, for instance, the degree of heterogeneity allowed in working time regulations.
Taking a longer-term perspective, Section 5.2 investigates if younger generations work less than their parents, by looking at how the usual full-time work week2 has changed over time and across OECD countries. Fluctuations in the amount of time spent on work are mirrored by fluctuations in the amount of time spent on other activities outside of paid work. To get a better contextual grasp of development in working time, the section next reviews trends in time use, contrasting the shares of time spent on paid work, unpaid work, personal care, and leisure.
Finally, since national trends in working time may obscure changes in working time outcomes between socio-demographic groups, Section 5.3 exploits data from labour force and time-use surveys to assess disparities by gender, educational attainments and income groups, and the evolution of these disparities since the 1970s. The section presents trends in average hours worked, very long and very short hours, as well as various working time arrangements, disaggregated by groups. Patterns of mismatches between hours actually worked and the number of hours that workers would ideally like to spend working are also discussed.
Averaging arrangements: modalities used to average working hours, e.g. to exceed limits (both on normal and maximum hours) and/or overtime in any given week by smoothing the amount of hours on average, over a certain reference period.
Compressed working weeks: arrangements whereby a standard workweek is reduced to fewer than five days but workers work longer hours, thus keeping the number of hours per-week constant.
Derogations: derogations considered in this chapter are deviations in peius, i.e. deviations from the law and/or from higher-level rules that set a lower standard – i.e. provisions less favourable to workers. By default, it is almost always possible to deviate in melius from higher-level rules, i.e. to agree on a rule that is more favourable to workers. Deviations directly granted in the law also exist for particular groups, but they are not considered in this chapter as a source of variation from the norm: indeed such statutory derogations merely set different rules for different groups, but those rules are binding, and local actors cannot deviate from them.
Flexible working hours: arrangements whereby workers can choose their start and finish time.
Maximum working hours: maximum number of hours, including overtime, that workers are legally allowed to work.
Negotiated working hours: collectively agreed working hours set in collective agreements.
Normal working hours: number of working hours after which overtime conditions apply (or, put differently, working hours excluding overtime). In some countries, this number is set in the law (statutory normal working hours), in others it is set in collective agreements (negotiated normal working hours).
On-call contract: forms of employment where all or most working hours are set at the employer’s discretion, from no guarantee of any hour (“zero hours contracts”) to only a low guaranteed minimum. This should not be confused with “on-call duty”, which refers to periods of time during which the employee is expected to be work-ready, in the context of a traditional full-time or part-time contract.
Overtime hours: hours worked in excess of normal hours, that are subjected to specific conditions, such as workers’ possibility to refuse working overtime, or the application of overtime compensation, in the form of higher pay rates, or additional time-off.
Paid leave: annual period of time (usually expressed in number of days) during which workers can take time away from their work while continuing to receive pay and to be entitled to social protection, giving them the opportunity for extended rest and recreation. Paid leave is available in addition to public holidays, sick leave, weekly rest, maternity, long service leave and parental leave.
Public holidays: variety of cultural and religious non-working holidays that can be enshrined in statutory legislation at national or federal level, negotiated in collective agreements, or can exist de facto as unwritten cultural traditions.
Statutory working hours: the legal threshold after which overtime starts, as set in the law. They represent neither minimum (as workers may work part-time work) nor maximum hours (as workers can work overtime).
Teleworking: form of organising and/or performing work, using information technology, in the context of an employment contract/relationship, where work, which could also be performed at the employer’s premises, is carried out away from those premises on a regular or occasional basis.
Time-saving account: also known as time banking or working time account, such account allows the worker to build up “credits” by working overtime (paid at the normal hours rate), or to owe “debits” in hours worked (by taking advance leave), up to a maximum amount. Credits can be used as leave at a later date or traded against financial compensation.
Usual (weekly) hours: the number of hours individually worked by an employee during a normal week without any extra-ordinary events (such as leave, public holidays, strikes, or sickness), and without extraordinary overtime in addition to planned contractual overtime, as set in some employment contracts.
Variable scheduling work: contracts with regularly and unpredictably changing schedules (e.g. variable shift scheduling and on-call contracts).
Accounting for the regulatory setting that effectively apply to working time is key to derive expectations about how bindings rules are, and therefore how much variations can be expected in a given governance context.Drawing on the OECD Policy Questionnaire on Working Time Regulation (Box 5.2) this section documents in details the regulation of working hours, paid leave and public holidays, and teleworking at the beginning of 2020.3 It then presents synthetic information on the governance of working time and information on the content of the rules (statutory and negotiated)4 contrasting it to the latest available data on actual working time outcomes. Doing this allows gauging to what extent variation in regulations actually matters in producing variations in working time outcomes observed in practice.
Descriptions of working time regulatory settings in OECD countries presented in this chapter mainly rely on responses to the detailed policy questionnaires that were sent to Labour Ministries, employer organisations and trade unions in 2020. These responses, which inform Section 5.1 of the chapter usually correspond to the situation in 2020 prior to the COVID-19 crisis, except in the specific section on recent adjustments to regulation as a response to the COVID-19 crisis.
The questionnaires collected information on both statutory and negotiated rules in a number of areas of working time regulation. For information on regulation of working time that is set through collective bargaining, questions referred to the most frequent or the average clause among all workers covered by collective bargaining in the country.
The questionnaire was structured along six main blocks. The first block introduced the general organisation and governance of working time regulation (e.g. the hierarchy between statutory and negotiated norms and the degree of flexibility in deviating from standards set in the law or in collective agreements at higher levels). The second block was dedicated to the regulation of the amount of hours worked (daily and weekly working hours, as well as overtime). The third block examined the regulation of leave and public holidays. The fourth block looked at the regulation of the organisation of working time (e.g. unsocial hours and flexible working time arrangements). The fifth block collected information related to the existence of short-time work and more generally job retention schemes and how they have been adjusted as a response to the COVID-19 crisis (this information was exploited in Chapter 3 of this volume). Finally, the sixth block focused on recent reforms of working time regulation.
Questionnaires were pre-filled by the Secretariat and checked by contact points in Labour Ministries and social partners through the Trade Union Advisory Council and Business@OECD networks. Information for Canada presented in this chapter refers to the federal level.1 The information has been complemented and cross-checked with existing information from the OECD and other publicly available sources (government websites, other international organisation, and relevant research literature).
← 1. While detailed information was also received on regulation at provincial levels, it was not feasible to include all the different rules in this chapter, given the amount of variation between provincial regulations. Hence, most of the data on regulation related to Canada presented here refer to the Canadian Labour Code; the latter regulates the federally regulated private sector, or about 6% of the Canadian workforce. Labour standards for other sectors – such as manufacturing, construction, primary industries, and wholesale and retail trade – fall within the exclusive jurisdiction of the provinces and territories.
5.1.1. Weekly working hours
Regulatory settings of weekly working hours across OECD countries
In almost all OECD countries, limits on weekly working hours – both normal hours (excluding overtime) and maximum hours (including overtime) − and on overtime exist to prevent excessively long hours that may be detrimental to workers’ health and well-being (Pega et al., 2021[2]) and to productivity. Often, derogations to these rules (in the sense of rules being exceeded)5 and/or averaging mechanisms giving employers the possibility to increase working hours beyond these maxima under particular circumstances exist as well.
Three main types of rules can be found in OECD countries, often used in combination: i) rules setting limits on weekly working hours (both on normal and on maximum hours);6 ii) rules defining the conditions for the use and duration of overtime; and iii) rules defining the conditions of averaging − e.g. the possibility to exceed limits (both on normal and maximum hours) and/or on overtime in any given week by smoothing the amount of hours on average, over a certain reference period. These rules may be set by statutory law, by collective agreements, or be left to individual negotiations in some contexts.
Normal weekly hours
In the majority of OECD countries, the statutory limit for normal weekly hours is set at 40 hours a week, based on a five-day working week and eight-hour working days. Higher statutory maxima exist in Chile, Colombia, Israel, Mexico and Turkey. Belgium, France7 and Australia8 have a lower limit. In some other countries, there is no statutory limit on normal weekly hours: this is the case in Denmark, Germany, the Netherlands, Switzerland and the United Kingdom (see Annex Table 5.A.1). As mentioned above, these statutory limits can be exceeded through derogations allowing collective bargaining at the sectoral or at the firm level to overrule the limits set in the law:9 this is the case for instance in Austria, Belgium, New Zealand, Norway, Slovenia, Spain and Sweden.10 In some cases – for instance in Colombia – the normal weekly hours limit can be exceeded by mutual agreement between the employee and employer.
In many cases, employers can also exceed the default limit on normal weekly hours through averaging working hours over a reference period longer than a week, to determine the end of normal working hours, and the start of overtime (i.e. the point at which overtime pay rates start being paid, and in some cases, where a different tax treatment applies). This option exists in several countries, with different procedural requirements and modalities:11 in Belgium, Greece, Japan, Portugal and Sweden (where it needs to be agreed by collective agreement) and in Australia, Austria, Colombia, Finland,12 Norway, and Spain (where employees must consent to it). Finally in Canada, France, Hungary,13 Italy, Korea, Lithuania, Poland and Turkey, employers can unilaterally decide to use such averaging mechanisms for normal weekly hours. Significant differences in the parameters of averaging exist across OECD countries: in Australia, Colombia, France, Lithuania and Spain, for instance, the law stipulates a binding maximum period over which it is possible to average; in Belgium, Finland, Greece, Italy, Japan, Korea, Poland, Turkey and the United Kingdom, social partners can exceed the default maximum averaging period up to a higher binding ceiling. Independently of how they are set, maximum averaging periods for normal weekly hours vary quite substantially: where they are binding and set in the law, they range from 3 weeks in Colombia to 52 weeks in Spain, while they range from 6 to 12 weeks in Norway to 52 weeks in Belgium, where they are agreed upon collectively (see Annex Table 5.A.3).
Other factors beyond working time regulation are likely to affect working time outcomes. Nonetheless, understanding with precision the manner in and extent to which limits on normal weekly hours apply or are likely to be exceeded or bypassed in practice is crucial to go beyond “de jure” statutory limits on working hours, and to assess the expected degree of variation between statutory rules and outcomes. The governance of working hours in each country produces rules that are more or less binding; the more binding the rules, the more uniform the expected outcomes, and the larger the expected role of regulation in determining working time outcomes. In what follows, countries are clustered in six groups with different patterns of governance of normal weekly hours, according to how binding limits on normal hours are − accounting for possible derogations at lower levels of norms − and how easily averaging mechanisms for normal hours can be introduced (for a more detailed explanation of the clustering logic applied, see Annex Table 5.A.6):
In Chile, Estonia, Israel, Latvia, Mexico and the Slovak Republic, rules governing normal hours are uniform, with a binding upper limit that corresponds most frequently to the statutory default, and no possibility to derogate from it nor to use averaging mechanisms.
In Australia, Belgium, Finland, Greece, Portugal and Japan, rules governing normal hours are mostly uniform, with a limited possibility for variation. The upper limit on normal hours (either the statutory default or the one collectively negotiated at the national level) is binding, with no possibility to derogate from it. Yet there is a limited possibility to use averaging mechanisms through collective agreement (or with the employee’s consent in Australia14 and Finland).
Canada, the Czech Republic, France, Hungary, Italy, Korea,15 Lithuania, Poland, and Turkey allow for a more extensive variation in normal hours rules. The upper limit (most frequently the statutory default, except in Canada and Italy where it is negotiated) is binding, with no derogation allowed, but employers can unilaterally decide to use averaging mechanisms. Hence the regulation of normal hours is likely to be mixed, neither uniform nor fully heterogeneous. Slovenia and the United States16 are also in this group, since it is not possible to use averaging mechanisms, but the upper limit on normal hours can be exceeded through derogations at lower levels of bargaining (including individual agreements, e.g. in the United States).
Austria, Colombia, New Zealand, Norway, Spain and Sweden, allow for large variation in normal hours rules: the default upper limit (most frequently negotiated at the national or sectoral level) can be exceeded through derogations at lower levels17 of bargaining, and there is a (limited) possibility to use averaging with the employee’s consent or through collective agreement. The regulation of normal hours is thus likely to be mostly heterogeneous.
In Denmark, Germany, the Netherlands and Switzerland, rules governing normal hours are fully heterogeneous: there are no statutory nor centrally bargained upper limit on normal hours and limits are mostly negotiated at the firm-level (except in Denmark and the Netherlands, where the sectoral level dominates).
Finally, in the United Kingdom, normal hours are unregulated, and usually left to be determined in individual contracts with no higher-level limits. Neither are there any statutory nor centrally bargained limit on maximum weekly hours or overtime (see below).
Maximum weekly hours and overtime
Countries may also fix limits on maximum weekly hours (i.e. including overtime) (see Annex Table 5.A.2).18 This is the case in a large majority of OECD countries, and notably in most EU Member States and Norway which limit the maximum weekly hours to 48 hours on average over four months, in line with the EU Working Time Directive.19 In addition to rules on maximum hours, some countries have dedicated limits on the quantity of overtime work that can be performed in a given period of time. For instance, in Belgium, overtime is limited to a maximum of 143 hours within the period of reference used for averaging;20 in Chile, overtime is limited to 12 hours per week; in Switzerland, it is limited to 2 hours per day, and 170 hours per year.21 Limits go up to 45 hours per month and 360 hours per year of overtime in Japan (see Annex Table 5.A.2). In Australia,22 New Zealand and the United Kingdom,23 there are neither dedicated limits on overtime nor on maximum hours.
As with the limits on normal hours, limits on both overtime and on maximum hours can be binding (this is the case for instance in Finland, Mexico, the Netherlands, and Turkey), or might be exceeded24 through collective agreements (e.g. in Canada, Norway and Spain) or through individual agreements (e.g. in the Czech Republic, or Hungary) – see Annex Table 5.A.7. Even where derogations are not possible, limits on overtime and/or maximum hours may still be bypassed through averaging mechanisms (in some cases, averaging is possible in combination with derogations). While the averaging of normal hours is a way to delay the starting point of overtime in any given week, averaging maximum hours or the quantity of overtime is a means of bypassing the upper legal limit of overtime in any given week, provided this is compensated over the reference period. As for normal hours, procedural requirements and modalities vary across OECD countries. In Austria and Denmark, averaging of maximum weekly hours requires a collective agreement. In Estonia, Germany, Latvia, Norway and Portugal, the averaging of maximum weekly hours (and the maximum quantity of overtime in the Czech Republic and the Slovak Republic) can be introduced pending employees’ consent. In Hungary,25 the Netherlands, Slovenia or Sweden, maximum weekly hours (and the quantity of overtime in Switzerland) can be averaged unilaterally by employers. The maximum duration for averaging might be binding, it might be extendable by agreement under a ceiling (e.g. in Hungary or in the Netherlands), or in some cases (as in Austria and Denmark) there might be no binding limits on the duration of the averaging period for maximum weekly hours that can be negotiated (see Annex Table 5.A.3). In practice, maximum averaging periods for maximum hours or overtime vary across countries (and often, across sectors within countries), ranging e.g. from 6 to 12 weeks in Norway (most frequently negotiated provisions), to 52 weeks in Estonia.
Another source of variation between countries comes from overtime compensation. Most countries establish a minimum compensation for overtime hours. The latter can be either binding (meaning that lower level agreements can only set a higher compensation rate) – this is the case e.g. in Belgium,26 Israel, Italy, Portugal, Slovenia or the United States27 (see Annex Table 5.A.2), or there can be a possibility to agree on a lower compensation at lower levels (e.g. in Germany, Japan, or Latvia). Compensation can often take the form of a higher rate of pay, or of compensatory time-off (or it can be a combination of both). It ranges from a minimum rate of 110% in France and Italy, to 200% in Latvia and Mexico, and 150% in most countries. In Australia and Sweden, minimum compensation rates are determined in sectoral and firm-level agreements (and in industry-wide modern awards in Australia), and are therefore only relevant to covered workers. There are no provisions guaranteeing a minimum overtime rate higher than the wage rate for normal hours at all in New Zealand and the United Kingdom.
Following the same logic as exposed above for normal hours, the governance of overtime and maximum weekly hours across OECD countries can be described in terms of how binding the limits on overtime and maximum hours are and how easily averaging mechanisms for overtime or maximum hours can be introduced. Using these two criteria, OECD countries can again be clustered in six groups with different patterns of governance of overtime and maximum weekly hours (see details of the logic applied in Annex Table 5.A.7):
In Chile, Greece, Israel, Mexico, Poland and Turkey, rules governing maximum weekly hours/overtime are uniform. The upper limit (that corresponds most frequently to the statutory default) is binding, with no possibility to derogate from it, nor to bypass it using averaging mechanisms. In all these countries there is a binding minimum compensation for overtime hours.
In Belgium, the Czech Republic, Denmark, Latvia, and the Slovak Republic, rules governing maximum weekly hours/overtime are likely to be mostly uniform. The upper limit (most frequently the statutory default) is binding, but there is a limited possibility to use averaging mechanisms, only with the employee’s consent or through a collective agreement. In all these countries but Latvia and Denmark, there is a binding minimum compensation for overtime hours (in Latvia a lower minimum can be agreed upon, in Denmark there is no encompassing minimum compensation).
In Colombia, Finland, France, Germany, Italy, Japan, Korea, Lithuania, the Netherlands, Spain, Switzerland and the United States, the regulation governing maximum hours/overtime is likely to be mixed between uniform and heterogeneous.
In Finland, Germany,28 Korea,29 the Netherlands and Switzerland, the binding upper limit can be bypassed relatively easily, since employers can unilaterally decide to use averaging mechanisms. The minimum compensation for overtime is binding in the Netherlands and Korea, but it can be lowered in collective agreements in Finland, Germany and Switzerland.
In Colombia, France, Italy, Japan, Lithuania, Spain, and the United States, averaging is not possible, but the upper limit on maximum weekly hours (statutory or negotiated at a central level) can be exceeded through derogations at lower levels of bargaining (including through individual agreements in the United States). Except in Japan, the minimum compensation in these countries is binding.
In Austria, Canada, Estonia, Norway and Portugal, maximum hours/overtime rules are likely to be mostly heterogeneous: upper limits (statutory default or collectively negotiated at the national or sectoral level) can be exceeded through derogations at lower levels of bargaining, and there is a limited possibility to use averaging with the employee’s consent in most countries, or through collective agreement in Austria and Canada.30 In all these countries, there is a binding minimum compensation for overtime hours.
In Hungary, Slovenia and Sweden, maximum hours/overtime rules are likely to be fully heterogeneous: existing limits can be exceeded through derogations at lower levels of bargaining, and there is a unilateral possibility for employers to use averaging mechanisms. While the minimum compensation is binding in Hungary and Slovenia, there is no encompassing minimum compensation rate in Sweden.
Finally, in Australia, New Zealand and the United Kingdom, maximum hours are unregulated: overtime / maximum weekly hours are usually left to be determined in individual contracts with no higher levels limits;31 there are no encompassing minimum compensation for overtime hours.
Patterns of working hours governance across OECD countries
Table 5.1 combines the two previous country groupings, to capture the overall governance of weekly hours across OECD countries. Six patterns of governance of working hours emerge, which can be expected to produce more or less heterogeneous rules governing working hours:
Countries with uniform rules for both normal and maximum hours: in this group, upper limits on weekly hours (both normal and maximum hours) are set in the law or in cross-sectoral/sectoral agreements. Limits are binding (no derogations are allowed), and bypassing them with averaging mechanisms is only possible with employees’ consent or a collective agreement. The majority of workers in this group of countries is subject to similar rules, with relatively little variation.32 Belgium, Chile, Israel, Greece, Latvia, Mexico and the Slovak Republic fall into that category.
Countries allowing for some variation in both normal and maximum hours rules: upper limits on weekly hours (both normal and maximum hours) are set in the law or in cross-sectoral/sectoral agreements. However, limits can either be exceeded through derogations at lower levels of bargaining, or be bypassed through averaging mechanisms unilaterally introduced by employers. Heterogeneity can be expected to be higher in this group of countries compared with the previous one. France, Italy, Korea, Lithuania and the United States are in this group.
Countries allowing for a more extensive variation in both normal and maximum hours rules: upper limits on normal hours are either non-existent, can be exceeded through derogations (sometimes in combination with averaging), or can be bypassed through unilateral averaging; the upper limit on maximum hours can be exceeded through derogations (sometimes in combination with averaging) or bypassed through unilateral averaging. Within this group, Colombia, Germany, the Netherlands, Spain, and Switzerland allow for limited local variation of the maximum hours limit, but more extensive variation for normal hours; Canada, Hungary and Slovenia allow for a limited variation of the limit on normal hours, but more extensive variations for maximum hours; and Austria, New-Zealand, Norway and Sweden allow for extensive variations on both dimensions. Hence, heterogeneity could be highest in this group compared with the two previous ones.
Countries with uniform rules for normal hours, but allowing for variation of maximum hours rules: in this group, upper limits on normal hours are set in the law or in cross-sectoral/sectoral agreements; limits are binding (no derogations are allowed), and bypassing them with averaging mechanisms is only possible with employees’ consent or a collective agreement. By contrast, the upper limit on maximum hours can be bypassed through averaging mechanisms introduced unilaterally by employers, and / or exceeded through derogations. Hence the majority of workers is subject to similar rules governing normal hours, but potentially to different rules for maximum hours. Australia, Finland, Japan and Portugal belong to this category.
Countries with uniform rules for maximum hours, but allowing for variation of normal hours rules: in this group, upper limits on maximum hours are set in the law or in cross-sectoral/sectoral agreements; limits are binding (no derogations are allowed), and bypassing them with averaging mechanisms is only possible with employees’ consent or a collective agreement. By contrast, the upper limit on normal hours can be adapted locally through averaging mechanisms introduced unilaterally by employers, and/or through derogations. Hence the majority of workers is subject to similar rules governing maximum hours, but potentially to different rules governing normal hours. The Czech Republic, Denmark, Estonia, Poland, and Turkey are in this group.
Countries where working hours are largely unregulated: there are no binding limits on either normal or maximum working hours; the United Kingdom is in this group.
This grouping is inevitably a simplification of the complexity of the governance of working hours. It necessarily focuses on some aspects (here, the rules governing the limits to normal and maximum hours), to the detriment of others.33 Moreover, the logic behind this clustering exercise focuses on one dimension (the heterogeneity vs. uniformity of rules and expected outcomes), while others could have been considered. More generally, in focusing on the governance of working hours, it does not account for the contents of rules themselves (although information on this is presented in Annex 5.A), which obviously matter for outcomes irrespective of their uniform or heterogeneous nature. Nonetheless, this clustering exercise adds nuance to the estimation of the relationship between working time regulation and working time outcomes. Indeed, it suggests that there are significant sources of heterogeneity in rules governing working hours in some countries, which should be accounted for when assessing the impact of working time regulation reforms on labour market outcomes (put differently, the “bite” of reforms is likely to vary between countries, depending on the degree of uniformity of their working time regulation).
 Uniform regulation
 Variation possible on normal hours and uniform regulation on maximum hours/overtime
  Uniform regulation on normal hours and variation possible on maximum hours/overtime
 Allowing limited variation
 Allowing extensive variation
 UnregulatedSource: OECD Policy Questionnaire on Working Time Regulation, 2020.
Working hours regulation and hours worked
A good metric to capture how much a typical full-time employee works in any given week is median usual hours in the main job. Usual hours refer to the number of hours that full-time employees effectively work on average in a “normal” week (excluding the effect of particular events such as leave, public holidays, strikes, or sickness, that may affect working hours in any particular week – see Box 5.3 for more details).34 On average in the OECD,35 the median full-time employee usually worked 40.5 hours per week in 2019.36 Across countries, median usual hours ranged in 2019 from 37 hours per week in Denmark to 48 hours in Mexico and Colombia – see Annex Figure 5.A.1.
Outcomes observed reflect, at least to some extent, the content of rules on weekly working hours. The very high statutory limits on normal weekly hours in Chile, Colombia, Israel, Mexico and Turkey go hand in hand with a high median in usual weekly hours. Countries where normal weekly hours are regulated through locally negotiated limits (e.g. Denmark, Germany or the Netherlands) do not display a particularly high median in usual weekly hours compared to the OECD average – which is coherent with the fact that negotiated limits37 were systematically lower or equal to limits set by statutory law38 in OECD countries for which data exist (see Annex Figure 5.A.1).
Importantly, in most countries for which data are available, median usual weekly hours remain at or under the applicable upper statutory limit in normal hours39 (Figure 5.2); in other words, statutory limits appear to act as a cap on hours in practice. By contrast, in most countries, usual weekly hours observed are higher than the negotiated limit on working hours indicated on the chart, pointing to the use of sectoral derogations – indeed data on negotiated limits presented in this chapter are often derived from available information on particular sectors.
The term working hours refers to several concepts. It can refer to a rule: the amount of work for which a worker is employed (contractual hours), or the amount of work for which she can legally be employed on the basis of the regulation she is subjected to (statutory working hours, negotiated working hours). It can also refer to the number of hours actually worked by this employee: in this case, a further distinction exist between actual working hours and usual working hours.
Actual hours, as defined in the 1962 ILO Resolution concerning statistics of hours of work, refer to all hours effectively spent working, including overtime hours and excluding absences (International Labour Organisation, 1962[3]). Although not explicitly stated in the resolution, actual hours of work routinely include both paid and unpaid hours at work. Usual hours of work are hours that an employee typically works over a definite amount of time (e.g. a day, a week, or a month), in the absence of any extra-ordinary events (such as leave, public holidays, strikes, or sickness), and without extra-ordinary overtime in addition to the regular overtime potentially included in her contract.
Data on hours actually worked (actual and usual hours) are collected in two main data sources: household-based surveys, such as labour force surveys (LFS) – which can be complemented with time-use surveys, the latter being more irregular and with smaller sample sizes – and establishment surveys, such as the European Structure of Earnings Survey (EU-SES).
There are some limitations to using household-based surveys, and labour force surveys in particular; first, while the European Union – Labour Force Survey (EU LFS) recently moved toward ongoing data collection, most other OECD countries do it on a discontinuous (albeit regular) basis such as one week per month or one week per quarter. This can affect the accuracy of data on both hours actually worked and hours not worked, since by nature, it does not account for unexpected irregularities in hours worked and hours not worked – for example, hours not worked on holidays, in bad weather, or because of school closings. Second, LFS data depend on respondent recall and proxy responses, so hours worked and not worked may not be correctly reported due to faulty memory or lack of information.1 Finally, LFS data only cover resident employees. In countries, such as Belgium, Luxembourg or Switzerland, with many cross-border workers, employment data from this source may not correspond to those employed in the country’s production of output, thus affecting working hours measures.
Data on working hours available in establishment surveys are generally considered more reliable than data based on individual recall, since they are extracted from payroll information. However, establishment survey data only cover paid hours, rather than all hours actually worked. In addition, both the practice and reporting of data collection of paid hours differ widely across OECD countries, making cross-country comparisons difficult. In some countries, such as Norway, sick leave or maternity leave are paid by the government or social partners, and are not captured in paid hours in establishment surveys; in other countries, such as the United States, paid sick leave is provided by employers, and is thus counted as hours paid in the establishment surveys. Finally, establishment surveys may not be representative of all industries (historically they mainly used to cover the manufacturing sector, although recently coverage has been expanded to include the service sector).
Since cross-country comparison is key in this chapter, data from labour force surveys is favoured to measure usual and actual hours of work.
← 1. However, concerns over respondent error in labour force surveys seem to be less of a problem than previously thought. The advent of time-use surveys has led to research that compares short-term recall of hours worked and longer term recall used in household surveys. For example, comparisons between the 1998 Canadian Labour Force Survey and Time Use Survey found that, overall, average numbers of hours worked were similar between the two surveys. A study based on American data (Fleck, 2009[4]) showed that time-use survey responses accurately reflected hours worked when the data were collected in or near the reference period, but that hours reported were 5% lower in data collected during later weeks. Usual concerns remain over proxy responses.
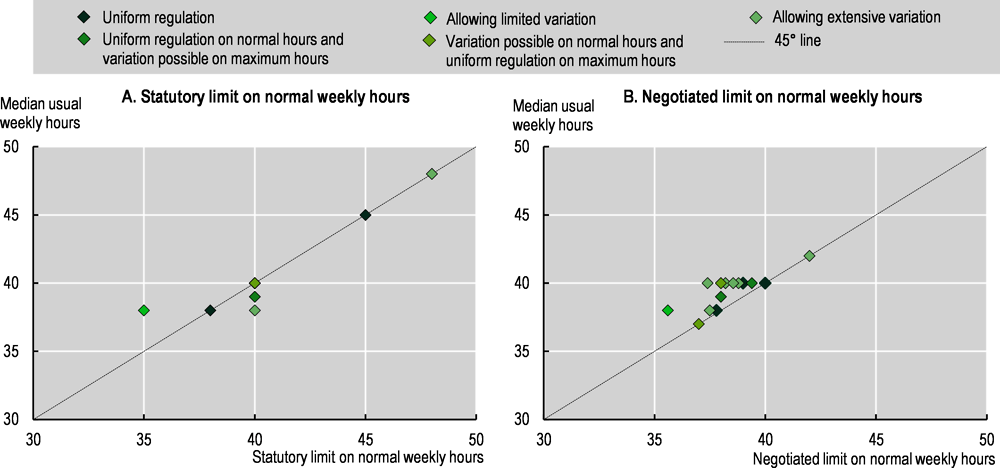
In order to explore how the governance of working hours regulation relate to median usual hours worked across OECD countries, Figure 5.2 compares statutory and negotiated provisions on normal weekly hours with data on median usual hours worked, by patterns of governance identified in Table 5.1.40 Figure 5.2 does not reveal any particular relationship between governance patterns and the content of statutory and negotiated provisions, as countries do not cluster by type of governance on the Y-axis. Looking at Figure 5.2, the extent to which the degree of uniformity versus heterogeneity of rules affects actual outcomes is not obvious: countries are close to the 45 degrees lines in both panels, irrespective of their governance patterns. In accordance with expectations, in countries with a uniform regulation of normal hours, usual hours observed for the median full-time employee tend to follow the statutory limit41 (see Annex Figure 5.A.1).The same holds true in three out of four countries allowing for a limited variation of normal hours regulation.42 There is slightly more divergence between the median usual week and regulatory limits in countries where more variation in normal weekly hours are possible. Interestingly, variations go in both directions: in Germany and the Netherlands, the median in usual weekly hours is higher than regulatory limits; but in Norway, it is lower than these limits. Importantly, however, there is no deviation between the statutory limit and median usual hours in close to 80% of countries which, in theory, allow for more variation. Furthermore, the data do not show more dispersion between workers in countries allowing for more variation in working hours rules.43 In fact, the highest standard deviations in usual weekly hours are observed in Mexico,44 where working hours rules are, in theory, uniform, and in Colombia, which allows for extensive variation. By contrast, the lowest standard deviation is observed in Switzerland, which also allows for extensive variation. Correlations between governance patterns and standard deviations in usual weekly hours are not statistically significant.45
All in all, Figure 5.2 suggests that where the possibility to deviate (in peius) from default limits on normal hours exist, it does not seem to be widely used, while in some cases where the regulation is, in theory, uniform, with no possibility for variation, these regulations might not be fully enforced. In other words, the relationship between working hours regulation and working time outcomes is not a straightforward one, even when considering different sources of rules and their articulation. This finding should inform future research on the relationship between working time outcomes and labour market outcomes (the second relationship in Figure 5.1); it also confirms that other factors beyond regulation (e.g. taxes and transfers, or cyclical effects) are likely to matter in determining working time outcomes.
Note: Usual hours worked definitions:
Canada: normal paid or contractual hours, not counting any overtime.
Chile: weekly hours in main job, that the employee agrees to work or that are included in the employment contract or work agreement.
Colombia: number of hours normally worked in main job. Hours normally worked do not necessarily coincide with hours indicated in the employment contract.
European countries: modal value of the actual hours worked per week over a long reference period, excluding weeks when an absence from work occurs (e.g. holidays, leaves, strikes, etc.). The “long reference period” is at least the last four weeks and at most the last three months without counting any absence from work. When such a long reference period cannot be identified (because the working hours vary from week to week, or the person has just started a new job), the weekly usual hours worked may refer to (i) the contractual hours of work in the reference week, for those who have an employment contract, plus regular overtime if the worker is expected to work overtime or (ii) an average of the actual hours worked in the last four weeks, plus the hours of absence of work in the last four weeks.
Mexico: actual hours worked during the reference week that the employee considers as hours usually worked in main job (Question Q5b: What days and how many hours did you work last week? and Question Q5c. Is this the number of hours you usually work?). These hours include waiting time, work preparation, maintenance and cleaning of the business unit’s facilities.
United States: normal work schedule that represent 50% of the time or more, or the most frequent schedule during the past four or five months.
For further explanations on the country groupings and the regulation of normal and maximum hours, see Table 5.1, and Annex Tables 5.A.6 and 5.A.7. See Annex Figure 5.A.1 for detailed results by country. Note that although all countries are represented in the graph, not all are visible, since a lot of countries cluster under the same co-ordinate (e.g. (40,40)).
Source: OECD Policy Questionnaire on Working Time Regulation, 2020; OECD estimates based on the Canadian Labour Force Survey (CLFS) for Canada, the Encuesta Nacional de Empleo (ENE) for Chile, the Gran Encuesta Integrada de hogares (GEIH) for Colombia, the European Union Labour Force Survey (EU-LFS) for the European countries, the Encuesta Nacional de Ocupación y Empleo (ENOE) for Mexico and the Current Population Survey (CPS) for the United States.
Turning to overtime, Figure 5.3 shows statutory and negotiated46 limits on weekly overtime, as well as the incidence and median hours of overtime per full-time employee in OECD countries in 2019, by patterns of working hours governance. Measurements of overtime are clouded by several issues that should be taken into account from the outset and kept in mind when analysing the data in Figure 5.3 (and Annex Figure 5.A.2). Overtime hours are often not accurately recorded (Green, 2017[5]), which means that the data limitations inherent in any survey (wrong recollection, approximation, etc.) are probably heightened. Measurement of unpaid overtime is likely to be particularly patchy. For that reason, Figure 5.3 focuses on paid overtime – which is also more likely to be directly related to working time regulation than unpaid overtime (however see Figure 5.9, Annex Figure 5.A.2 and the brief discussion below for data on unpaid overtime).
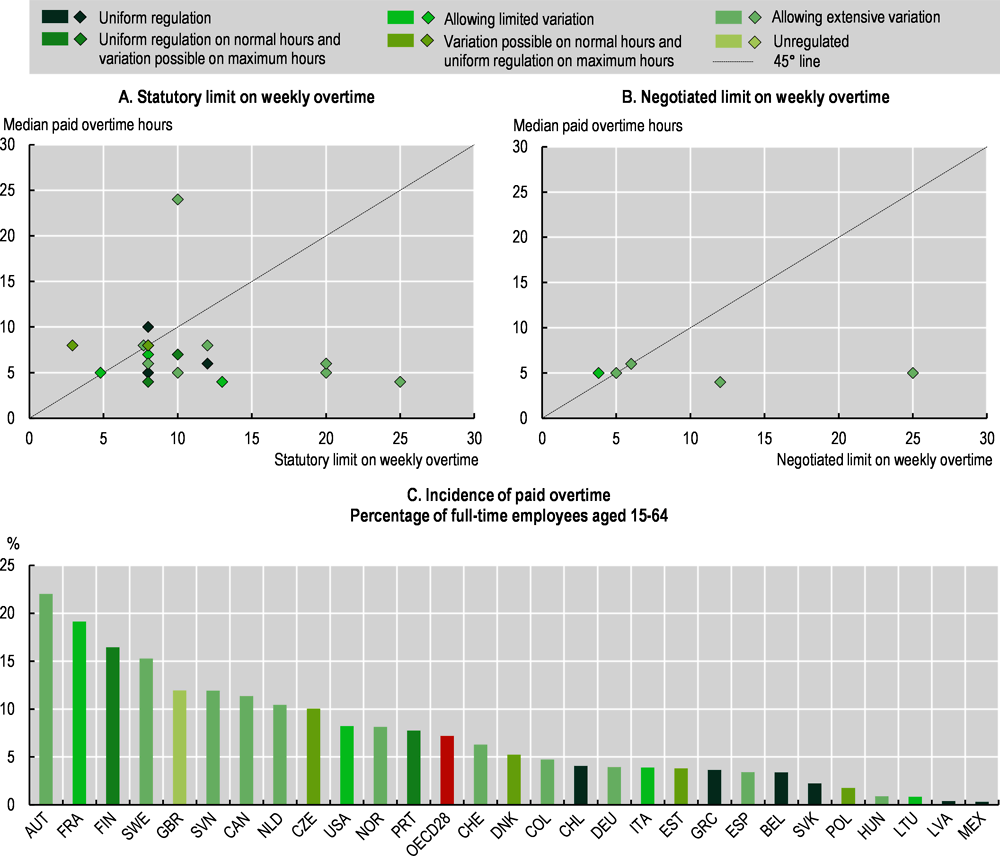
Note: The Y-axis in Panels A and B refers to median weekly hours of paid overtime for full-time employees reporting paid overtime. The statutory weekly overtime limit in France, Estonia, Finland, Greece, Canada and Belgium are calculated as the difference between the limits on weekly normal hours and weekly maximum hours. The statutory weekly overtime limit is calculated from the yearly overtime limit in Hungary, Italy, Poland and Turkey, and from the daily overtime limit in Slovenia, Portugal, Sweden and Switzerland. Data on the incidence and median hours of overtime in Norway and Latvia are from 2018. Data on the incidence and median hours of overtime in Chile, Mexico and the United States are for overtime in general (the data available do not specify whether this correspond to paid overtime, unpaid overtime, or both). OECD28 is the unweighted average of the 28 OECD countries shown in this Chart (excluding Australia, Costa Rica, Iceland, Ireland, Israel, Japan, Korea, Luxembourg, New Zealand and Turkey). For further details and explanations on the country grouping, see Table 5.1, Annex Tables 5.A.6 and 5.A.7; see Annex Table 5.A.2 for details on the regulation of maximum hours and /or overtime; and see Annex Figure 5.A.2 for detailed results on incidence and median hours of paid overtime by country.
Source: OECD Policy Questionnaire on Working Time Regulation, 2020; OECD estimates based on the Canadian Labour Force Survey (CLFS) for Canada, the Encuesta Nacional de Empleo (ENE) for Chile, the Gran Encuesta Integrada de hogares (GEIH) for Colombia, the European Union Labour Force Survey (EU-LFS) for the European countries, the Encuesta Nacional de Ocupación y Empleo (ENOE) for Mexico and the Current Population Survey (CPS) for the United States.
On average in OECD countries for which data are available, 7.7% of full-time employees worked paid overtime in 2019. The incidence of paid overtime ranged from 0.4% of full-time employees in Latvia to 22% in Austria. On average across OECD countries, among employees that reported paid overtime, the median amount of reported hours was 8.3 hours, i.e. about one additional day of work per week. However, this figure varied largely across countries, ranging from 5.7 hours in Latvia, to 20 hours in Switzerland. In parallel, 5.1% of full-time employees on average worked unpaid overtime in 2019, ranging from 0.02% in Latvia, to 25.4% in the Netherlands. The median amount of unpaid overtime was 7.7 hours, among those who reported it, on average across countries, ranging from 5.9 hours in Lithuania, to 11.3 hours of weekly unpaid overtime on average in Switzerland (see Figure 5.9 for detailed data on paid and unpaid overtime).
Simply eyeballing Figure 5.3 and Annex Figure 5.A.2, there does not seem to be a clear-cut link between the incidence and median hours of paid overtime: some countries have a high incidence, but a low amount of weekly paid overtime (e.g. Austria, Finland), some have a low incidence, but a high median (Estonia, Greece, the Slovak Republic, or the United Kingdom), while some have both a high incidence and a high median (e.g. the Czech Republic) (here again several countries may hide behind the same point in the scatterplot – see Annex Figure 5.A.2 for the detailed data).
Where data on both statutory rules and negotiated provisions could be collected, there is no clear pattern in the relationship between statutory and negotiated provisions: in Italy and Sweden, negotiated provisions tend to fix a lower limit on weekly overtime than that authorised in the law (although in both cases social partners could negotiate a higher limit), while the reverse is true in Norway (see Annex Figure 5.A.2).
Here again, Figure 5.3 does not display a clear-cut relationship between the degree of variation allowed in the rules and the actual degree of variation in outcomes observed. The median amount of paid overtime for full-time employees tend to stay within the limits fixed in the law or in higher level collective agreements in most countries47 that give extensive possibility for the upper limit on overtime to vary. By contrast in some countries where the upper limit on weekly overtime is supposed to be uniform, with only limited possibilities to bypass it through averaging mechanisms agreed upon in collective agreement, the median amount of paid overtime observed is higher than the binding limit – which points to rule evasion or lack of enforcement of the binding limit (this is the case in the Slovak Republic and Poland, see Annex Figure 5.A.2).48 More generally correlations between governance patterns and standard deviations in the median amount of paid and unpaid overtime are not statistically significant.
Finally, Figure 5.3 shows that the way that overtime rules are set are only one of the factors shaping actual overtime outcomes on the ground. There is no strong relationship between particular governance patterns and levels of incidence or average hours of paid overtime: irrespective of their governance patterns, there are countries below and above the OECD average for both incidence and average hours (see Figure 5.3 and Annex Figure 5.A.2). Figure 5.3 also shows that there is a large variation in the incidence and median hours of overtime actually measured within the groups of countries identified above for their similarities in terms of governance.
This last point is not necessarily surprising since governance patterns are based on information on overtime limits: variation in the incidence of overtime might be more directly related to variation in the rules for minimum compensation of overtime detailed in Annex Table 5.A.2. As shown in Panel C, the incidence of paid overtime is above average in Sweden and the United Kingdom, where there are no encompassing minimum compensation for overtime hours; it is the second highest in France, where a binding minimum compensation exists, but is the lowest of the OECD (at 110% of the normal rate, as in Italy). Similarly, the lowest incidence of paid overtime is observed in Mexico, where the existing binding minimum compensation is the highest in the OECD (at 200% of normal wage and 300% after 9 hours). However, the highest incidence is observed in Austria, where there is a binding minimum compensation that is comparable to the OECD average (at 150% of normal wage); and in Latvia, where the incidence is really close to that observed in Mexico, the minimum compensation is higher than average (200%), but it is not binding. In other words, variation in incidence appears at best partly related to variation in minimum compensation rules.
Beyond regulatory settings and the size of the overtime premium, many other factors are influencing the quantity of overtime work. Workers’ supply of overtime is likely to be correlated with both their position in the wage distribution and the shape of that distribution: on the one hand, working overtime may be a necessity to make ends meet for low-paid workers; Anxo and Karlsson (2019[6]) found for instance a positive correlation between the incidence of low-paid jobs and of paid overtime. On the other hand, the possibility to work paid overtime might not be available in the lowest-paid jobs,49 and be more frequent in higher-paid jobs. The tax treatment of overtime is likely to be another relevant factor – see e.g. Cahuc and Carcillo (2014[7]). Finally, social and cultural norms around overtime work are also likely to play a role.
5.1.2. Annual paid leave and public holiday
Regulatory settings of paid leave and public holidays across OECD countries
In the majority of OECD countries, employees are entitled to annual paid leave, e.g. to a period during which they can take time away from their work while continuing to receive their wage and remaining entitled to social protection. Workers can take a specified number of days or weeks of leave. Paid leave is available in addition to public holidays, sick leave, weekly rest, parental leave, etc. Annual paid leave, together with public holidays is an important factor for workers’ well-being and for preserving human capital,50 and a key determinant of the overall amount of working time each year. Paid leave can be regulated at different institutional levels, but is in general framed by national and international legislations (e.g. the EU Working Time Directive (Directive 2003/88/EC),51 the ILO Holidays with Pay Convention 132)52 that establish statutory minimum standards that can be further specified in collective agreements – at national, sectoral or firm level − or in the individual contract (for detailed content on statutory and negotiated paid leave and public holidays, see Annex Tables 5.A.4 and 5.A.5). Generally, the regulations on paid leave laid down in collective agreements are more generous than statutory entitlements (e.g. derogations to the law providing less generous leave are not allowed).
The minimum statutory amount of annual paid leave differs across OECD countries: while no statutory requirement exists in the United States,53 minimum entitlements vary from 6 days in Mexico to 25 days in some European countries.54 In many OECD countries, legislation sets a 20-day minimum entitlement. This is the case in Australia, New-Zealand, Switzerland and the majority of EU Member States in line with the EU Working Time Directive. In Austria, Denmark, France, Luxembourg and Sweden, the statutory minimum paid leave is 25 days, while in Portugal and Spain it is 22 days (Figure 5.4). The total amount of paid leave days may however depend on a number of factors, such as region, type of contract,55 occupation, years of service, sectors of the economy, or age. In many OECD countries, it increases with duration of service in the firm. In some countries (e.g. the Czech Republic, France, Sweden), access to paid leave may be granted before one year of service (see Annex Table 5.A.4). In many cases, these aspects are defined in collective agreements at various levels or determined in individual contracts.
Data on negotiated paid leave are patchy, as collectively agreed rules are often too complex to allow producing even a rough general estimate. When available, data should thus be interpreted with caution given the diversity of rules applying. With these caveats in mind, data collected via the OECD Policy Questionnaire on Working Time Regulation and completed with information from Cabrita and Brandsma (2019[8]) on the most frequent clause on paid leave among all employees covered by collective bargaining, suggest that collective agreements can provide for substantially longer annual leave than the statutory provision (typically between 2.5 and 10 additional days,56 see Figure 5.5). In the Czech Republic, Finland, Italy, Latvia, Switzerland, the Slovak Republic and the United Kingdom, collective agreements typically provide up to 5 extra days per year. In the Netherlands, data suggest that workers covered by collective agreements generally benefit from 5.6 additional days of paid leave annually. In Sweden, negotiated annual paid leave is, on average 27.5 days long (i.e. 2.5 days longer than provided in the law). At 30 days, Denmark and Germany have the longest collectively agreed typical paid leave allowances, well above the statutory 25 days. In New-Zealand, 29% of employees covered by collective agreements have a higher entitlement to annual leave than the statutory minimum amount (Blumenfeld, Ryall and Kiely, 2015[9]).57 As mentioned above, collective agreements may grant even more days of paid leave in certain sectors58 or regions,59 sometimes depending on seniority.
In addition to granting extra paid leave, collective agreements often grant employees an influence over the timing of their leave (although the employer generally has the ultimate power to decide when paid leave is taken): this is the case for instance in the Czech Republic, Germany, Hungary or Sweden, where intensive consultation or even bargaining with the employees or their representatives is required on this issue. In Japan and Korea, an employer can refuse an employee’s choice of vacation days only if the normal operation of the enterprise would be disturbed.60 Generally, paid annual leave cannot be exchanged for financial compensation.
National public holidays come in addition to paid leave. These holidays may vary by year. While all OECD countries have a number of established public holidays (e.g. up to 18 days in Colombia), not all countries grant statutory paid public holidays (Figure 5.4).
In most countries, public holidays are set in legislation, and some61 or all of them are made into paid holidays; in some others, setting up the list of paid public holidays is left to collective bargaining at various levels, or to individual contracts. In the Netherlands or Sweden, for instance, collective agreements at national or sectoral level generally grant paid public holidays. In Japan, the United States and the United Kingdom, this is a matter for firm-level agreements or individual contracts. Furthermore, in some countries, derogations to the law exist that allow employers to require employees to work on a public holiday (e.g. in Belgium, Canada, France, Lithuania and New Zealand, see Annex Table 5.A.4), with financial compensation or time off. In Canada and New Zealand, for instance, employees working on a public holiday are paid 1.5 times their regular rate; in New- Zealand they are given another day off.
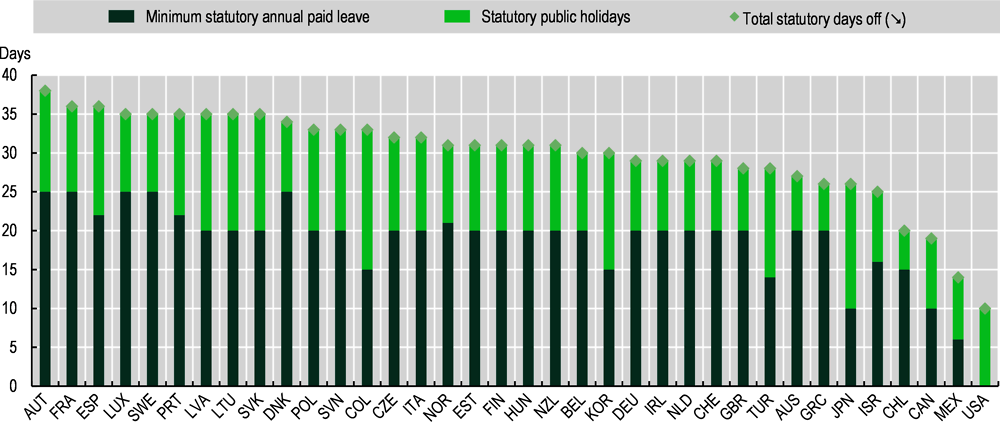
Note: Figures for paid leave refer to an employee working 5 days a week, with a job tenure of at least one year. There is no minimum statutory annual paid leave in the United States because no permanent federal law requires employers to provide employees with paid vacation leave. No data for Iceland. See Annex Tables 5.A.4 and 5.A.5 for further explanations.
Source: OECD Policy Questionnaire on Working Time Regulation, 2020 and Cabrita and Brandsma, (2019[8]).
Paid leave regulation and leave actually taken
Figure 5.5 compares paid leave entitlements (both statutory and negotiated ones) and leave effectively taken by employees.62 Several insights emerge from this comparison. First, in all countries, except for Denmark and Japan, the average number of paid leave days actually taken is higher than the statutory minimum where it exists. The difference is particularly striking in France where the annual average number of days in paid leave was 35 in 2019, well above the statutory provision of 25 days, possibly due to the existence of negotiated paid leave63 and to the working time reduction scheme, Réductions du Temps de Travail (RTT).64 By contrast, in Japan, the average amount of paid leave taken is below the statutory provision (and well below the amount of leave effectively taken in other countries). In the United States, although there is no legally mandated paid leave, 85% of civilian workers have access to personal leave, sick leave, paid family leave, or vacation. Workers with consolidated leave plans (which provide a single amount of time off for workers to use for multiple purposes including vacation) have access to an average of 14 days of paid leave for their use after one year of service, while workers with no consolidated leave plan have access to an average of 9 days of paid leave for their use after one year of service65 (Bureau of Labour Statistics, US Department of Labor, 2019[10]).
Note: Statutory paid leave: data for Hungary refer to the entitlement for workers up to 25 years old. After this age, the number of annual vacation days is raised by 1 day every 3 years for workers in their twenties, and every 2 years for workers in their thirties and forties. Data for the Slovak Republic refer to employees below 33 years old. After this age the number of days is increased to 25.
Negotiated paid leave: In Hungary, Lithuania and Poland, the number of negotiated paid leave is the same as that regulated by law. Information is missing for Japan due to the extreme variation of leave schemes at the firm level. For Switzerland, the data refer to the number of days for employees aged 20 to 40 in the metal, machinery and electronic industry (the number of days increases to 27 and to 30 days for employees aged respectively 40-49 and 50 or more). No data available for France, Ireland and Spain.
Actual paid leave taken: annual average number of days in paid leave. This refers to all sectors (except agriculture and activities of private households) for the Czech Republic, Estonia, Germany, Hungary, Ireland, Latvia, Lithuania, the Netherlands, Norway, Poland, the Slovak Republic, Slovenia, Spain, Switzerland and the United Kingdom; to firms with more than ten employees for Denmark, Finland, France and Luxembourg; and to firm with ten employees and more excluding public administration for Austria, Belgium, Greece and Portugal. The Japanese figure refers to regular employees in firms with 30 or more employees of the non-agricultural private sector. Statistics refer to 2018 for the European countries and 2013 for Japan.
For further information on statutory and negotiated paid leave, see Annex Tables 5.A.4 and 5.A.5.
Source: OECD Policy Questionnaire on Working Time Regulation, 2020, Eurofound (2019) and Eurostat, Structure of Earnings Survey (SES) 2018 for the European countries, and the General Survey on Working Conditions, 2013 for Japan.
Second, in countries where information on additional days provided through collective bargaining exists, two main patterns emerge: in a first group of countries (the Czech Republic, Finland, Italy, the Netherlands, Norway, Sweden and the United- Kingdom), the average amount of leave effectively taken is at or close to the negotiated provisions. In a second group (Belgium, Denmark, Estonia, Germany, Latvia and Switzerland), the amount of leave actually taken is below the negotiated provisions: in the case of Denmark and Germany, differences between collectively agreed paid leave (which are among the most generous in OECD countries) and average leave effectively taken are particularly marked. These patterns are however not straightforward to interpret as they do not account for the share of workers actually covered by collective agreements.
5.1.3. Teleworking
Regulatory settings of teleworking across OECD countries
While it prominently came to the fore during the COVID-19 crisis, teleworking (see Box 5.4 for a discussion about the different ways of defining the concept) had started being regulated in some OECD countries long before that. For instance, in European Union countries, the 2002 Framework Agreement on Telework signed by European social partners had led most signatory countries to define clear rules surrounding the practice of employees working away from the employers’ premises in laws or central collective agreements.
Since 2010, the issue of access to teleworking has been the object of reforms in several countries. For instance, in the United Kingdom, the Flexible Working Regulations Act of 2014 introduced the right to request flexible working arrangements (including teleworking) for all employees with at least six months of service (excluding agency workers). Employers’ ground for refusal was limited to business reasons. A similar reform was implemented in New Zealand in 2015, when an amendment to the Employment Relations Act allowed all employees (and not only, as was previously the case, those with caring responsibility) to request flexible work arrangements (including teleworking).
As of 2020, access to teleworking for workers is associated with different legal guarantees across OECD countries. In some, a statutory right to request teleworking is inscribed in the law; it can be more or less extensive (i.e. for all employees as in Spain or New Zealand or only for e.g. pregnant women, carers or workers with specific medical conditions, as in Lithuania), more or less conditional (i.e. enforceable for any reason as in the Netherlands, Portugal or the United Kingdom, or reserved to particular motives, e.g. work-life balance, as in Australia or Spain), and crucially, more or less enforceable, with limited possibilities for employers to refuse to accommodate employees’ requests in some countries, and no justifications needed for refusal in others, see Table 5.2. Where no statutory right to request teleworking exist, a majority of workers might be covered by a collective agreement effectively granting them this right, either at the national, sectoral or firm-level. By contrast, in a third group of countries, even though the possibility to telework might be inscribed in the law, the conditions of access to teleworking are left entirely to negotiation in individual contracts (or to firm-level agreements covering only a minority of workers).
In addition to guaranteeing workers a right to request teleworking, some countries aimed to encourage its development by introducing dedicated financial incentives for employers. In Poland, a 2014 amendment to the Act on Employment Promotion and Labour Market Institutions introduced grants for employers creating teleworking jobs for unemployed parents of a child under six years old, or for an unemployed carer who resigned from their previous jobs to take care of their child or dependant.
Different definitions of teleworking – and related cross-country data sources – are available for OECD countries. According to the most precise definition (found in Working Conditions Surveys) teleworking corresponds to situations where workers use information and communication technologies (ICTs) to work in a location other than the employer’s premises. Data sources based on this precise definition, however have a limited time coverage. Other data sources based on a looser definition of teleworking (which might not allow capturing the phenomenon as precisely) by contrast, allow analysing the evolution of the incidence of teleworking in OECD countries. Recognising the advantages and limitations of various data sources, this chapter uses several of them, on a case by case basis.
Teleworkers as “employees usually or occasionally working from home”: The EU-LFS data
The European Union Labour Force Surveys, compiled and harmonised by Eurostat, provide annual data on teleworking, defined as “employees working from home”, for European countries, Norway, Iceland and Switzerland, from 2000 onwards. They can be combined with data from the American Time Use Survey (ATUS) for the years 2003 to 2019. The underlying definition in the EU-LFS leads to a somewhat imprecise measure, since it excludes employees working remotely outside of their home but from another remote location not provided by the employer; it might also include employees working from home not using ICTs. However, this is the only comparable source that allows looking at the evolution of teleworking over time in these countries (over 20 years). In the chapter, the EU-LFS is used to compare the use of teleworking between countries by type of teleworking governance in the pre-COVID period (Figure 5.6), and the surge in teleworking during the COVID-19 crisis (Figure 5.7).
Teleworkers as “employees using ICTs always or most of the time, working in at least one other location than the employer’s premises several times a month”: Working Conditions Surveys
The European, American, and Korean Working Conditions Surveys all contain data on teleworking based on a comparable and precise definition, namely employees regularly using ICTs, and working in at least one other location than the employer’s premises several times a month. In addition, these sources are best adapted to an analysis of teleworking by socio-demographic groups, since they contain a rich array of other socio-demographic variables. The downside of using these sources is that there is only one data point (2015 for the European and American surveys, 2017 for Korea). In the chapter, these sources are used to compare the incidence of teleworking across groups (Figure 5.15).
Teleworkers as “workers working from home who were usually employed before the onset of the COVID-19 crisis”: The RePeAt data
The Representations, Perceptions and Attitudes on the COVID-19 crisis (RePeAt) survey collected data on workers working from home, at their usual workplace, or having stopped work altogether, as the first lockdowns went into effect in March and April 2020. It covered 11 OECD countries (Australia, Austria, Canada, France, Germany, Italy, New Zealand, Poland, Sweden, the United Kingdom and the United States) – see Foucault and Galasso (2020[11]) for more details. It is the only comparable source that allows measuring the incidence of teleworking (albeit loosely defined), during the first months of the pandemic. It also contains workers’ characteristics and can be used for analyses by groups. In this chapter, this source is used to look at the surge in teleworking during the COVID-19 crisis (Figure 5.7) as well as the profile of workers who teleworked in the first few months of the crisis (Figure 5.16).
Beyond access, regulations affecting working conditions of teleworkers have also evolved in many OECD countries in the last decade. For instance, the issue of who bears the cost of the teleworking equipment has been the object of regulations (often court decisions): in 2020 (in a case dating back from 2019 and the pre-COVID period) the Swiss Federal Supreme Court ruled in favour of an employee’s request to have her employer compensate her for teleworking costs. Similar judgments were pronounced e.g. in California, where employers have been required to reimburse a reasonable percentage of employees’ phone and internet costs. In Canada, the government introduced the possibility for those working from home to deduct employment expenses from their taxable income.
As of 2020, regulations of the working conditions of teleworkers were more or less extensive across countries, ranging from rules about the process of establishing teleworking arrangements (for instance that it has to be voluntary, reversible, etc.) to anti-discrimination provisions, rules about employers’ liabilities for occupational safety and health, working schedules and overtime, data privacy and cyber-security, and the cost of equipment and maintenance. These legal frameworks are sometimes set up in dedicated laws, or included in general labour laws (as in Australia, Chile, Greece, Lithuania, Portugal, Spain and Turkey, as well as Belgium and Italy for occasional teleworking) or in national or sectoral collective agreements (as in Austria, Denmark, France, Estonia, Greece and Belgium and Italy for regular teleworking). In some countries, there are no specific laws or provisions nor collective agreements, but the usual labour protection provisions apply to teleworkers without distinction (this is the case e.g. in Finland, Germany, Latvia, the Netherlands, Slovenia, Sweden, the United Kingdom and the United States).
Considering the regulation of these two main aspects e.g. access to teleworking and the working conditions of teleworkers, four patterns of teleworking governance are identified across OECD countries in 2020,66 which are summarised in Table 5.2:
In Australia, Austria, Italy (in the case of occasional teleworking, or “agile work”),67 Lithuania, the Netherlands, Portugal, Spain,68 Sweden, and the United Kingdom, there is an enforceable right to request teleworking − granted in the law or in collective agreements covering a large part of the workforce in Austria and Sweden – for at least for some categories of workers. Teleworkers’ working conditions are defined in an encompassing69 legal framework.
In Denmark, Norway, Canada70 and New Zealand, there is an enforceable right to request teleworking (centrally negotiated in Norway, and statutory in Canada and New Zealand). But rules on working conditions are left to lower level negotiations and there are no binding legislation or higher level agreement on the issue (although there might be non-binding guidelines).
In Italy for regular teleworking, Belgium,71 as well as Chile, Estonia, Finland, France, Germany, Greece, Japan, Latvia, Poland, Slovenia, Turkey and the United States, there are either no right to request teleworking or unenforceable ones (with unlimited reasons for employers to refuse employees’ requests). Yet working conditions for teleworkers are laid out in encompassing legal frameworks.
Finally, in the Czech Republic, Hungary, Israel, Korea, Mexico, the Slovak Republic and Switzerland, the issue of access to teleworking is left entirely to individual contracts or firm-level agreements, and legal frameworks specifying teleworkers’ working conditions are either very minimalistic, or entirely absent.
Teleworking regulation and the use of teleworking before the COVID-19 crisis
Despite the changes in regulations discussed above, the take-up of teleworking in OECD countries had, until the outbreak of the COVID-19 crisis, remained rather limited. In the EU in 2015, according to European Working Conditions Survey data, only 3% of employees regularly worked from home, a further 5% “highly mobile” employees worked regularly from several locations (including home), and another 10% of workers occasionally worked from home. These numbers increased only modestly over the years, going up from 7.4% of employees on average across European Union countries for which data are available (see Figure 5.6) in 2000, to 13.5% in 2019 (according to EU LFS data).
These differences in the use of teleworking across OECD countries might be partly attributable to the patterns of regulation identified above – although caution should be applied in drawing strong conclusions here. As shown in Panel A, Figure 5.6 the incidence of teleworking has been rising since 2000 in countries where an enforceable right to request teleworking exists (except in Lithuania). In most countries with no enforceable right to request teleworking and no encompassing legal framework, the incidence of teleworking had been stagnating below 10% since 2000. Finally, the incidence of teleworking was highest on average − and most steadily rising since 2000 − in countries where access to teleworking is granted trough collective bargaining, while it was below average (but rising) in countries where access is statutory − with the exception of the United Kingdom and the Netherlands in recent years. This is not really surprising when considering that in almost all countries where the right to request teleworking is statutory, this right does not apply to all workers but only to specific categories of workers.72 By contrast, the right to request teleworking, when negotiated through collective bargaining, often is more encompassing.
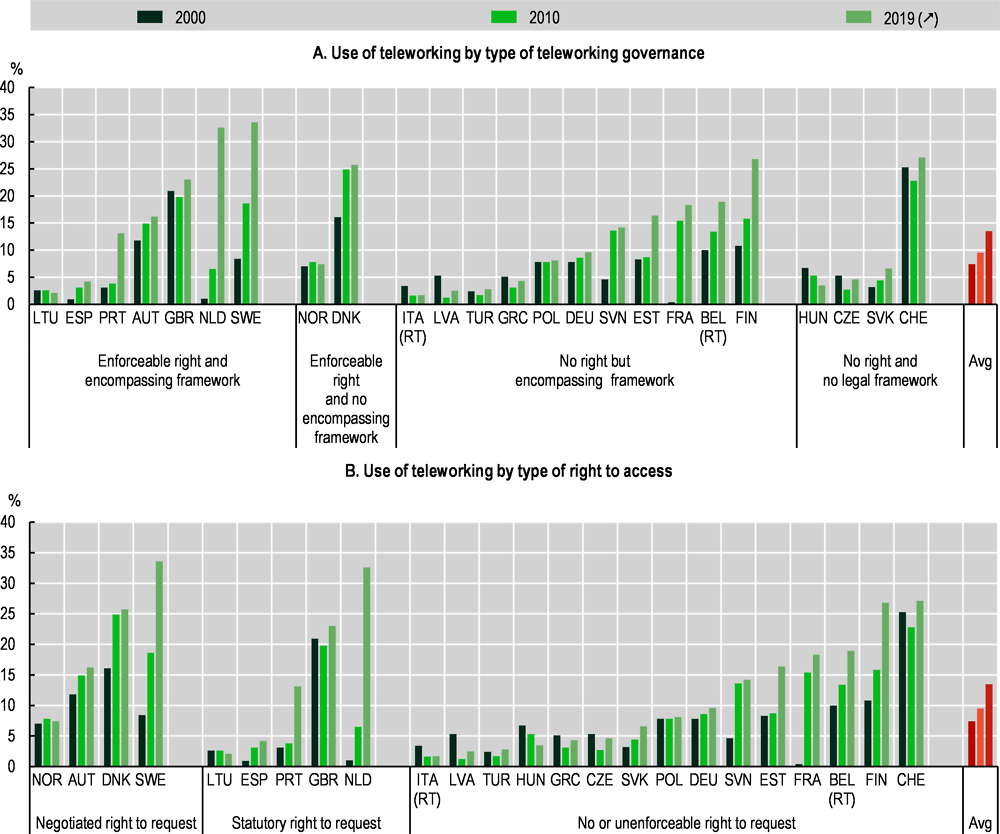
Note: Average (“Avg”) is the unweighted average of the 24 OECD countries shown in this chart. 2000 refers to 2001 for Poland, the Slovak Republic and Switzerland, to 2003 for Latvia, and to 2006 for Turkey. RT: regular teleworking.
Source: OECD calculations based on annual results from the European Union Labour Force Survey (EU-LFS) published by Eurostat (employed persons working from home, lfsa_ehomp).
Importantly, however, these averages hide important variation within groups: in the group of countries with a negotiated right to request teleworking, the proportion of teleworkers amounted to only 7.4% in Norway, against 33.6% in Sweden in 2019; and while 18.3% of French workers were teleworking in the absence of any statutory or negotiated enforceable right to request teleworking, this was the case for only 2.5% of Latvian workers in the same situation. These intra-group variations suggest that regulation is only one of the elements influencing the take-up of teleworking in practice. Technical limits to teleworking (i.e. the fact that not all jobs can be done remotely since some require a significant amount of physical tasks, that not all firms are equipped with the adequate infrastructure, and that some regions might not have yet benefited from the roll-out of fast broad-band connections – see e.g. OECD (2020[12]) – also matter in explaining cross-country and within-country variations, since the proportion of jobs that are “teleworkable” is not the same in all countries73 – see e.g. OECD (2020[13]; 2021[14]; 2020[15]). The development of teleworking is also likely to be driven by the desire to avoid commuting time, and therefore to differ across regions. Yet another factor that is likely to matter is variation in national management culture. The importance of the latter was particularly highlighted during the COVID-19 crisis, where the important and rapid deployment of teleworking in many countries as an answer to the health crisis (see Section 5.1.4 and Box 5.5) indicate that substantial non-technical obstacles, such as cultural obstacles and workers’ fear of stigmatisation, might have been hindering this development in the pre-crisis context.
5.1.4. Recent adjustments following the COVID-19 crisis
Changes in working hours regulation
If the unprecedented reduction in hours worked in 2020 across the OECD was largely shaped by a massive reliance on job retention schemes in many countries, notably through publicly subsidised reductions in working time (see Chapters 1 and 2), information collected in the OECD policy questionnaire showed that a few regulatory changes in the limits on working hours, the conditions for the use and duration of overtime or the averaging arrangements were also introduced to facilitate firms’ adjustment to the COVID-19 crisis.
In France, for instance, the March 2020 ordinances temporarily authorised firms in strategic sectors to increase the maximum daily working hours from 10 to 12 hours,74 the maximum weekly total hours from 48 to 60 hours and changed the averaging rules for normal hours from 44 to 46 hours on average for 12 consecutive weeks. In Germany, the April 2020 Working Hours Ordinance authorised an extension of daily working time up to 12 hours, while the weekly working time could be extended beyond 60 hours in exceptional cases. In Greece, between March and August 2020, employers who had exhausted the legally prescribed overtime ceilings of their workers, could use overtime without approval from the Ministry of Labour and Social Affairs in the respect of maximum daily limits. In Israel, the Ministry of Labour introduced in March 2020 a temporary permission to work additional hours up to 67 hours a week (including overtime) but no longer than 90 extra hours a month. The permission also included the possibility to work up to 14 hours a day including overtime, up to 8 times a month. In Portugal, the annual limits on the duration of overtime were suspended in March 2020 for essential public services workers, and workers in private charitable institutions, non-profit associations, co-operatives and other social economy entities that carry out essential activities in the social and health area. In Norway and Sweden,75 national-level collective agreements gave room for more flexibility to actors at the local level regarding the extended use of overtime.
Changes in paid leave regulation
To face the challenges posed by the COVID-19 crisis, different measures were introduced across OECD countries to adjust the regulation of paid leave, either through ordinance, decree, statutory reform or collective bargaining. Some aimed at smoothing the potential accumulation of paid leave and at offering greater flexibility to employers, allowing them to mandate employees to take leave or to modify the modalities of leave request (by e.g. fragmenting employees’ paid leave in several blocks, reducing notification periods, etc.). In Austria, employers were allowed to unilaterally mandate the use of vacation days during the COVID-19 crisis.76 Some countries also authorised employers to suspend or postpone the employee’s paid leave if deemed necessary in specific sectors or occupations, such as health care and social service or caregivers (that was the case in e.g. Finland).77
In parallel, regulations were also adjusted in some OECD countries to offer employees the possibility to postpone their paid leave to the following year, exchange days off against money or to take additional leave at a lower rate than normal pay or even unpaid, pending employer‘s approval (as in Australia).78 In Spain, a royal decree-law was introduced in March 2020, regulating recoverable paid leave for employees who do not provide essential services, in order to reduce population mobility. In the United Kingdom, a temporary law was introduced in May 2020 to allow employees to carry over into their next two years up to four weeks of paid leave, if they could not take it due to the impacts of the pandemic.
Changes in teleworking regulation
As outlined above, surveys conducted in mid-April 2020 showed a massive surge in the share of employees working from home, from 16% of employees before the crisis, to 37%79 in March 2020 (Figure 5.7). This large and rapid increase in the incidence of teleworking was observed in most OECD countries, independently of whether and how they granted workers access to teleworking in the pre-crisis context. This generalised surge is not surprising since the large recourse to teleworking was mandatory where possible in many countries, to try and contain the spread of COVID-19 during the first wave of the pandemic.
Many countries sought to encourage the recourse to teleworking by introducing temporary amendments to their pre-existing regulation on teleworking. Poland and Colombia80 introduced a new status for “exceptional teleworking” with simplified rules. Some countries allowed employers to unilaterally impose teleworking to employees (this was the case e.g. in Hungary, Lithuania, the Slovak Republic, Greece and Italy). In other cases (e.g. in Italy and Greece) countries granted a temporary unconditional right to telework for all employees in “teleworkable jobs” (i.e. jobs that could technically be done from home). Spain granted an unconditional right to telework to students and victims of gender-based violence. Others, such as Portugal and Belgium, mandated the use of teleworking for all teleworkable jobs. Several countries simplified the procedures to request and notify teleworking (e.g. Italy, Australia, and Turkey).
Some countries offered financial support for firms transitioning to teleworking arrangements: Japan and Germany reimbursed part of firms’ cost, Belgium allowed employers to grant a tax-and-social-security-free allowance to their employees to cover teleworking-related costs. Belgium, France, Germany, Luxembourg and the Netherlands concluded tax agreements to allow cross-border workers working from home to still be taxed in the country of employment rather than that of residence. In Austria, in the face of the rising numbers of teleworkers during the pandemic, accidents occurring while working from home until the end of 2020 were classified as work accidents and covered under the work accident insurance.
In addition to temporary measures during the outbreak, the forced collective experiment with teleworking brought by the health crisis hurried some countries into more permanent changes, either by encouraging social partners to initiate negotiations on the issue, as in Japan, or by encouraging governments to put forward reform proposals that had been in the pipeline for some time, as in Chile or Germany, where discussions are ongoing around a proposed “Mobile Work Act”, which would introduce, among other things, an enforceable right to request teleworking (employers would have to motivate their refusal), and a mobile work accident insurance. In January 2021, Mexico adopted a new regulation on teleworking which introduced a requirement for employers to detail teleworking conditions in written contracts, established employers’ responsibility for teleworking equipment and costs (including e.g. electricity and internet costs), and protected employee’s privacy as well as their right to disconnect. In April 2021, Austria also introduced a new “home office package”,81 which, among other things, spelled out the conditions of access to teleworking (via individual and collective agreements), as well as employers and employees’ liabilities regarding work equipment and occupational health and safety. The COVID-related regulation on occupational accidents (establishing employer liability for work accidents in the home office) was made permanent, but limited to the employee’s home (excluding other places of remote work). Following a consultation with the social partners, Turkey also introduced a new regulation on teleworking in March 2021, which clarified the legal framework surrounding its practice.
The generalised experiment in mass teleworking has made one issue particularly salient to regulators and the general public, namely that of the risk of work intensification, degraded work-life balance and blurring of the boundaries between working and non-working times and spaces linked to the introduction of work into workers’ private sphere (OECD, 2020[16]; Mann and Holdsworth, 2003[17]). Although “right to disconnect” legislations already existed prior to the pandemic (e.g. in France, and in Chile),82 they are now being discussed in an increasing number of contexts. For instance, in January 2021 the European Parliament adopted a text calling on the European Commission to put forward a legislation recognising the right to disconnect as a fundamental right, and the need to ensure that workers exercising it face no repercussion. In June 2020 the European social partners adopted a Framework Agreement on Digitalisation specifying the “modalities of connecting and disconnecting” including a series of preventive measures aimed at guaranteeing workers’ right to disconnect. The new Mexican legislation on teleworking also mentions employees’ right to disconnect.
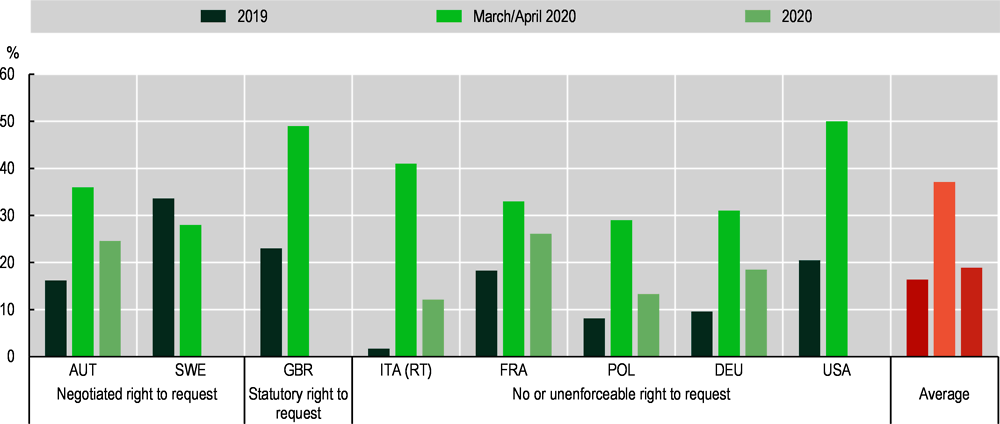
Note: Statistics for the years 2019 and 2020 refer to the share of employees (aged 15-64) working usually or occasionally from home, and to the share of workers working from home in March/April 2020 who were usually employed before the onset of the COVID-19 crisis. “Average” is the unweighted average of the eight (five for the year 2020) OECD countries shown in this chart. RT: regular teleworking.
Source: OECD calculations based on annual results from the European Union Labour Force Survey (EU-LFS) published by Eurostat (employed persons working from home, lfsa_ehomp) for the European countries in 2019 and 2020, results from the American Time Use Survey (ATUS) 2019 published by the Bureau of Labor Statistics (BLS) for the United States, and Foucault and Galasso (2020[11]) based on the REPEAT (REpresentations, PErceptions and ATtitudes on the COVID-19) survey for all countries in March/April 2020.
Overall, the pandemic crisis brought forward a lot of regulatory changes around teleworking across OECD countries, which might in part sustain the higher incidence of teleworking as a new mode of working as the crisis subsides. This is all the more likely that the crisis might have also helped overcoming the barriers linked to cultural reluctance to teleworking: a US-based study argues that because of diminished stigma and better-than-expected experiences with working from home for both employers and workers (among other factors), teleworking is likely to stick, and estimates that about 22% of working days in the United States are likely to be teleworking days in the future, compared with 5% pre-crisis (Barrero, Bloom and Davis, 2020[18]).
As shown in Section 5.1, working hours and work organisation, while partly influenced by differences in the content and governance of regulation, are likely to evolve with other factors, including labour force participation,83 changes in taxation and social protection, phases of the business cycle, as well as cultural trends. The incidence of teleworking, for instance, is likely to be fostered by attitudinal changes, or digital skills or IT infrastructure. Evolutions in working hours are likely to reflect a number of cyclical and structural effects, such as sectoral and occupational shifts, or technological change modifying the amount of time allocated to unpaid work, changes in productivity, wages level, etc., but also evolutions of societal norms.
5.2.1. Do employees still work less than their parents?
The idea that productivity increases, driven notably by technological progress, would go hand in hand with diminishing working hours, goes back a long way and held true, when referring to actual hours, for most of the 20th century: generations after generations, workers used to work less than their parents (Maddison, 1995[19]). However, when focusing on median usual hours worked by full-time employees over the last 25 years, this view is not borne out in the data. Although there was a diversity of small variations across countries – with average usual hours for full-time employees slightly increasing on average in the 2010s in Belgium, Finland, Italy, Greece, and Portugal, stagnating on average in the United States, and slightly decreasing in other countries (see Annex Figure 5.A.3), average weekly hours usually worked by full-time employees were in fact largely stable (from 40.6 in 1995 to 40.3 hours in 201984 on average in the OECD, see Figure 5.8.
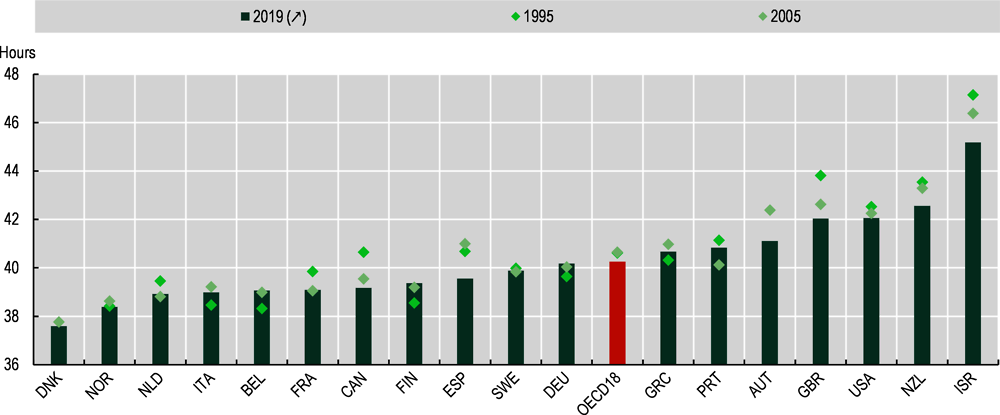
Note: Data for OECD 2018 in 1995 and in 2005 overlap on the figure. No data for Austria in 1995 due to a new categorisation of full-time job based on self-assessment since 2004 (based on a usual hours criterion with a 35 hours cut-off in the main job before that year); 2005 refers to 2007 for Denmark due to the introduction of a new weighting scheme. Results for Israel are not fully comparable before 2012 due to the change from a quarterly to a monthly Labour Force Survey and changes in the definitions from “civilian labour force” to “total labour force” (including those who are in compulsory or permanent military service). OECD18 is the unweighted average of the 18 OECD countries shown in this Chart. See Annex Figure 5.A.3 for time series.
Source: OECD estimates based on the Canadian Labour Force Survey (CLFS) for Canada, the European Union Labour Force Survey (EU-LFS) for the European countries, and the Current Population Survey (CPS) for the United States; and the OECD Employment Database, http://www.oecd.org/employment/emp/onlineoecdemploymentdatabase.htm, for Israel and New Zealand.
Since data on usual hours do not include overtime,85 Figure 5.9 displays trends in paid and unpaid overtime for full-time employees in OECD countries for which data are available over the last decade. The average incidence of paid overtime per employee remained relatively stable between 2006 and 2019. By contrast, weekly hours of paid overtime per worker reporting it fell by about one hour between 2006 and 2019. As for the incidence of unpaid overtime, it slightly decreased on average, from 6.2% in 2006 to 5.1% of employees in 2019. Those working unpaid overtime in 2019 also worked on average close to one hour less each week than in 2006.
Beyond average trends in the incidence of paid and unpaid overtime, there are some variation across countries. In Portugal, the incidence of both paid and unpaid overtime increased noticeably, reaching 7.7% in 2019, up from 3.9% (4.9% for unpaid overtime) in 2006, while they both decreased in Greece in the same period. In Slovenia, the incidence of paid overtime increased from 8.9% to 11.9% – while that of unpaid overtime decreased from 6.2% to 3.3%. The incidence of paid overtime increased noticeably in Finland from 9.6% to 16.4%, and most strikingly in France, from 4.3% in 2006 to 19.1% in 2019.86 The incidence of unpaid overtime decreased most strongly in Austria (reaching 3.5% of full-time employees in 2019, down from 9.8% in 2006), while it increased noticeably in Denmark, from 2% to 6% of employees.
Looking at trends in usual weekly hours and weekly overtime illustrates how the usual week of the average full-time employee in the OECD has evolved in the last decades. This metric is informative and easy to understand. However, it cannot be used to assess how the overall quantity of work per full-time employee changed over time, since the latter is also a function of the number of weeks worked (and number of days off taken), in addition to the usual amount of work per week. However, there are no sources allowing for a reliable comparison of days off taken across countries. Instead, Figure 5.10 complements the previous figures and helps assessing the evolution of the overall quantity of work per full-time employee by showing the evolution of average annual hours actually worked per worker between 1970 (where possible, see Panel A) and 2019, and decomposing it into the effect of changes in the share of part-time and full-time jobs, and of changes in hours worked respectively by full-time and part-time workers.
Between 1985 and 1995 (Panel B) the decrease in average actual hours for the OECD average was primarily attributable to the reduction in the share of full-time employees in total employment (except in Denmark, where it was due to the reduction in hours worked by full-time employees). Between 1995 and 2019 (Panel A), and between 2000 and 2019 (Panel C) the decrease was first and foremost due to the reduction in hours worked by full-time employees, and to a smaller extent, by the reduction in the share of full-time employees in total employment. In other words, for all countries in which data are available, actual hours for full-time workers decreased more since 1995 than between 1985 and 1995.
In OECD countries for which data are available over the whole 1970-2019 period, annual hours actually worked per employed decreased by 17.9% (0.4% annually). However, this decrease was not constant but decelerated over time: hours actually worked decreased by 0.8% annually between 1970 and 1985, by 0.2% annually between 1985 and 2000, and by 0.3% annually between 2000 and 2019. In countries for which data only go back to 1995, annual actual hours decreased on average by 6% (0.3% annually). Finally, in countries for which data only go back to the 2000s, annual actual hours decreased on average by just under 4% (0.2% annually). These data also point towards a deceleration in the reduction of actual working time. This confirms previous findings according to which the historical trend towards lower working hours which could be traced back to the 19th century in most OECD countries has considerably slowed down – if not almost halted, see e.g. Evans, Lippoldt and Marianna (2001[20]), Bangham (2020[21]).
The 6% decrease in actual hours worked over the 1995-2019 period (which, as shown above, is primarily due to a decrease in hours worked by full-time employees) is not inconsistent with the stagnation in usual weekly hours documented over the same period (Figure 5.8.) and the limited reduction in overtime hours87 (Figure 5.9): taken together these trends suggest that variations in actual hours are likely to owe to a reduction of the number of weeks actually worked (rather than the amount of hours worked each week).
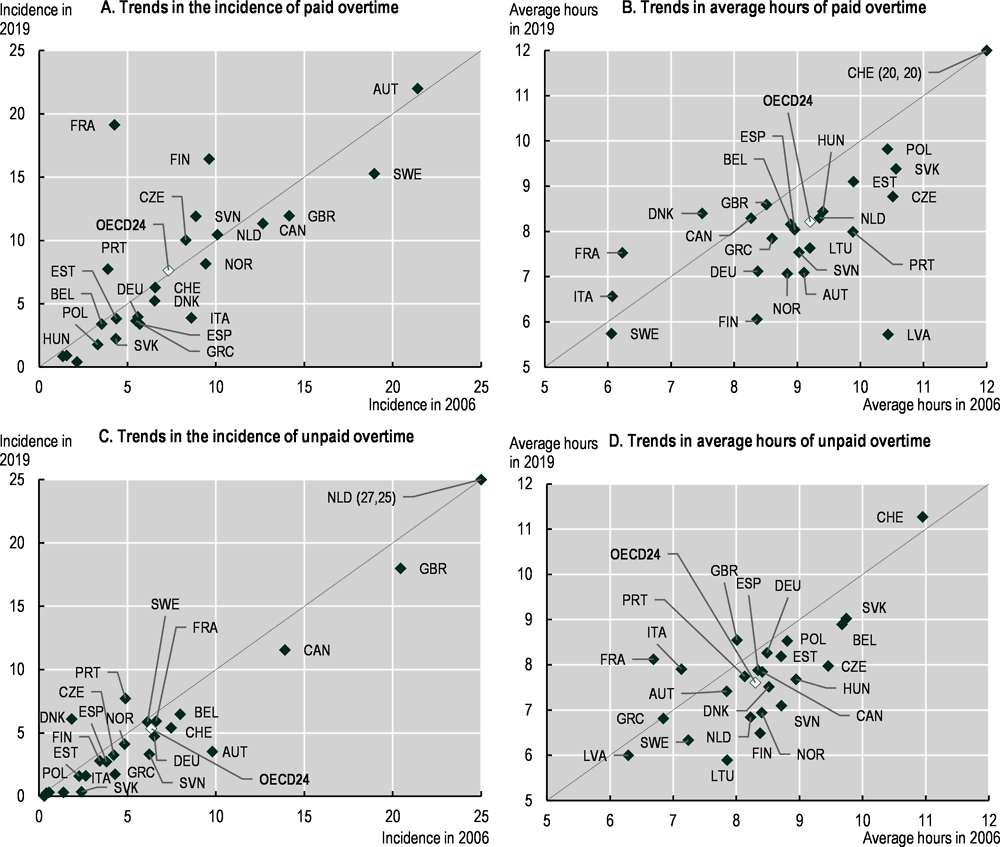
Note: 2006 refers to 2010 for Switzerland and 2019 refers to 2018 for Norway. OECD24 is the unweighted average of the 24 OECD countries shown in this chart (excluding Australia, Chile, Colombia, Costa Rica, Iceland, Ireland, Israel, Japan, Korea, Luxembourg, Mexico, New Zealand, Turkey and the United States).
Source: OECD calculations based on the Canadian Labour Force Survey (CLFS) and the European Union Labour Force Survey (EU-LFS).
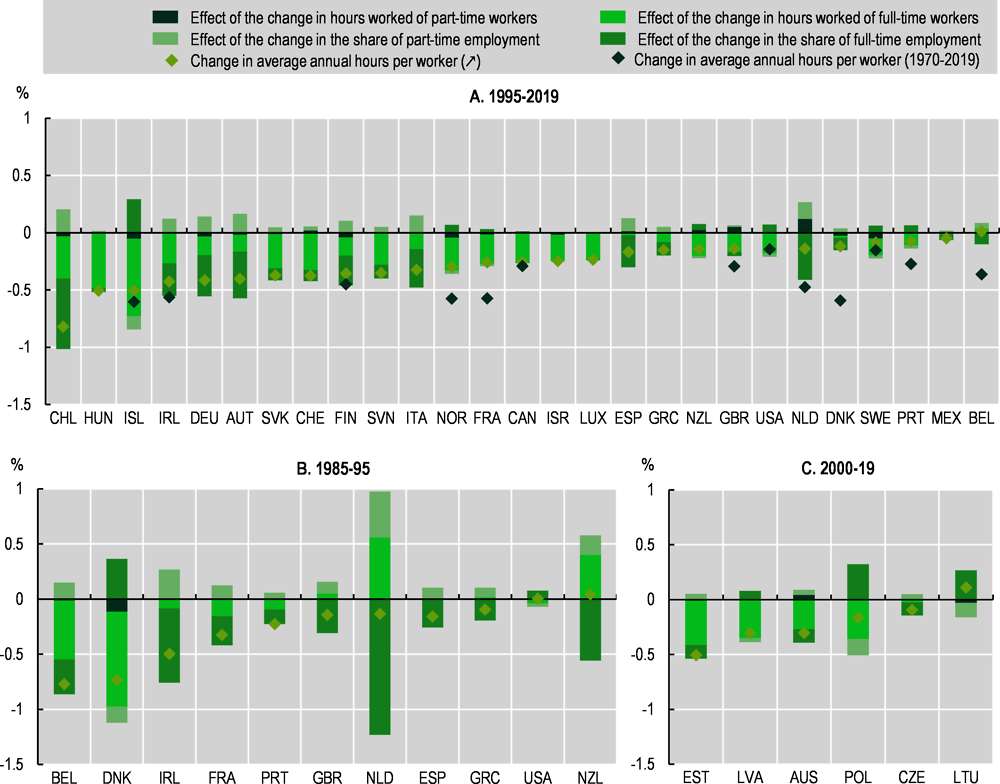
Note: 1995-2018 for Belgium, 1996-2019 for Chile, Norway, Slovenia and Switzerland in Panel A. 1986-95 for New Zealand and Portugal and 1987-95 for Spain in Panel B. 2001-18 for Australia and 2001-19 for the Czech Republic and Poland in Panel C. No data for Colombia, Korea and Turkey.
Source: Calculations based on the OECD Employment Database, http://www.oecd.org/employment/emp/onlineoecdemploymentdatabase.htm.
5.2.2. Time for what? Time use patterns across OECD countries
To get a better contextual grasp of evolutions in working time, this section reviews trends in time use, contrasting the shares of time spent on paid work, unpaid work including childcare activities, personal care, and leisure derived from time-use surveys.88 These surveys record information on how individuals allocate their time across different daily activities, through the use of time-diaries. This information on daily activities is then re-coded into a set of descriptive categories, so that a 24-hour period (or 1 440 minutes) can be split into a sequence of time spent on main activities.89
Figure 5.11 shows that leisure time has slightly decreased on average across OECD countries for which data are available. Compared to the 1970s, the daily leisure time of a full-time worker aged 15-64 decreased by 15 minutes on average in the 2010s (1.5 hours per week). While the average time spent on leisure increased between the 1970s and the 1980s, it decreased in following decades, at an accelerating rate. In the 2010s, average time spent on leisure decreased in 8 out of 13 countries for which data are available: for instance, it dropped by 14% in Korea, by 11% in Spain, by 6% in the Netherlands, by 5% in Hungary and by 1% in the United States. Other studies observed similar patterns in leisure time for the United States, i.e. a modest increase in average time spent on leisure from the 1960s until the 2000s, followed by a decrease afterwards – see e.g. Ramey and Francis (2009[22]).
Figure 5.11 also considers the share of time allocated to each of the five above-mentioned categories of activities, over a 24-hour period, and how these shares have evolved over the last 50 years. Not surprisingly, in all countries considered, most of the time is allocated to personal care activities (which include sleeping); this proportion increased on average over the last two decades (by 1.4% in the 2000s and by 2.1% in the 2010s). Cross-country variation in the proportion of time allocated to personal care is relatively small, and ranged from 38% in Mexico to 46% in Korea in the 2010s.
After personal care activities, paid work is the next item on which people spend most of their time, even if this proportion declined since the 1970s on average.90 By contrast with time spent on personal care, the proportion of total time dedicated to paid work varied much more across OECD countries for which data are available, ranging from 20% in Finland to 32% in Mexico in the 2010s.
Time dedicated to leisure comes as the third item on which individuals spend their day – about 16.5% of total time was, on average, spent on leisure in the 2010s and 2000s. Bearing in mind the caveats related to cross-country comparisons, the average time allocated to leisure in the 2010s varied from about 2 hours and a half per day (or about 10% of total time) in Mexico, to 4 hours and 44 minutes (or 20% of total time) in Finland, among the 13 OECD countries for which data are available in the 2010s (Figure 5.11).
Finally, the share of time allocated to unpaid work amounted to 11% on average in the 2010s, and was rather stable throughout the last decades; however this share varies a lot between countries, ranging from 5.4% in Korea to 15% in Mexico in the 2010s. These cross-country differences are likely to owe in part to demographic and cultural patterns, especially since childcare activities are included in this category.
While the order between the broad categories (with personal care taking the most time, and unpaid work the least) is consistent across countries, there are some cross-country variations in the work-leisure balance between categories. For instance, in the 2010s, Mexican workers spent more than three times as much on paid work as on leisure, while Korean workers spent twice as much; workers in Canada, Italy, Spain, Hungary, Turkey and the United States spent between 1.5 and 1.8 times as much on paid work as on leisure, while those in the Netherlands and the United Kingdom spent 1.3 times as much, and those in Germany, Finland and Norway spent about the same amount of time on both activities.
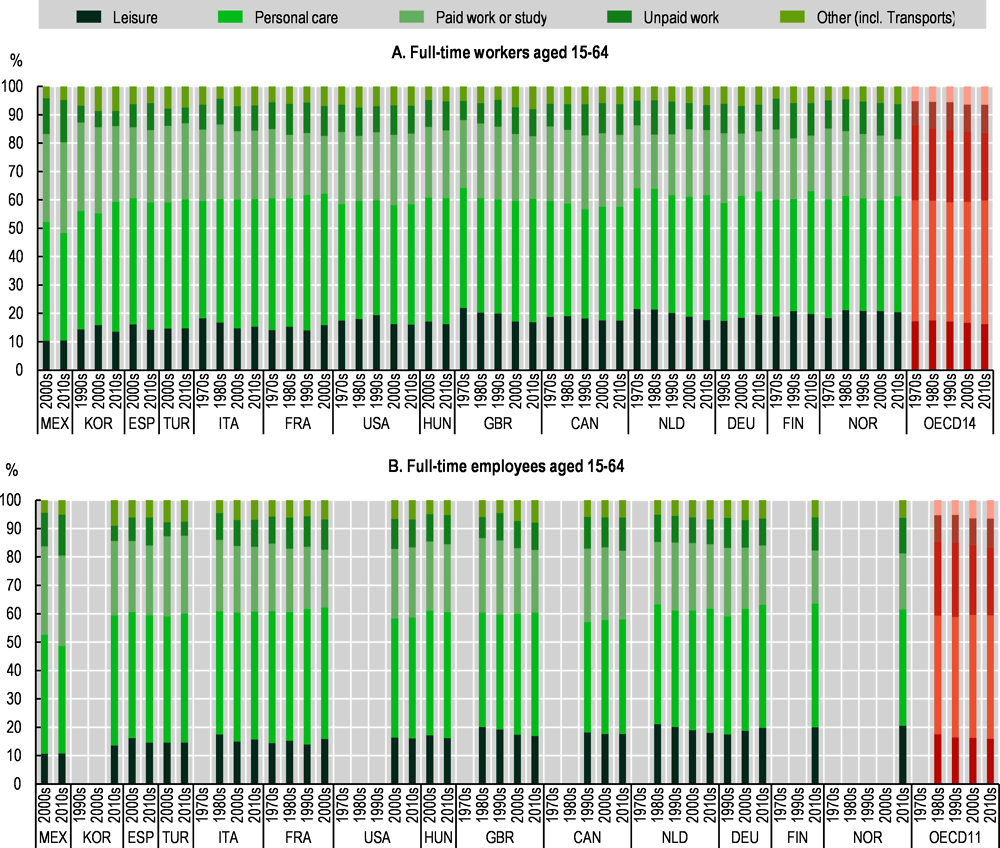
Note: Statistics refer to the primary activity, defined as the activity that the respondent first reported, as her main activity, excluding any secondary activity done simultaneously. In order to facilitate comparison over time, transport time (as well as commuting time to and from paid work or study) has been treated separately. As a result, the five broad categories of activity presented in this chart differ from those currently used in the OECD Time Use Database (see: https://stats.oecd.org/Index.aspx?DataSetCode=TIME_USE). Time use data shown here are grouped in five broad categories: 1) paid work or study, which includes work-related activities, e.g. time spent on paid work (full or part time), studying, and time spent looking for a job; 2) unpaid work, which includes domestic activities (cleaning, shopping, etc.) and time spent caring for household and non-household members; 3) personal care, which relates to all regenerative activities, such as sleeping, eating, grooming, health related self-care, etc.; 4) leisure which concerns a wide range of indoor and outdoor activities, such as sports, entertainment, socialising with friends and family; and 5) others (including transports) which includes all activities not covered elsewhere (e.g. religious activities and civic obligations, but also time spent going places and commuting). However, travel time as part of paid work activities and pleasure drives are classified in category 1 (paid work or study) and category 4 (leisure) respectively. To correct for potential imbalances in the repartition of week-ends and weekdays, results are first averaged by day of interview, and then over each week.
Estimates for Mexico are not fully comparable, due to methodological differences in survey design which do not comply with standardised guidelines. Germany in the 1990s refers to West Germany only. Countries are ordered by ascending order in time spent in leisure of full-time workers (Panel A) in the 2010s (in the 2000s for France).
OECD14 is the chained unweighted averages of the 14 OECD countries shown in Panel A based on the decades available. Trends are similar when calculating simple (not chained) averages, restricting the country sample to the seven countries for which data cover each year in the entire period. Statistics for the 2000s are based on the 14 OECD countries where data are available; statistics for the 2010s are based on the unweighted average change between the 2000s and the 2010s for 13 OECD countries (excluding France where data are not available for the 2010s); statistics for the 1990s are based on the unweighted average change between the 1990s and the 2000s for 10 countries (excluding Hungary, Mexico, Spain and Turkey where data are not available for the 1990s); and statistics for the 1980s and 1970s are based on the unweighted average change between the 1980s and the 1990s and the 1970s and the 1980s for the eight OECD countries where data are available for these periods (excluding Germany, Hungary, Korea, Mexico, Spain and Turkey). OECD11 is the chained unweighted averages of the 11 OECD countries shown in Panel B, based on the decades available, constructed following the same methodology described above for OECD14.
Source: OECD estimates based on the Multinational Time Use Study (MTUS) and national Time Use Surveys.
Historically, societies where hourly productivity went up have often chosen to trade-off additional gains in output per worker (and potential further gains in wages) for more time for other activities, leading to parallel trends in hourly productivity and in average time spent on non-working activities (Huberman and Minns, 2007[23]). Figure 5.12 contrasts trends in average time spent on leisure, in hourly productivity, as well as in average hours worked per employed and average real hourly earnings, in OECD countries where this is doable. This helps shedding light on the decrease in leisure documented in Figure 5.11.
Figure 5.12 shows a decreasing trend in actual hours per worker in the 14 countries reviewed (Panel B). However, in most countries (except in Italy, Korea and the United States), most of the decrease happened between the 1970s and the 1980s; starting in the 1990s, hours decreased at a much slower pace. On average in the 11 countries for which data are available over the past five decades, hours actually worked decreased but at a slowing pace, from 0.9% annually in the 1970s, to 0.2% in the 2010s. This is consistent with the slowing down of the reduction in actual hours observed on Figure 5.10.
Figure 5.12 confirms that the average time spent on leisure has decreased in the past five decades. By contrast, since the 1970s, hourly productivity has increased – albeit at a decreasing pace. The annual growth rate of hourly productivity has slowed down from 3.7% in the 1970s, to 2.4% in the 1980s, 2.1% in the 1990s, 1.2% in the 2000s and 0.7% in the 2010s. Annual growth rates of average hourly earnings were by and large aligned to those of hourly productivity – at 4.1% on average in the 1970s, 1.7% in the 1980s, 1.4% in the 1990s, 1.8% in the 2000s and 0.8% in the 2010s. These parallel trends suggest that, on average, while changes in productivity have been reflected in changes in hourly earnings, productivity increases have not led to extra leisure time for full-time employees.91 This is consistent with findings in previous studies for particular countries, which have pointed to a gap between trends in leisure and hours worked on the one hand, and trends in hourly productivity on the other – see e.g. Ramey and Francis (2009[22]) on the United States.
This finding is sometimes pitted against Keynes’ 1930 prognosis that productivity would increase by four to eight times between 1930 and 2030, and that this rise in productivity would translate into a large increase in leisure and a drastic fall of average working hours to 15 hours a week (Keynes, 1930[24]). Looking at the United States, Ramey and Francis (2009[22]) note that while the predicted rise in productivity turned out to be rather accurate, the associated dramatic rise in leisure did not materialise. Figure 5.12 confirms that the increase in hourly productivity on average in the last 50 years did not translate into an increase in leisure, but was instead paralleled by a decrease in leisure time. One possible explanation for this is that workers have opted for increases in hourly wages instead of reduction in hours worked.
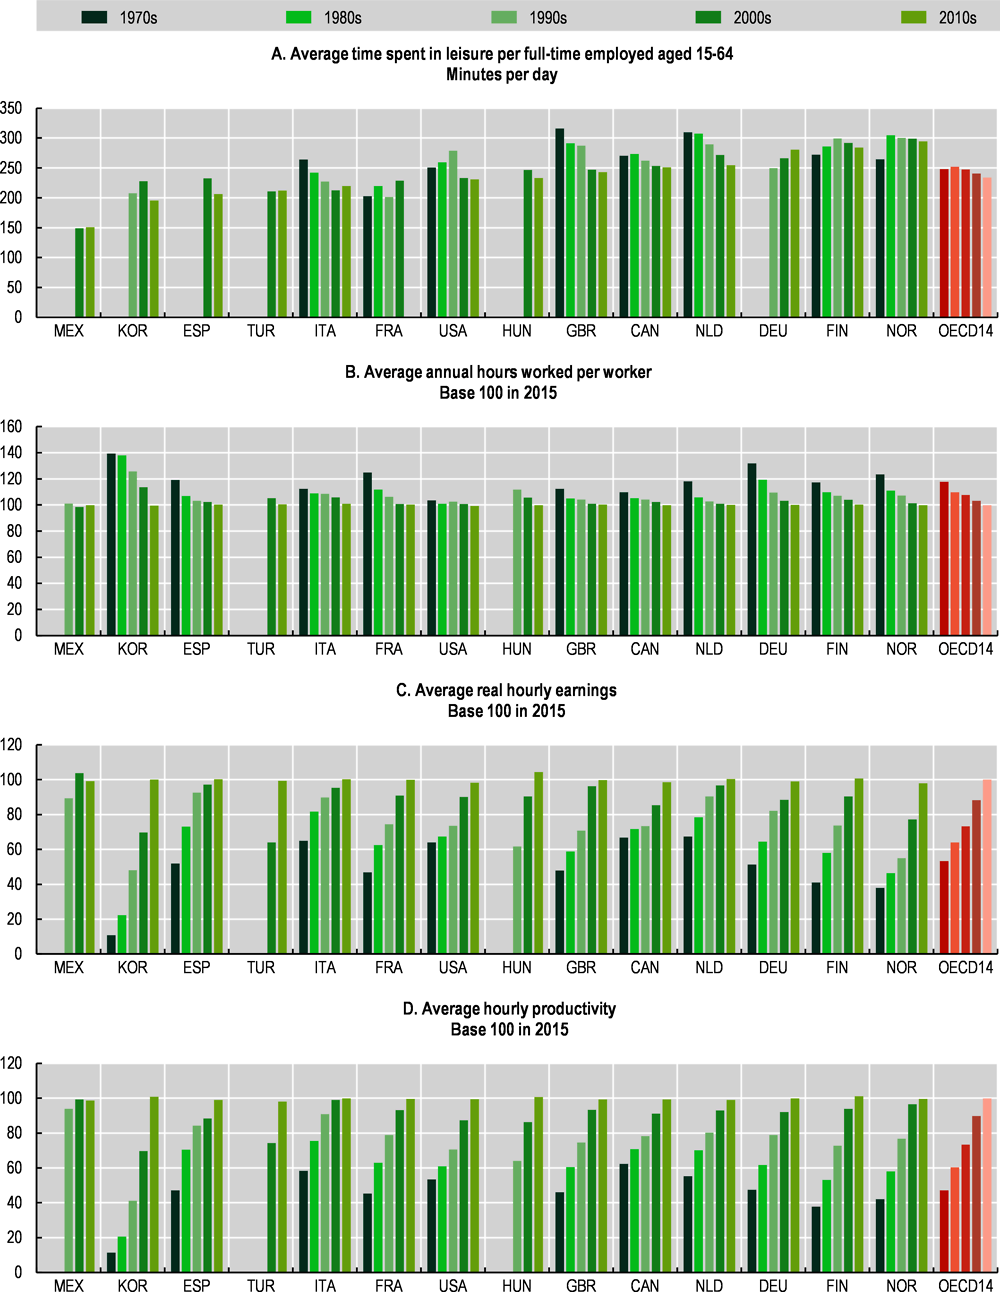
Note: Statistics on time spent in leisure refer to the primary activity, defined as the activity that the respondent reported as her main activity, excluding any secondary activity done simultaneously. Leisure includes a wide range of indoor and outdoor activities, such as sports, entertainment, socialising with friends and family, excluding transport time related to leisure excepted pleasure drives. To correct for potential imbalances in the repartition of week-ends and weekdays, results are first averaged by day of interview, and then over each week.
Annual hours worked per employed is defined as the total hours worked in the economy divided by the number of employed persons. Real hourly earnings is defined as the total wages and salaries deflated by the final consumption price index and divided by total hours worked. Hourly productivity is defined as real GDP divided by total hours worked.
OECD14 is the chained unweighted averages of the 14 OECD countries shown in this chart and based on the decades available for time spent on leisure (Panel A). Trends are similar when calculating simple (not chained) averages, restricting the country sample to the seven countries for which data cover the entire period. Statistics for the 2000s are based on the 14 OECD countries where data are available; statistics for the 2010s are based on the unweighted average change between the 2000s and the 2010s for 13 OECD countries (excluding France where data on leisure is not available for the 2010s); statistics for the 1990s are based on the unweighted average change between the 1990s and the 2000s for 10 countries (excluding Hungary, Mexico, Spain and Turkey where data on leisure are not available for the 1990s); and statistics for the 1980s and 1970s are based on the unweighted average change between the 1980s and the 1990s and the 1970s and the 1980s for the eight OECD countries where data on leisure are available for these periods (excluding Germany, Hungary, Korea, Mexico, Spain and Turkey). Countries are ordered by ascending order in time spent in leisure of full-time workers (Panel A) in the 2010s (in the 2000s for France).
Source: OECD calculations based on national Time Use Surveys, OECD (2021), “GDP per capita and productivity growth”, OECD Productivity Statistics (database), https://doi.org/10.1787/data-00685-en and OECD (2021), “Aggregate National Accounts, SNA 2008 (or SNA 1993): Gross domestic product”, OECD National Accounts Statistics (database), https://doi.org/10.1787/data-00001-en.
Indeed, beyond Keynes’s prophecy, a potential factor behind the slowing down in the rise of leisure time in the last decades could be the declining wage growth observed since the late 1990s. Productivity gains being less distributed in the form of higher wages, demand for additional leisure (or lower hours with no change in hourly wage) might have gone down in particular for workers struggling to make ends meet. In addition, the decline in wage growth is often interpreted as a sign of decreasing worker bargaining power; as shown in Huberman and Minns (2007[23]) description of long term trends in work and leisure across OECD countries, trade unions and workers’ representatives were instrumental in securing the legislative changes that materialised the increase in leisure in the form of paid leave, in the period leading up to and immediately following World War II. The decreasing trend in leisure could therefore be seen as linked to the decrease in worker’s bargaining power and decline in trade union density observed in recent decades (OECD, 2019[1]) – on the point of the link between declining worker bargaining power and declining labour share, see also (Autor et al., 2017[25]; Barkai, 2020[26]; Bell, Bukowski and Machin, 2060[27]; Bental and Demougin, 2010[28]; Ciminelli, Duval and Furceri, 2018[29]; De Loecker and Eeckhout, 2017[30])
This decline in bargaining power is likely to have affected different groups of workers differently. Similarly, trends in hours worked and time spent on non-work activities are likely to have evolved differently for different groups. In that sense, looking at aggregate trends is necessary but insufficient to get a full picture of changes in working time over the last decades. The next section therefore turns to this issue, looking at trends in hours, working arrangements and work-leisure balances across gender, education and income level groups.
Aggregate trends in working time may hide changes in the distribution of hours and flexible working time arrangements between socio-economic groups. Such differences are particularly important to document, since they can amount to growing divides over time in work-life balance, working conditions and time poverty (defined as a lack of sufficient discretionary time after engaging in paid and unpaid work and regenerative activities) across groups, with direct implications for job quality and workers’ well-being (Cazes, Hijzen and Saint-Martin, 2015[31]). Indeed, insufficient working hours may result in low earnings, while excessively long hours may have negative effects on individuals’ health and well-being (Pega et al., 2021[2]) and increase job strain; and uncertain schedules may create earnings insecurity and disrupt work-life balance.
This section exploits data from labour force surveys and time-use surveys to assess the degree of working time disparity between men and women, workers at different levels of education, as well as workers in different income groups. It also investigates the degree of mismatch between the time that workers in different groups would ideally like to devote to work and the time they actually spend working. It reviews recent initiatives in collective bargaining and recent experiments at the firm level that aim to better take into account workers’ preferences when it comes to working time.
5.3.1. Changes in the distribution of weekly working hours across groups
Beyond the aggregate patterns documented in Section 5.2, Figure 5.13 looks at the distribution of hours usually worked during the week and its evolution between 1999 and 201992 by groups for the OECD average.93 It shows the share of employees working very short hours94 (i.e. less than 10 hours per week) or very long hours (i.e. more than 48 hours per week). This allows assessing whether the distribution of hours has polarised further, and which groups of workers have been most affected.
Data on Figure 5.13 reveal that women consistently worked less hours than men on average throughout the 1999-2019 period (Panel A). Accordingly, the incidence of very short hours was also higher for women over that period (Panel C), while the incidence of long hours was lower (Panel B). However, these gender spreads narrowed over time: the gap in average hours and in the incidence of long hours slightly decreased (as average hours and the incidence of long hours decreased more for men than for women), while the gender gap in the incidence of very short hours decreased very substantially, as the share of women working less than 10 hours per week decreased at the same time as that of men in very short hours work increased.
Those average gender time gaps hide important differences between countries, both in levels and in trends (see Annex Figures 5.A.4, 5.A.5 and 5.A.6 for more details). In 2019, the gender gap in hours worked was highest in Switzerland (where men worked on average 9.3 hours more than women each week), and smallest in Lithuania, where the difference amounted to 0.9 hours. Between 1999 and 2019, the gap increased in Austria and Italy (by 2.3 hours and 1.3 hours respectively), while it decreased by 7.5 hours in Iceland. These differences reflect a number of factors, including institutional, cultural – e.g. attitudes towards female employment and gender equality – or structural ones – e.g. female labour force participation rate, employment structure, size and composition of part-time employment, etc. – for a review of this discussion see e.g. (Eurofound, 2018[32]; OECD, 2010[33]; OECD, 2016[34]; Rubery, Fagan and Smith, 1995[35]).
Significant differences also exist on average between workers with different education levels. Workers without tertiary education worked less hours than highly educated workers throughout the 1999-2019 period (Panel A). The incidence of very long hours was lower for workers without tertiary education than for highly educated workers (Panel B).Those without tertiary education were more often working very short hours than highly educated workers (Panel C), both in 1999 and 2019. Contrary to gender gaps, education gaps in average weekly hours and in the incidence of very short hours actually widened in a majority of countries over the period. By contrast, the gap in the incidence of very long hours narrowed, as the incidence of overwork for highly educated workers decreased more dramatically than that faced by those without higher education. Here as well, the OECD average masks differences across countries (see Annex Figures 5.A.4, 5.A.5 and 5.A.6 for more details).
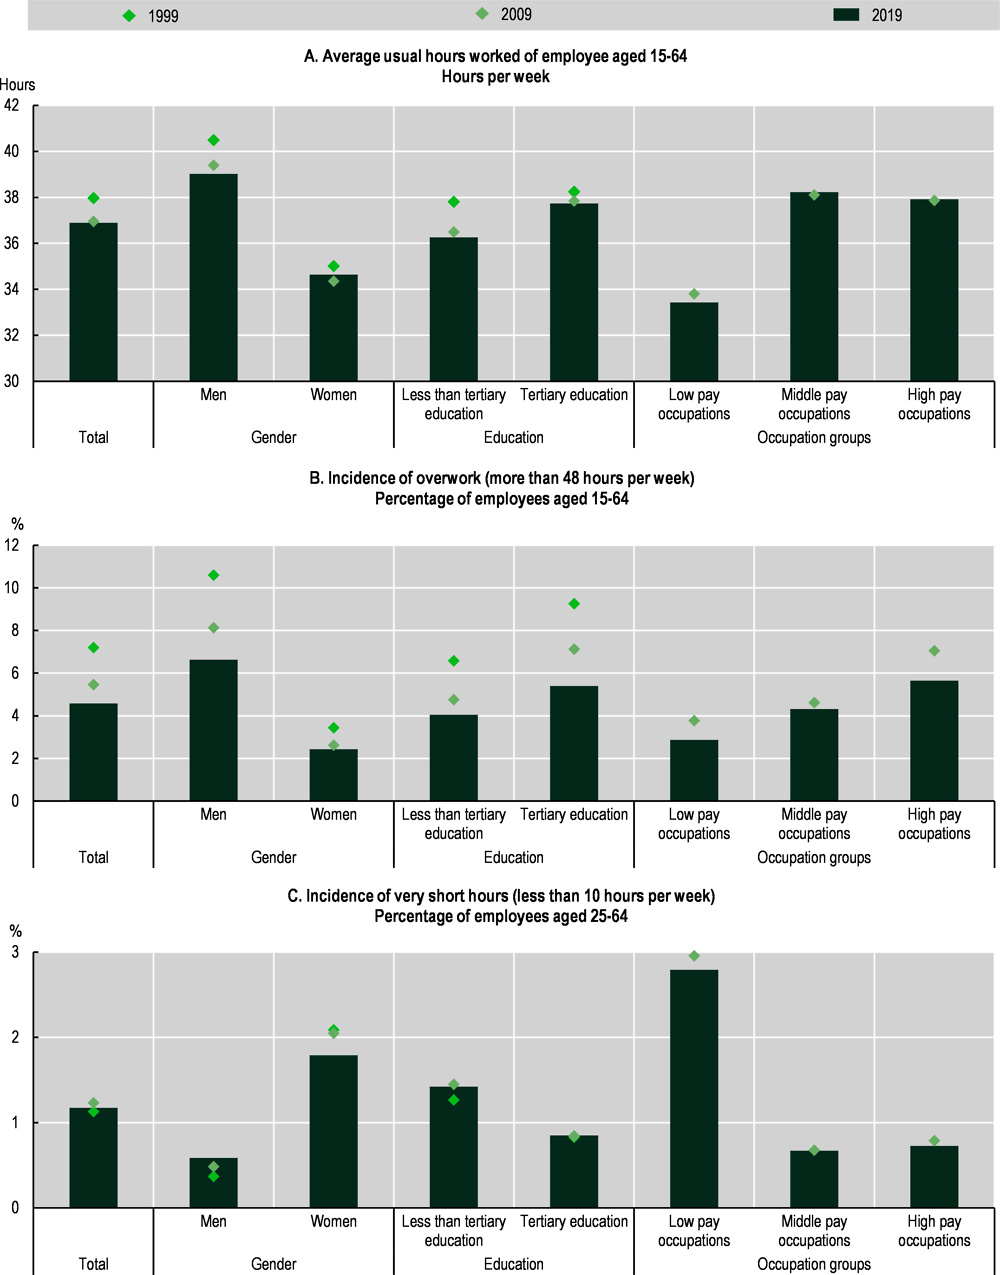
Note: Statistics refer to the unweighted averages of 28 OECD countries (excluding Australia, Chile, Colombia, Costa Rica, Israel, Japan, Korea, Mexico, New Zealand and Turkey). “Very long hours” refer to the incidence of employees working more than 48 hours during the reference week while “very short hours” refer to the incidence of employees working less than 10 hours during the reference week (excluding employees aged 15-24). Occupation groups are defined as follows: high pay occupations refer to the ISCO-08 one-digit occupations 1-3; middle pay occupations to the ISCO-08 one-digit occupations 4, 7, 8 and low pay occupations to the ISCO-88 one-digit occupations 5 and 9. See Annex Figures 5.A.4, 5.A.5 and 5.A.6 for detailed results by country.
Source: OECD calculations based on the European Union Labour Force Survey (EULFS), the Canadian Labour Force Survey (CLFS) for Canada, the Encuesta Nacional de Empleo (ECE) for Chile, the Gran Encuesta Integrada de Hogares (GEIH) for Colombia, The Encuesta Nacional de Ocupación y Empleo (ENOE) for Mexico and the Current Population Survey (CPS) for the United States.
Finally, differences in the distribution of hours are the starkest between workers in high-, middle- and low-pay occupations. On average across the OECD, workers in low-pay occupations worked much fewer hours than those in middle-and high-pay occupations, consistently throughout the 2009-19 period (Panel A). Accordingly, the incidence of very short-hours was also much higher for those in low-pay occupations than for others (Panel C). The incidence of very long hours was lowest for those in low-pay occupations, and highest for those in high-pay ones (Panel B). Moreover, gaps in average hours and in the incidence of very short hours between workers in high-pay and low pay occupations widened on average for the OECD between 2009 and 2019. By contrast, the gap in the incidence of very long hours narrowed.
Again, these results for the OECD average hide differences across countries, and even reverse patterns in Mexico and Greece, where workers in low-pay occupations worked longer hours than those in high-pay ones in 2019 (see Annex Figures 5.A.4, 5.A.5 and 5.A.6). In Mexico and Chile, the share of those in low-pay occupations working more than 48 hours a week is also higher than that of workers in high-pay occupations; the incidence of very short-hours work (less than 10 hours a week) is also higher among workers in low-pay occupations in both countries.
5.3.2. Who is flexible? Changes in the distribution of working arrangements
Flexible working time arrangements can provide employers with room for adjustment in the production process, but in some cases, they can also improve the work-life balance of employees (OECD, 2016[34]; Eurofound, 2016[36]). Working time flexibility can help working parents to reconcile their work schedule with childcare and/or school hours, and can make an important contribution to employees’ satisfaction with their work-life balance (Cazes, Hijzen and Saint-Martin, 2015[31]). However, depending on their design, flexible arrangements may also come at the expense of lower earnings and have detrimental effects on health in the long-run, even when chosen by the employees. This section documents, where available,95 the distribution across workers of three flexible working time arrangements, namely variable scheduling work (whereby employees have little to no control over their schedules), flexible working hours (whereby workers can choose their start and finish times) and teleworking.
As shown in Figure 5.14, the share of workers with access to flexible hours slightly increased from 25.5% in 2005 to 27.2% in 2015 on average for the OECD. While the trend was similar in the majority of countries for which data are available, proportions varied considerably across countries, ranging from 7.2% in Korea to almost 50% in the United States and slightly more in the Nordic countries in 2015 (see Annex Figure 5.A.8). Looking at the distribution of flexible working hours by gender, education and monthly earnings suggests that flexible hours were most often used by highly paid employees with higher education, with no particular gender pattern. The incidence of flexible hours among men and women was about the same on average in 2015, while it was higher for workers with higher education compared to those without (36.2% versus 22%), and for highly paid workers (36.3%) compared to low-paid workers (21.9%) (Panel A of Figure 5.14). These differences held over time: the education and earnings ratios remained inferior to 1 in 2005, 2010 and 2015 (Panel B). These results confirm previous studies showing that education and pay levels are important determinants of access to flexible hours arrangements (OECD, 2016[34]).
While flexible hours arrangements may be defined as employee-friendly working arrangements – if not necessarily healthy – since they offer workers the opportunity to choose and control their schedule, variable scheduling arrangements, such as on-call work and variable shift work are involuntary options, that are in nature unpredictable and disruptive from a work-life balance perspective.96 The incidence of variable scheduling arrangements slightly declined on average in the OECD from 19.2% in 2005 to 18.3% in 2015 (Figure 5.14). There were significant differences across countries, in part reflecting structural differences in sectoral and occupational composition: 9.8% of employees were engaged on average in variable scheduling in the Netherlands compared to 31.9% in the Slovak Republic in 2015 (see Annex Figure 5.A.9). Taken together Panels A and B of Figure 5.14 suggest that variable scheduling mostly concerns low-paid employees and those without higher education. In 2015, 21.9% of low-paid employees and 20.5% of those without higher education had variable scheduling, compared to 15.8% of highly paid employees and 14.8% of those with higher education. These proportions were stable between 2005 and 2015. The incidence of variable scheduling for men (19.7%) was also higher than for women (16.9%) on average in 2015, and this held between 2005 and 2015.
Figure 5.15 shows the incidence of teleworking across groups in the 28 OECD countries for which data are available in 2015. It reveals a clear divide between those who can telework and those who cannot. First, in the majority of countries, the share of men teleworking was higher than that of women − and in some cases much higher (e.g. in Austria, Luxembourg and Norway, see Panel A). Second, the incidence of teleworking increased both with educational attainments and earnings (Panel B and C): only 3.1% of employees without higher education on average were teleworking in 2015, compared to 15.6% for highly educated workers, while only 4.5% of low-paid workers were teleworking, against 16.3% for the high-paid.
In addition to socio-demographics characteristic, access to teleworking depends on other factors, including region of residence (those living in cities are more likely to be in teleworkable occupations compared to those living in rural areas), firm size (since medium and large firms concentrate more teleworkable occupations than small enterprises), occupations and work organisation (Fana, 2020[37]).
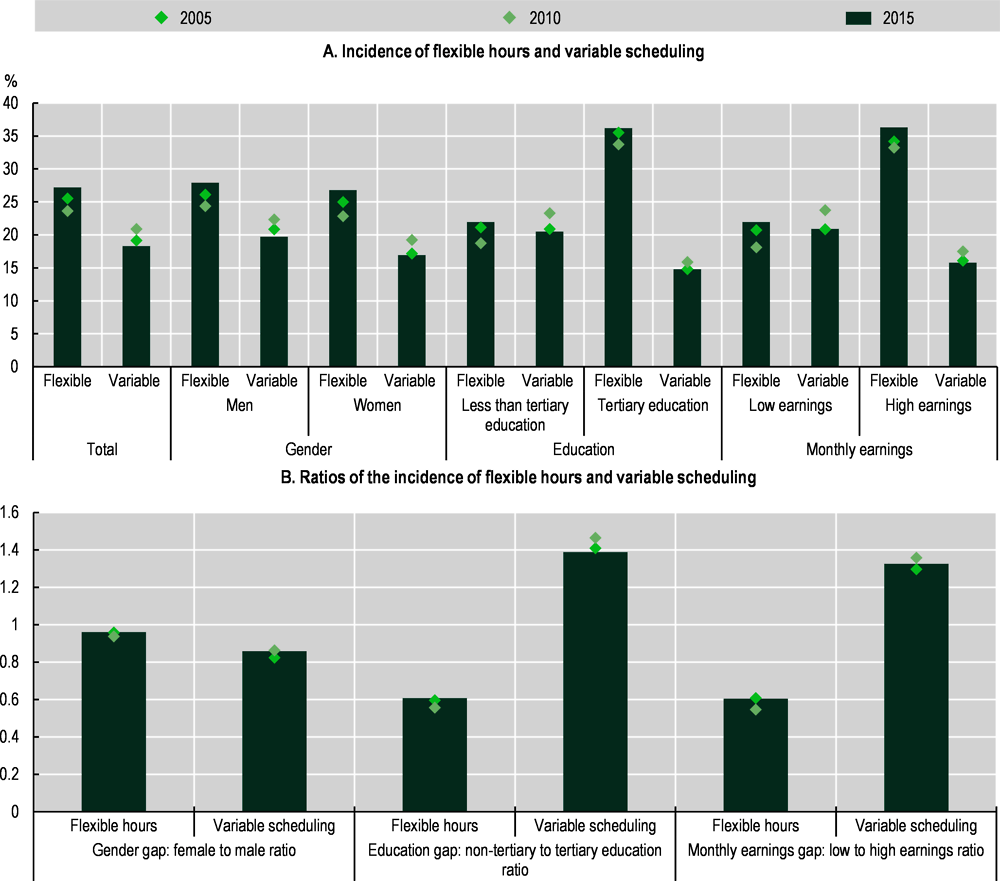
Note: Flexible working hours refer to the situation of employees who can either fully determine or at least adapt within certain limits their working hours (e.g. flexitime).
Variable hours scheduling refers to situation of employees for which working time arrangement is set by the employer or who have to choose between fixed several fixed hours schedules determined by the employer (e.g. shift work) and who are informed about changes in their work schedules at relatively short notice.
Statistics refer to the unweighted averages of 28 OECD countries: Austria, Belgium, the Czech Republic, Denmark, Estonia, Finland, France, Germany, Greece, Hungary, Ireland, Italy, Korea, Latvia, Lithuania, Luxembourg, the Netherlands, Norway, Poland, Portugal, the Slovak Republic, Slovenia, Spain, Sweden, Switzerland, Turkey, the United Kingdom and the United States. Averages in 2005 and 2010 are estimated by chaining the unweighted averages based on 26 countries (excluding Switzerland and the United States) in 2010-15, and the unweighted average based on 25 countries (excluding Korea, Switzerland and the United States) in 2005-10. Earnings categories refer to the 1st and last terciles of the distribution of the net monthly earnings from the main job. The gender gap refers to the ratio of the incidence of women over the incidence of men and the education and earnings gaps refer, respectively, to the ratio of non-tertiary education to tertiary education and to the ratio of low earnings to high earnings. See Annex Figures 5.A.8 and 5.A.9 for detailed results by country. 2010 and 2015 refer, respectively to 2011 and 2017 for Korea.
Source: OECD calculations based on the 4th, 5th and 6th European Working Conditions Survey (EWCS), the 1st, 3rd and 5th Korean Working Conditions Survey and the American Working Conditions Survey (AWCS) 2015.
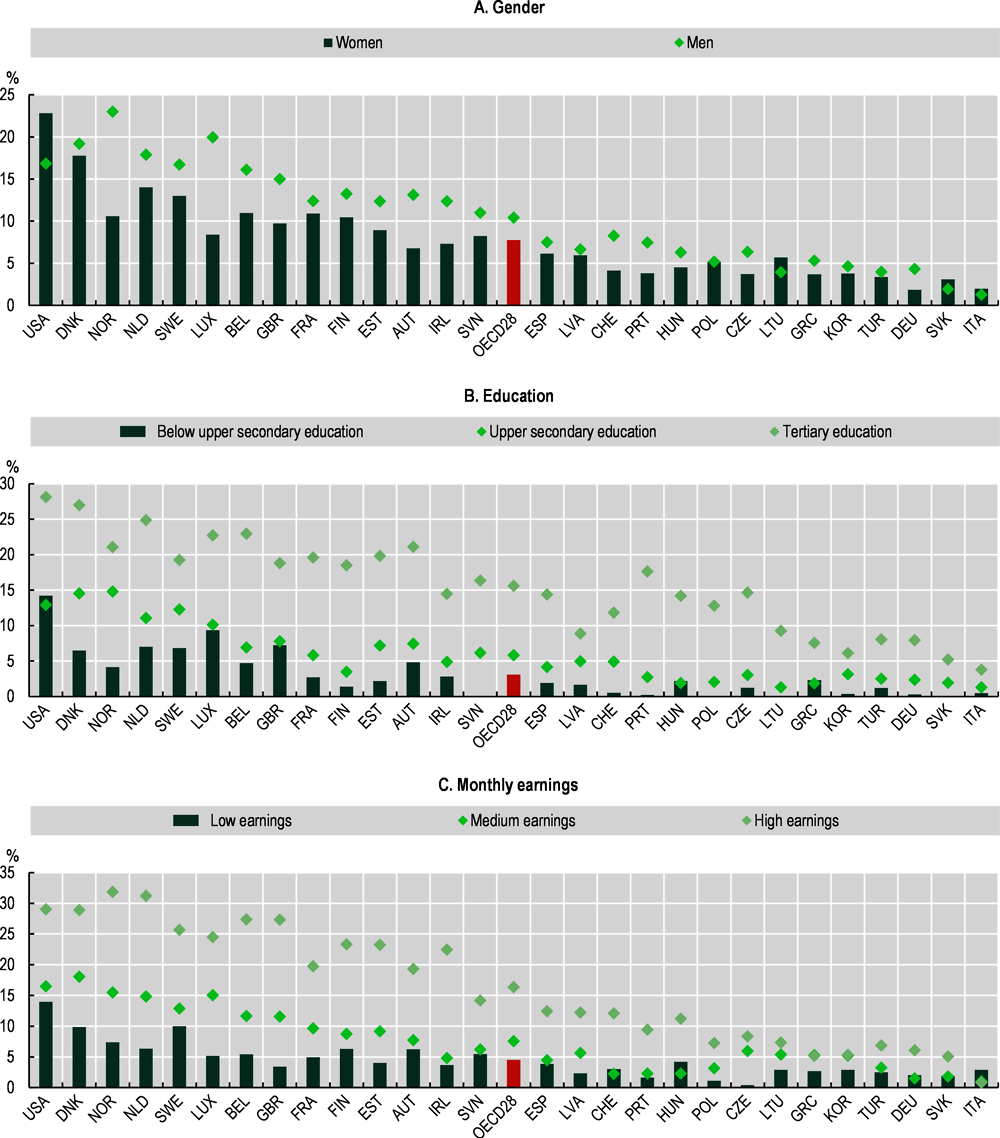
Note: Statistics shown in this Chart refer to all employees using ICT always or almost all of the time and working in at least one other location than the employer’s premises several times a month (either at home at least several times a month and in all other locations (except the employer’s premises) less often than several times a month, or at least several times a week in at least two locations other than the employer’s premises, or working daily in at least one other location). 2015 refers to 2017 for Korea. Countries are ordered by descending order of the overall incidence (Panel A). Monthly earnings (Panel C) categories refer to the terciles of the net monthly earnings in the main job. Results are comparable when using data from the EU-LFS for 2019 (see Box 5.4 for a discussion of the differences between sources on teleworking).
Source: OECD calculations based on the American Working Conditions Survey 2015, the European Working Conditions Survey 2015 and the Korean Working Conditions Survey 2017.
In light of the widespread development of teleworking during the COVID-19 crisis, how have inequalities between groups in access to teleworking, documented above, evolved? Drawing on survey data collected in April 2020 in Australia, Austria, France, Germany, Italy, Poland, Sweden, the United Kingdom and the United States (Galasso and Foucault, 2020[11]), Figure 5.16 below shows that, while comparable shares of men and women were able to work from home,1 the use of teleworking during the first lockdowns in the COVID-19 crisis was characterised by very stark education and income gradients. On average, across these countries, 55% of college educated workers were able to work from home in April 2020, against 19% of those with no high school diploma. By contrast, 38% of the latter had to stop working altogether, compared with 16% of college educated workers. A similar pattern is observed with earnings groups: about 29% of workers in the first quartile could work from home, 41% went to work as usual, and 30% had to stop working, compared to respectively 50%, 36% and 14% of those in the highest quartile.
The surge of teleworking witnessed during the crisis, as countries went into lockdowns, may only be partly transferable to teleworking during normal times. Indeed, although during lockdowns all tasks associated with a job had to be performed remotely, such a “full teleworking mode” might have amounted to a loss of quality in service for jobs that involve social tasks (e.g. selling, teaching, caring for others, working with the public). Therefore this extent of teleworking, even if doable, might not be seen as desirable in normal times. According to a 2020 study (Fana, 2020[37]), while 37% of jobs in the European Union can be done remotely, only 13% of those actually involve no or limited social tasks, and could be performed entirely remotely, without a loss of quality – see also OECD (2020[13]) and Galasso and Foucault (2020[11]). Besides, a full teleworking mode might have a negative impact on innovation, as activities sparking team creativity (e.g. brainstorming sessions) might benefit from a physical presence. Finally, workers suffering from social isolation, as well as those whose working conditions at home are degraded compared to being in the office (due to, e.g. lack of space, or the presence of other family members) might prefer a different balance between teleworking and working in the office in normal times, than that experienced during the COVID-19 crisis.
For all these reasons, a hybrid model of “blended working” including a substantively higher share of teleworking − albeit not in the proportion observed during the pandemic − is likely to emerge. In the United States, an estimated 17% of full work days on average are likely to become additional teleworking days in the post-pandemic world, compared with the pre-existing situation, totalling 22% of all full work days supplied from home (Barrero, Bloom and Davis, 2020[18]).
Nevertheless, even if teleworking does not become the norm, the experiment of the first lockdowns highlighted the fact that, in the absence of targeted measures to reduce gaps in the ability to telework among low-paid, low-skill jobs, the rise of teleworking in a post COVID-19 world could exacerbate disparities in working conditions between groups in the long-run. Targeted investments in technology and in training might be necessary – although some jobs will simply not be teleworkable. Further, changes in regulation designed to help overcome the cultural barriers to teleworking in low-skilled occupations might also be needed. Fana et al. (2020[37]) have shown that the highest gap between potential (i.e. technically possible) and actual teleworking was observed for lower-level white-collar occupations (and, in particular, workers in public administration). They argue that work organisation, position in the occupational hierarchy and associated levels of granted autonomy matter in explaining differences in access to teleworking.
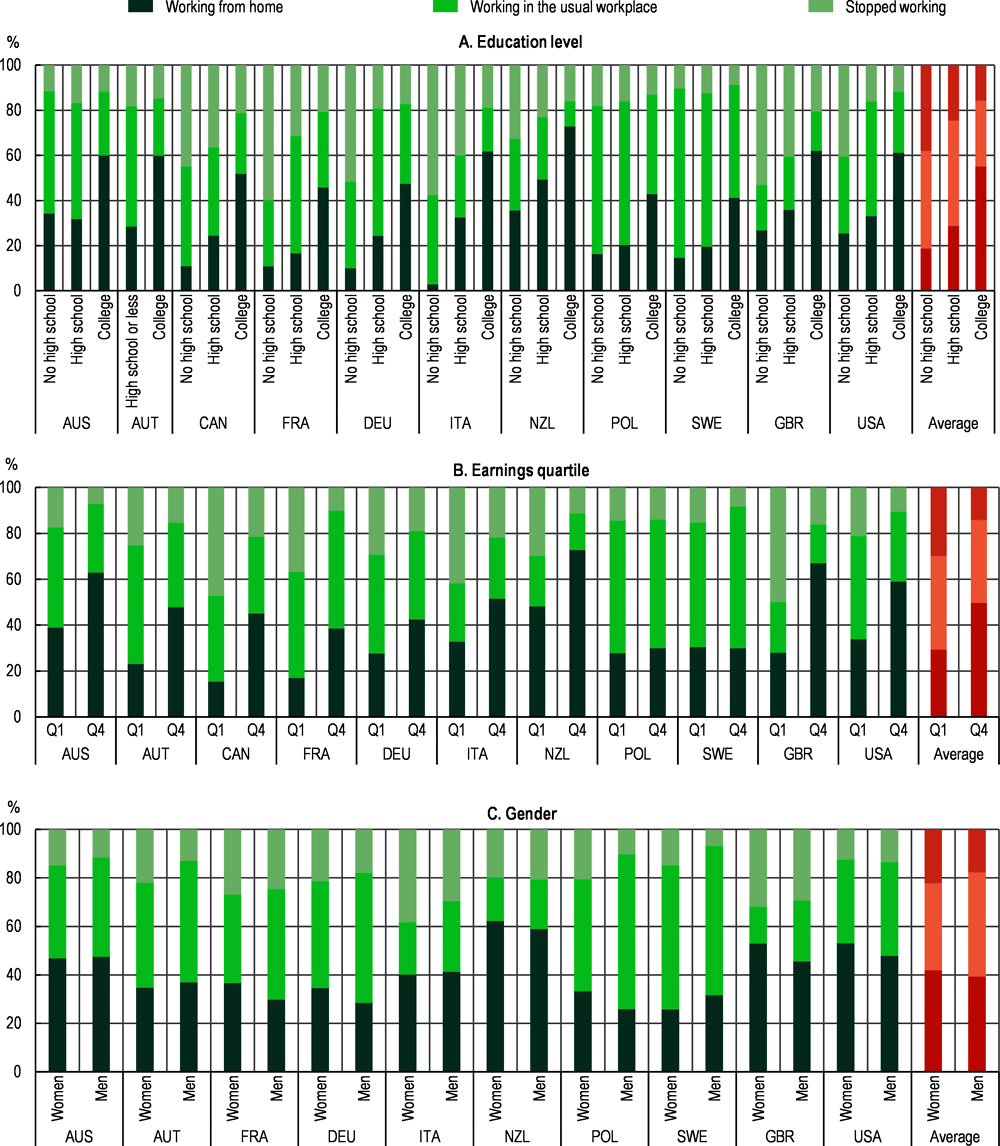
Note: “Average” is the unweighted average of the OECD countries shown.
Source: Foucault and Galasso (2020[11]), Working during COVID-19: Cross-country evidence from real-time survey data, (available at: https://dx.doi.org/10.1787/34a2c306-en) based on the REPEAT (REpresentations, PErcepions and ATtitudes on the COVID-19) survey.
← 1. However, more women than men had to stop working, and more men than women kept going to their usual places of work.
5.3.3. Work-leisure balance and time poverty across groups
Another key aspect in considering disparities related to working time across groups is work-leisure balance. Going beyond aggregate trends in time use shown in Section 5.2.2, Figure 5.17. displays trends in time spent on the main categories identified before (e.g. paid work, unpaid work, personal care and leisure) by gender, education level, and household income terciles, since the 2000s. Data reveal some stark contrasts in the time allocation across groups.
Throughout the last 20 years, in the ten OECD countries for which data are available, men consistently spent a larger portion of their day on work-related activities (e.g. paid work, studying, looking for a job) than women. In fact, this gap slightly increased from a 49 minutes per day difference on average in the 2000s, to a 50 minutes difference in the 2010s. Although the gap between the male and female labour market participation rates narrowed from 21.6% on average across the OECD in 2000, to 15.6% in 2019,97 women consistently spent more time that men on unpaid work throughout the period, with the gap in time spent on unpaid work slightly increasing, from 84 minutes per day on average in the 2000s, to 85 minutes in the 2010s. Furthermore, in countries reviewed, women consistently spent less time in leisure than men over the past two decades (36 minutes less on average in both decades). Overall, women and men had comparable paid work-leisure balance (as measured by the ratio between the share of time spent on paid work and the share of time spent on leisure), but women had a more negative overall work-leisure balance (defined as the ratio between the share of paid and unpaid work to the share of leisure) than men; in the 2010s women still spent 2.4 times more time on work (paid and unpaid) than on leisure, while men spent 1.9 times more on work (paid and unpaid) than on leisure.
Turning to patterns by levels of education, on average across countries, workers with upper-secondary education spent the most time in paid work and those with tertiary education the least, in both decades. In the 2010s, all workers, irrespective of their level of education, spent about 1.5 times as much time on paid work as they did on leisure. All workers also had comparable overall work-leisure balance, spending about 2.1 more time on work (paid and unpaid) than on leisure.
Finally, when considering patterns of time use across household income groups98 Figure 5.17 shows that on average, time spent on paid work tend to decrease with income, while time spent on leisure tend to increase with income.
While looking at the relative shares of time devoted to each activity is important to capture possible imbalances between work (paid and unpaid) and other personal activities, people’s work-life balance should also be measured in absolute term. Indeed, below a certain threshold, the share of time available for leisure and personal care – in particular, regenerative activities like sleeping and eating – becomes fundamentally detrimental. This idea underlines the concept of “time poverty”. Following the literature – see e.g. (Bardasi and Wodon, 2010[38]), individuals are defined as time poor when the time they have left for non-working activities is lower than 60% of the median share of time for leisure and personal care. Figure 5.18 considers trends in the incidence of time poverty.
The incidence of time poverty increased over time on average across the ten countries for which data are available, going from 1.4% of men in the 2000s to 1.8% in the 2010s, and from 1.3% to 1.8% of women for the same period. While the incidence of time poverty was highest for highly educated individuals in the 2000s, it rose most strongly for workers with the lowest level of education in the last decade. Finally, Figure 5.18 considers the incidence of time poverty in different income groups in the 2000s and 2010s in the 10 countries where this is doable; in the 2010s, time poverty was highest (at 1.8%, up from 1.5% in the 2000s) for workers in the medium income group, followed by those in the poorest group (at 1.76%, up from 1.45 in the 2000s), while the incidence of time poverty was lowest (at 1.7%, up from 1.4% in the 2000s) for the most highly paid third of workers.
Taken together, Panel C in both Figure 5.17 and Figure 5.18 shed light on disparities in the value of one working hour across individuals. While these disparities are often conceived as disparities in hourly wages, they may also be envisaged in terms of the quantity of work necessary to attain a given level of income for different individuals (e.g. the size of the work “effort”). Understanding these disparities in work effort at a given level of income is crucial to assess the implications of changes in hours distribution across groups. Figure 5.19 looks at the number of hours of work needed to escape poverty − defined as 50% of median equivalised disposable income − for an individual paid at respectively the minimum and the average wage in 2001 and 2019. On average in 2019, a single childless worker had to work 33 hours at the minimum wage to escape poverty compared with 13 hours at the average wage. While the number of hours needed at the average wage remained relatively constant between 2001 and 2019, a single childless worker paid the minimum wage needed to work 6 hours less in 2019 than in 2001. However, in the Czech Republic, Latvia, Luxembourg and the United States, a single childless worker paid at the minimum wage still had to work more than 40 hours per week (i.e. more than the upper limit on normal weekly hours in most OECD countries) to escape poverty in 2019. In the United States in 2019, a single individual taking up a job paid at the federal minimum wage would have had to work 60 hours a week to escape poverty (up from 54 hours in 2001, and compared to 16 hours at the average wage).99
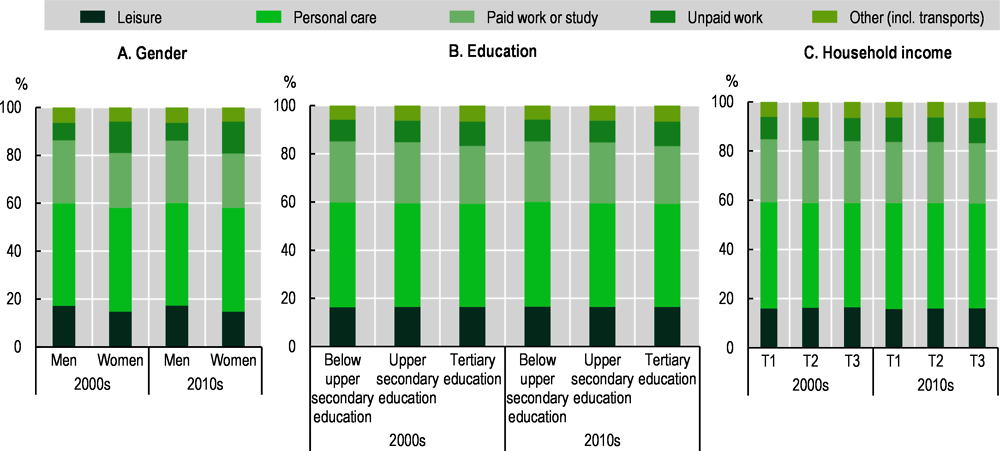
Note: For further details on the definition of activities and data limitation, see the note of Figure 5.11. Statistics shown in Panels A and B are the unweighted averages of the ten following OECD countries: Canada, Germany, Hungary, Italy, Mexico, the Netherlands, Spain, Turkey, the United Kingdom and the United States. Statistics in Panel C are the unweighted averages of the eight following OECD countries: Canada, Germany, Mexico, the Netherlands, Spain, Turkey, the United Kingdom and the United States. Categories of household income refer to the terciles of household income by unit of consumption (T1 for the first tercile to T3 for the last tercile).
Source: OECD estimates based on the Multinational Time Use Study (MTUS) and national Time Use Surveys.
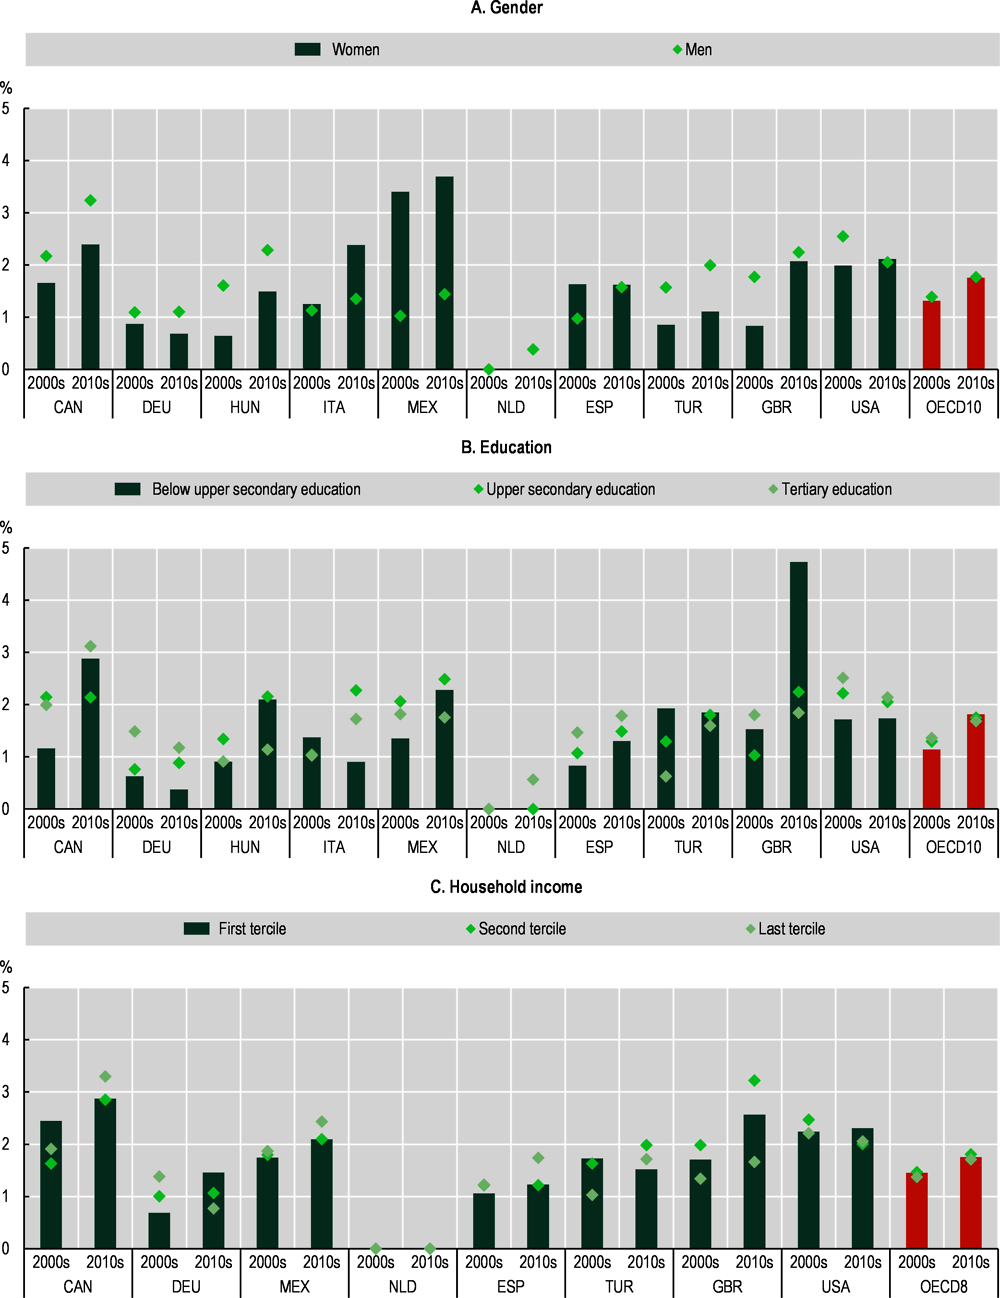
Note: Time poverty is defined as the share of full-time employees aged 15-64 whose share of time devoted to personal care and leisure is less than 60% of the time devoted to these activities by the median full-time worker aged 25-64. OECD10 (Panels A and B) and OECD8 (Panel C) are the unweighted averages of the OECD countries: shown in the chart. Categories of household income refer to the terciles of household income by unit of consumption (T1 for the first tercile to T3 for the last tercile). Results for the Netherlands in Panel C refer to the only year for which data by household income are available in the 2010s (2016); in this year time poverty is always equal to 0 and consequently statistics shown in Panels C are not consistent with those in Panels A and B in the 2010s (based on the years 2011 and 2016). Statistics for women, for workers with below upper secondary education, and for those in the first and second income terciles are not visible on the graph because they are equal to 0.
Source: OECD estimates based on the Multinational Time Use Study (MTUS) and national Time Use Surveys.
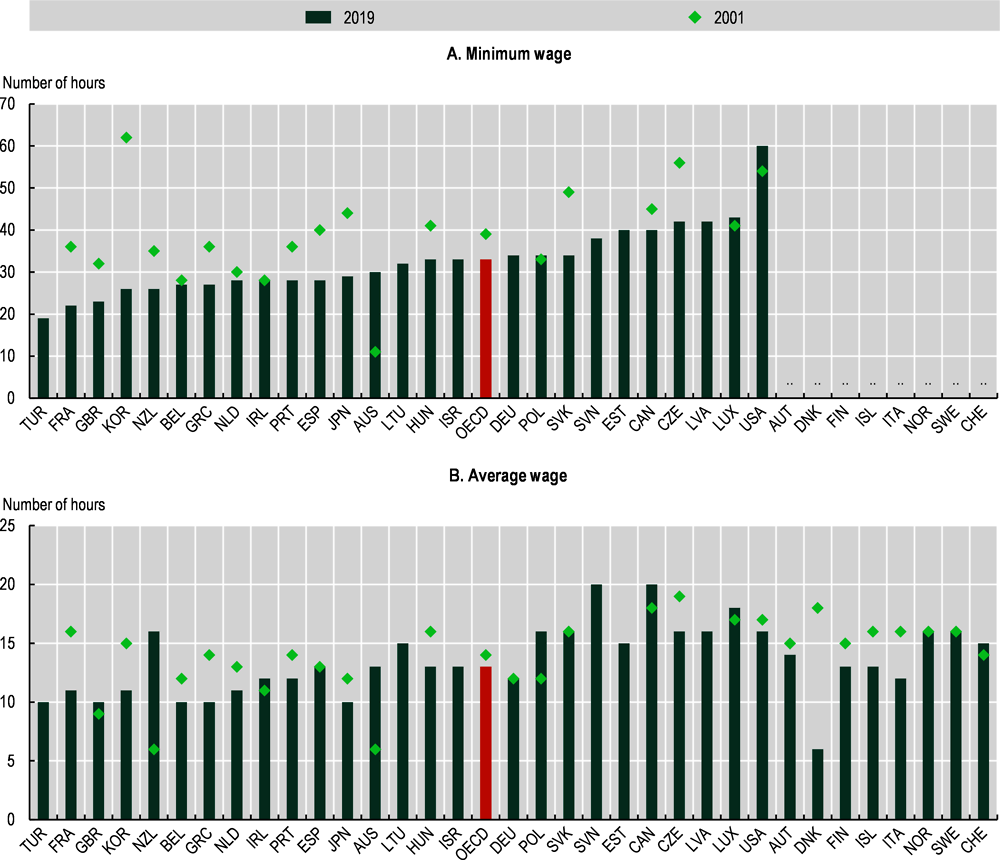
Note: Figures are based on taxes and benefits simulations, for a single person without children earning either the minimum wage or the average wage. The effect of tax systems is taken into account. Temporary in-work benefits and housing benefits are not included (since the former are temporary, and the take-up of housing benefits is low among low-income households). Countries are ordered by ascending order of the hours of work needed at the minimum wage in 2019 (Panel A).”..”: not applicable.
Source: OECD Employment Database, http://www.oecd.org/employment/emp/onlineoecdemploymentdatabase.htm, based on the TAXBEN model.
5.3.4. Mismatches between reality and preferences across groups
Finally, another important aspect of working time to consider is the extent of the mismatch between individual working time preferences and the time that they actually spend working. As shown in Figure 5.20, in 2015, 27% of employees aged 15-64 on average wished to work less than they did, while 16% wished to work more. The amount of mismatch, i.e. the share of employees dissatisfied with their working hours in one way or another, was relatively stable from 2010, at 43% of employees. On average, the proportion of workers wanting to work less was higher than the proportion of those wanting to work more, in all sub-groups represented on Figure 5.20, except for low-paid workers and those with less than secondary education, for whom the reverse was true. 36% of highly paid workers, 31% of workers in the medium earnings group, and 32% of highly educated workers said they would wish to work less hours than they did in 2015. By contrast, 28% of low-paid workers and 24% of low-educated workers said they would like to work more. The total amount of mismatch was highest for low-paid workers, 47% of whom were dissatisfied with their hours, with 28% wanting to work more and 18% wanting to work less. 26% of women wanted to work less (compared to 28% of men), and 17% wanted to work more (compared to 14% of men).
Several key insights can be drawn from these data. The first one relates to the impressive size of the mismatch: more than two fifth of workers across OECD countries for which data are available, 43%, are dissatisfied with the amount of time that they spend working. Second, working too much appears to be the dominant cause of dissatisfaction: more than a fourth of workers (28%) feel that they work more than they would like.
The third insight from Figure 5.20 reinforces the point outlined in Section 5.1.1 on overtime: in the same way that the supply of overtime is partly determined by the wage distribution, preferences regarding hours are clearly linked to one’s position in the wage distribution, and cannot be abstracted from the issue of wage levels. Indeed, low paid and low educated workers, who are more likely to face difficulties in making ends meet, are the only two groups with a larger proportion of workers wanting to work more hours to increase their income than the proportion of those wanting less hours.
The proportion of women wanting to work more is also comparatively higher than that of men who express that wish. Indeed, women are largely over-represented in the group of involuntary part-timers (made of 65% of women in 2019), a group which has itself grown from 12% of total employment in 2000 to 15% in 2019.100 Again, these statistics have to be considered in relation to the gender wage gap faced by women, whose hourly wage is on average lower than that of men101 (and who also face a gender time gap, i.e. a lower availability to work since they are bearing a higher share of the household work burden) (OECD, 2020[39]).
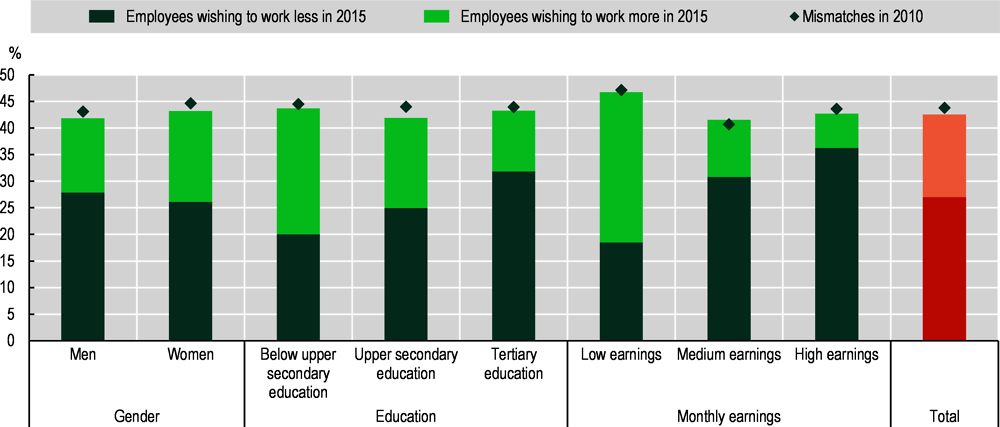
Note: Unweighted average of 28 OECD countries: Austria, Belgium, the Czech Republic, Denmark, Estonia, Finland, France, Germany, Greece, Hungary, Ireland, Italy, Korea, Latvia, Lithuania, Luxembourg, the Netherlands, Norway, Poland, Portugal, the Slovak Republic, Slovenia, Spain, Sweden, Switzerland, Turkey, the United Kingdom and the United States. Monthly earnings categories refer to the terciles of the net monthly earnings in main job. 2010 and 2015 refer, respectively to 2011 and 2017 for Korea.
Source: OECD calculations based on the 4th, 5th and 6th European Working Conditions Survey (EWCS), the 1st, 3rd and 5th Korean Working Conditions Survey (KWCS) and the American Working Conditions Survey (AWCS) 2015.
The important level of mismatch observed in the data, and in particular, the dissatisfaction with working too much expressed by a sizable share of workers might have started to be heeded in recent years. Indeed, a few interesting developments in collective bargaining practices, as well as the multiplication of experiments in working time reduction at the firm level, are testament to the fact that a renewed attention is being paid to this issue.
In recent years, collective bargaining in several countries has increasingly taken into account workers’ preference for a reduction of working hours in several countries. In Austria, in the last few years, employees have been able to choose the “Freizeitoption”, literally, the “leisure option”, which gives them the opportunity to agree on additional free time instead of a wage increase. The option was used primarily in the collective agreements of the metal, metal trade, electrical and electronics, mineral oil and electricity industries. Similar developments have been observed in Germany, where collective agreements signed in 2018 in several sectors (the metal sector, but also public transport, and the public postal service) reflected a shift towards greater individual choice between working time reduction (e.g. from 35 hours to 28 hours per week in the metal sector) and wage increases. In these agreements, priority was clearly given to individuals’ preferences over working time. The change in bargaining practice in the German metal industry followed a large-scale survey of about 700 000 employees which made evident the fact that many employees were dissatisfied with their hours of work (OECD, 2019[1]).
Employees’ preferences for more time-off, as well as the desire to improve employees’ work-life balance and firm productivity are also the main drivers behind several experiments in working time reduction conducted in private sector firms in recent years. In August 2019, Microsoft Japan trialled a four-days week for a month – and reported an increase in productivity compared with August 2018. In December 2020, Unilever New Zealand announced that it was launching a one-year long trial of a four-day week. Employees will be paid a 100% of their salaries, while working one day less per week (without increasing the number of hours per day: in other words this is a true reduction of working time, rather than a “compressed week” system – see Box 5.1). This experiment was inspired by that of another New Zealand firm, which permanently moved its 250 employees to a four-day week system in 2018, after a two-month trial revealed productivity gains and increases in well-being and job retention (Ainge Roy, 2018[40]).1 In recent months, examples have been piling up in various sectors, from fast-food chains (Zetlin, 2019[41]) to digital marketing agency (Ribeiro, 2019[42]). Job postings data from July 2020, from American firm ZipRecruiter, show that in the United States, the percentage of firms offering 4-day workweeks to their employees has increased by more than 70% since 2018 (Cheng, 2020[43]).
Beyond cutting the number of days worked, other experiments have focused on reducing the number of hours worked each day. A German consultancy firm made headlines in 2017 by trialling – and later adopting – a system of 5 hours workday, paid 8 (Morath, 2019[44]). Several Swedish towns, following the example of the city of Gothenburg, also trialled reduced hours workday for municipal employees particularly at risk of burnout, like social and health workers (Alderman, 2016[45]).
While this renewed interest in reduced working time, aligned with workers’ preferences expressed in surveys, has been so far contained to ad hoc collective agreements and private sector trials, in the context of the COVID-19 crisis the idea has been increasingly discussed in the media and in policy circles in several OECD countries, including Finland, New Zealand and Spain.
← 1. Note that results on productivity might be clouded by selection effects: firms which offer these working conditions are likely to be among the most productive to start with.
This chapter documents the diversity and complexity of national regulatory settings governing working hours, paid leave and teleworking in OECD countries, looking at both the governance and at the content of statutory and negotiated rules. The analysis confirms the importance of conducting such a comprehensive exercise to properly assess the relationship between working time regulation and working time outcomes. It identifies important differences between countries, both in terms of the nature and content of their regulatory settings, but also in terms of how much regulations actually affect working time outcomes in practice. These results are important for correctly informing policy makers on the link between working time regulatory changes and labour market outcomes, and suggest that both the governance and content of regulations should be taken into account when assessing the impact of working time reforms.
The chapter also provides an update on working time trends across OECD countries. It shows that usual weekly hours, and the incidence of paid overtime have remained relatively stable over recent decades. Actual hours of work have declined, but at a diminishing pace. In parallel, time spent on leisure has actually decreased. Taken together (for the OECD countries where data are available), parallel trends in average annual hours worked, average time spent on leisure, and hourly productivity suggest that productivity increases have not led to extra leisure time. One possible explanation for this is that workers faced with a decreasing labour share have opted for increases in hourly wages rather than reduction in hours worked. Further research should be undertaken at the country level to investigate the factors behind these developments and consider possible policy actions to ensure a better balance between work and leisure and address the mismatch between individuals’ working time preferences and the time they actually spend working.
In addition, the chapter sheds light on significant differences between socio-demographic groups in the distribution of hours worked, working time arrangements and work-leisure balance. Further analyses will be necessary to understand the factors driving these differences at the country level, as well as to explore more precisely how they have evolved over time, to prevent growing divides in work-life balance, working conditions and time poverty. Moreover, as many regulatory changes were introduced during the COVID-19 crisis, it will also be key to explore how the various possibilities to work longer hours, adjust paid leave and expand teleworking have impacted working time outcomes across countries and for different groups.
Looking ahead, a second key object of research will be to explore how working time outcomes relate to labour market outcomes and workers’ well-being in order to help policy makers to balance productivity, employment and welfare objectives when designing working time reforms. Moreover, since the various components of working time regulatory settings are likely to interact, a specific change in working time rules may affect several working time outcomes (e.g. a reform in working hours may lead to changes in the organisation of working time). Future research should thus look in detail at possible complementarities or trade-offs between the various components of working time regulatory settings.
Finally, while working hours and work organisation are influenced by differences in the content and governance of regulation, they are also likely to be affected by other factors, including labour force participation, changes in taxation and social protection, phases of the business cycle, and cultural trends. The use of teleworking, beyond the impact of the health crisis, will typically be shaped by attitudinal changes, and the development of IT infrastructure. Further detailed research is therefore needed on the interactions between working time regulatory settings with other key labour market institutions such as tax and social security systems.
References
[40] Ainge Roy, E. (2018), ’No downside’: New Zealand firm adopts four-day week after successful trial | New Zealand | The Guardian, https://www.theguardian.com/world/2018/oct/02/no-downside-new-zealand-firm-adopts-four-day-week-after-successful-trial (accessed on 9 February 2021).
[45] Alderman, L. (2016), “In Sweden, an Experiment Turns Shorter Workdays Into Bigger Gains - The New York Times”, The New York Times, https://www.nytimes.com/2016/05/21/business/international/in-sweden-an-experiment-turns-shorter-workdays-into-bigger-gains.html (accessed on 9 February 2021).
[6] Anxo, D. and M. Karlsson (2019), “Overtime work a review of literature and initial empirical analysis”, ILO Working Papers, https://ideas.repec.org/p/ilo/ilowps/995012793502676.html (accessed on 9 February 2021).
[25] Autor, D. et al. (2017), The fall of the labor share and the rise of superstar firms, NBER, http://www.nber.org/papers/w23396 (accessed on 23 February 2021).
[21] Bangham, G. (2020), The times they aren’t a-changin’, Resolution Foundation, https://www.resolutionfoundation.org/publications/the-times-they-arent-a-changin/.
[38] Bardasi, E. and Q. Wodon (2010), “Working Long Hours and Having No Choice: Time Poverty in Guinea”, Feminist Economics, Vol. 16, pp. 45-78, https://doi.org/10.1080/13545701.2010.508574.
[26] Barkai, S. (2020), “Declining Labor and Capital Shares”, The Journal of Finance, Vol. 75/5, pp. 2421-2463, https://doi.org/10.1111/jofi.12909.
[50] Barnard, C., S. Deakin and R. Hobbs (2003), “Opting out of the 48 hours week - employer necessity or individual choice? An empirical study of the operation of article 18(1)(b) of the Working Time Directive in the UK”, Industrial Law Journal, Vol. 32/4, pp. 223-252, https://doi.org/10.1093/ilj/32.4.223.
[18] Barrero, J., N. Bloom and S. Davis (2020), “Why Working From Home Will Stick”, SSRN Electronic Journal, https://doi.org/10.2139/ssrn.3741644.
[27] Bell, B., P. Bukowski and S. Machin (2060), Rent Sharing and Inclusive Growth, http://www.iza.org (accessed on 23 February 2021).
[28] Bental, B. and D. Demougin (2010), “Declining labor shares and bargaining power: An institutional explanation”, Journal of Macroeconomics, Vol. 32/1, pp. 443-456, https://doi.org/10.1016/j.jmacro.2009.09.005.
[9] Blumenfeld, S., S. Ryall and P. Kiely (2015), Employment Agreements: Bargaining Trends & Employment Law Update 2014/2015, Center for Labour, Employment and Work, https://www.wheelers.co.nz/books/619937-employment-agreements-bargaining-trends-employment-law-update-2014-2015/ (accessed on 9 February 2021).
[46] Brunetto, A. et al. (2019), Lifetime worked hours in France, Trésor-Economics n° 239, https://www.tresor.economie.gouv.fr/Articles/27af192c-d4ae-41cd-a34a-fc7e770f0696/files/7be842de-7043-491c-becf-9630d9528261 (accessed on 9 March 2021).
[10] Bureau of Labour Statistics, US Department of Labor (2019), “A look at consolidated leave plans in 2018”, The Economics daily, https://www.bls.gov/opub/ted/2019/a-look-at-consolidated-leave-plans-in-2018.htm.
[8] Cabrita, J. and N. Brandsma (2019), Working time in 2017–2018, Eurofound, https://www.eurofound.europa.eu/publications/report/2019/working-time-in-2017-2018 (accessed on 9 February 2021).
[7] Cahuc, P. and S. Carcillo (2014), “The Detaxation of Overtime Hours: Lessons from the French Experiment”, Journal of Labor Economics, Vol. 32/2, pp. 361-400, https://doi.org/10.1086/674987.
[31] Cazes, S., A. Hijzen and A. Saint-Martin (2015), “Measuring and Assessing Job Quality: The OECD Job Quality Framework”, OECD Social, Employment and Migration Working Papers, No. 174, OECD Publishing, Paris, https://dx.doi.org/10.1787/5jrp02kjw1mr-en.
[43] Cheng, M. (2020), The four-day work week is catching on amid coronavirus, https://qz.com/1877960/the-four-day-work-week-is-catching-on-amid-coronavirus/ (accessed on 9 February 2021).
[29] Ciminelli, G., R. Duval and D. Furceri (2018), Employment Protection Deregulation and Labor Shares in Advanced Economies, IMF, Washington, https://www.imf.org/en/Publications/WP/Issues/2018/08/16/Employment-Protection-Deregulation-and-Labor-Shares-in-Advanced-Economies-46074 (accessed on 23 February 2021).
[30] De Loecker, J. and J. Eeckhout (2017), The Rise of Market Power and the Macroeconomic Implications, National Bureau of Economic Research, Cambridge, MA, https://doi.org/10.3386/w23687.
[47] Drahokoupil, J. and A. Piasna (2019), Work in the platform economy: Deliveroo riders in Belgium and the SMart arrangement, ETUI, https://www.etui.org/fr/publications/working-papers/work-in-the-platform-economy-deliveroo-riders-in-belgium-and-the-smart-arrangement (accessed on 4 February 2021).
[52] EU-OSHA (2029), ESENER 2019: What does it tell us about safety and health in Europe’s workplaces?, EU-OSHA, https://doi.org/10.2802/489857.
[32] Eurofound (2018), Living and working in Europe, Eurofound.
[36] Eurofound (2016), Working time developments in the 21st century: Work duration and its regulation in the EU, Eurofound, https://doi.org/10.2806/888566.
[20] Evans, J., D. Lippoldt and P. Marianna (2001), “Trends in Working Hours in OECD Countries”, OECD Labour Market and Social Policy Occasional Papers, No. 45, OECD Publishing, Paris, https://dx.doi.org/10.1787/674061356827.
[37] Fana, M. (2020), The COVID confinement measures and EU labour markets, Publications Office of the European Union, https://doi.org/10.2760/079230, JRC120578.
[4] Fleck, S. (2009), Cross-Country Comparisons of Hours Worked – An Assessment of the Statistics., U.S. Department of Labor, Bureau of Labor Statistics, https://www.bls.gov/opub/mlr/2009/05/art1full.pdf.
[11] Galasso, V. and M. Foucault (2020), “Working during COVID-19: Cross-country evidence from real-time survey data”, OECD Social, Employment and Migration Working Papers, No. 246, OECD Publishing, Paris, https://dx.doi.org/10.1787/34a2c306-en.
[48] Golden, L. (2016), Still faling short on hours and pay - Part-time work becoming new normal, Economic Policy Institute, https://www.epi.org/publication/still-falling-short-on-hours-and-pay-part-time-work-becoming-new-normal/.
[5] Green, A. (2017), Hours Off the Clock, Center for Economic Studies, US Census Bureau, https://ideas.repec.org/p/cen/wpaper/17-44.html (accessed on 31 May 2021).
[23] Huberman, M. and C. Minns (2007), “The times they are not changin’: Days and hours of work in Old and New Worlds, 1870–2000”, Explorations in Economic History, Vol. 44/4, pp. 538-567, https://doi.org/10.1016/j.eeh.2007.03.002.
[3] International Labour Organisation (1962), Resolution concerning statistics of hours of work, https://www.ilo.org/public/english/bureau/stat/download/res/hours.pdf.
[24] Keynes, J. (1930), “Economic possibilities for our grandchildren”, in The Collected Writings of John Maynard Keynes, Cambridge University Press, https://doi.org/10.1017/upo9781139524162.031.
[19] Maddison, A. (1995), Monitoring the World Economy: 1820-1992, OECD Publishing, Paris.
[17] Mann, S. and L. Holdsworth (2003), “The psychological impact of teleworking: stress, emotions and health”, New Technology, Work and Employment, Vol. 18/3, pp. 196-211, https://doi.org/10.1111/1468-005X.00121.
[44] Morath, E. (2019), “The 5-Hour Workday Gets Put to the Test - WSJ”, The Wall Street Journal, https://www.wsj.com/articles/the-5-hour-workday-gets-put-to-the-test-11571876563 (accessed on 9 February 2021).
[14] OECD (2021), OECD Skills Outlook: Learning for Life, OECD Publishing, Paris, https://doi.org/10.1787/0ae365b4-en.
[39] OECD (2020), “Can collective bargaining help close the gender wage gap for women in non-standard jobs?”, OECD, Paris, https://www.oecd.org/gender/collective-bargaining-and-gender-wage-gap-2020.pdf.
[15] OECD (2020), “Capacity for remote working can affect lockdown costs differently across places”, OECD Policy Responses to Coronavirus (COVID-19), OECD Publishing, Paris, https://doi.org/10.1787/0e85740e-en.
[13] OECD (2020), “COVID-19: From a health to a jobs crisis”, in OECD Employment Outlook 2020: Worker Security and the COVID-19 Crisis, OECD Publishing, Paris, https://dx.doi.org/10.1787/cea3b4f4-en.
[16] OECD (2020), “Exploring policy options on teleworking: Steering local economic and employment development in the time of remote work”, OECD Local Economic and Employment Development (LEED) Papers, No. 2020/10, OECD Publishing, Paris, https://dx.doi.org/10.1787/5738b561-en.
[12] OECD (2020), OECD Regions and Cities at a Glance 2020, OECD Publishing, Paris, https://dx.doi.org/10.1787/959d5ba0-en.
[1] OECD (2019), Negotiating Our Way Up: Collective Bargaining in a Changing World of Work, OECD Publishing, Paris, https://dx.doi.org/10.1787/1fd2da34-en.
[34] OECD (2016), “Be Flexible! Background brief on how workplace flexibility can help European employees to balance work and family”, OECD, Paris, https://www.oecd.org/els/family/Be-Flexible-Backgrounder-Workplace-Flexibility.pdf.
[51] OECD (2016), “OECD Family Database: LMF2.5: Time use for work, care and other day-to-day activities”, OECD, Paris, https://www.oecd.org/els/family/LMF2_5_Time_use_of_work_and_care.pdf.
[33] OECD (2010), OECD Employment Outlook 2010: Moving beyond the Jobs Crisis, OECD Publishing, Paris, https://dx.doi.org/10.1787/empl_outlook-2010-en.
[2] Pega, F. et al. (2021), “Global, regional, and national burdens of ischemic heart disease and stroke attributable to exposure to long working hours for 194 countries, 2000–2016: A systematic analysis from the WHO/ILO Joint Estimates of the Work-related Burden of Disease and Injury”, Environment International, https://doi.org/10.1016/j.envint.2021.106595.
[22] Ramey, V. and N. Francis (2009), “A Century of Work and Leisure”, American Economic Journal: Macroeconomics, Vol. 1/2, pp. 189-224, https://doi.org/10.1257/mac.1.2.189.
[42] Ribeiro, C. (2019), “The Australian company that banned work on Wednesdays - BBC Worklife”, BBC, https://www.bbc.com/worklife/article/20190429-the-australian-company-that-banned-work-on-wednesdays (accessed on 9 February 2021).
[35] Rubery, J., C. Fagan and M. Smith (1995), Changing patterns of work and working time in the European Union and the impact on gender divisions, European Commission.
[49] Vargas Llave, O. and T. Weber (2020), Regulations to address work–life balance in digital flexible working arrangements, Eurofound, https://www.eurofound.europa.eu/publications/report/2020/regulations-to-address-work-life-balance-in-digital-flexible-working-arrangements (accessed on 27 April 2021).
[41] Zetlin, M. (2019), “Shake Shack Is Trying a 4 Day Work Week, According to CEO Randy Garutti | Inc.com”, Inc., https://www.inc.com/minda-zetlin/shake-shack-4-day-work-week-ceo-randy-garutti-general-managers.html (accessed on 9 February 2021).
Annex Table 5.A.6. The governance of normal weekly hours across OECD countries in 2020 | |||||||||
|---|---|---|---|---|---|---|---|---|---|
Most uniform regulation |
Normal weekly hours regulation | More possibility for local variations | |||||||
Binding upper limit on normal weekly hours (statutory or collectively agreed at central level) | Possibility to exceed the limit on normal weekly hours (by collective agreement / in individual contracts) | No limit on normal weekly hours | |||||||
Binding upper limit on maximum weekly hours | Possibility to exceed the limit on maximum weekly hours | No limit on maximum working hours | Binding upper limit on maximum weekly hours | Possibility to exceed the limit on maximum weekly hours | Binding upper limit on maximum weekly hours | Possibility to exceed the limit on maximum weekly hours | No limit on maximum working hours | ||
Averaging regulations for normal hours | Averaging of the normal hours limit is not possible | Chile Israel Latvia Mexico Slovak Republic | Estonia | Slovenia United States | |||||
Averaging of the normal hours limit requires a collective agreement | Belgium Greece Japan | Portugal | Sweden | ||||||
Averaging of the normal hours limit requires employee’s consent | Finland | Australia | Austria Colombia New Zealand Norway Spain | ||||||
Averaging of the normal hours limit can be decided by employers | Korea Poland Turkey | Canada Czech Republic France Hungary Italy Lithuania | |||||||
More possibility for local variations | No upper limit on normal hours | Netherlands Switzerland | Denmark Germany | United Kingdom | |||||
Note: in dark green: countries where the limit on normal weekly hours (e.g. without overtime) corresponds most frequently to the statutory default; in light green: countries where the limit on normal weekly hours is most frequently determined at the national or sectoral level; in dark red: countries where the limit on normal weekly hours is most frequently determined at the firm level; in light red: countries where the limit on normal weekly hours is most frequently determined in individual contracts. | |||||||||
From this table, the following country groups are derived (these are used to construct Table 5.1) | |||||||||
Uniformly regulated countries: normal weekly hours are subjected to a binding upper limit (statutory default or collectively negotiated at the national or sectoral level), with no possibility to derogate from it or to use averaging mechanisms: Chile, Estonia, Israel, Latvia, Mexico, and the Slovak Republic. | |||||||||
Mostly uniformly regulated countries: normal weekly hours are subjected to a binding upper limit (statutory default or collectively negotiated at the national or sectoral level), with no possibility to derogate from it, but a limited possibility to use averaging through collective agreement (Belgium, Greece, Japan and Portugal), or with the employee’s consent (Australia and Finland). | |||||||||
Mixed regulation countries, where normal weekly hours are subjected to either. | |||||||||
1) a binding upper limit (statutory default or collectively negotiated at the national or sectoral level) with no possibility to derogate from it, but a possibility for employers to use averaging via a unilateral decision: Canada, Czech Republic, France, Hungary, Korea, Lithuania, Poland, Turkey and Italy (where the upper limit is negotiated rather than statutory); | |||||||||
or 2) an upper limit (statutory default or collectively negotiated at the national or sectoral level) that can be exceeded through derogations at lower levels of bargaining (with no possibility to use averaging): Slovenia and the United States. | |||||||||
Mostly heterogeneously regulated countries: normal weekly hours are subjected to an upper limit (statutory default or collectively negotiated at the national or sectoral level) that can be exceeded through derogations at lower levels of bargaining, and where there is a limited possibility to use averaging, with the employee’s consent or through a collective agreement: Austria, Colombia, New Zealand, Norway, Spain and Sweden. | |||||||||
Heterogeneously regulated countries: rules on normal weekly hours are most frequently set in sectoral (Denmark, the Netherlands) or firm-level agreements (Germany, Switzerland), and there are no statutory or centrally bargained limit. | |||||||||
Unregulated countries: normal weekly hours are usually left to be determined in individual contracts with no higher levels limits: the United Kingdom. | |||||||||
Source: OECD Policy Questionnaire on Working Time Regulation. | |||||||||


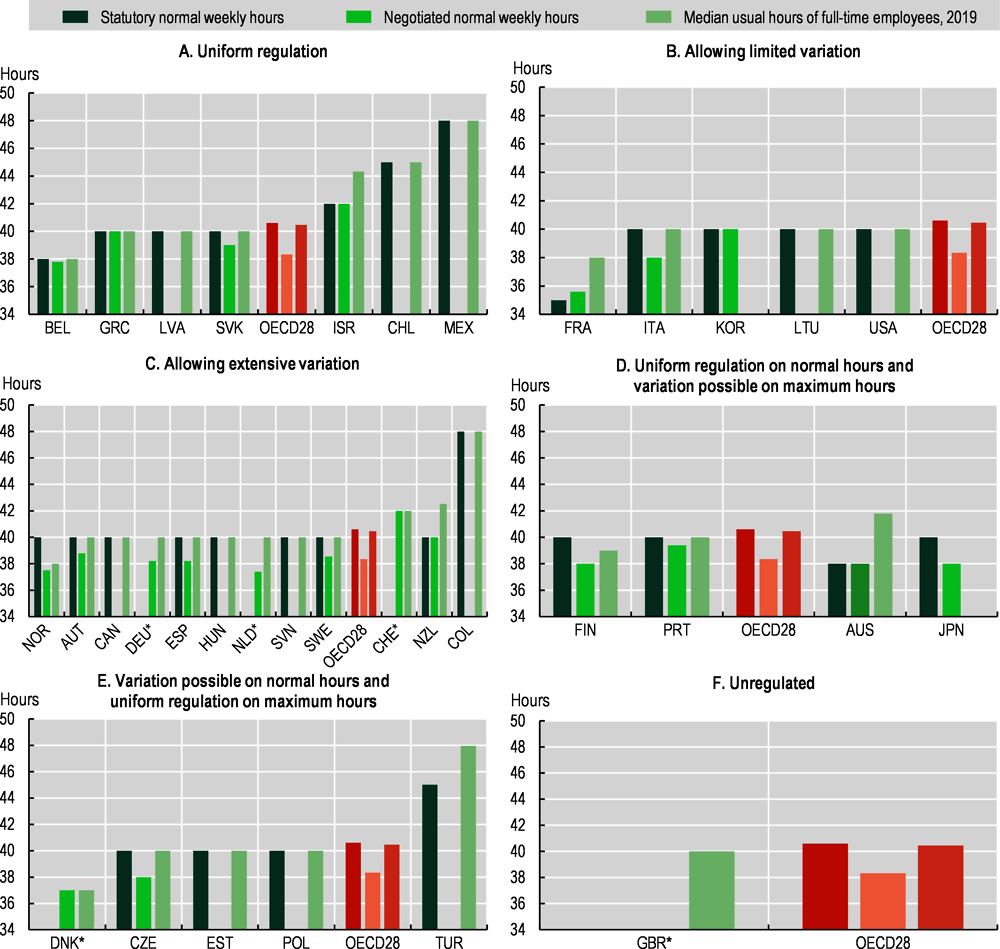
Note: Negotiated normal weekly hours in Australia refer to 36-40 hours and 37.1-40 hours in Sweden. Statistics shown are the median usual hours worked for full-time employees aged 15-64, except in Australia, Israel, New Zealand and Turkey where data on the average usual hours for full-time employees aged 15 or more are shown. Usual hours in Norway and Australia refer to 2018. Countries marked with a “*” are those for which there is no limit on normal weekly hours. OECD28 is the unweighted average of 28 OECD countries shown in this chart (excluding Australia, Costa Rica, Iceland, Ireland, Israel, Japan, Korea, Luxembourg, New Zealand and Turkey). Countries are ordered by ascending order of the median usual hours worked of full-time employees. For further details and explanations on the country grouping and the regulation of normal hours, see Table 5.1 and Annex Tables 5.A.1 and 5.A.6.
Source: OECD Policy Questionnaire on Working Time Regulation, 2020; OECD estimates based on the Canadian Labour Force Survey (CLFS) for Canada, the Encuesta Nacional de Empleo (ENE) for Chile, the Gran Encuesta Integrada de hogares (GEIH) for Colombia, the European Union Labour Force Survey (EU-LFS) for the European countries, the Encuesta Nacional de Ocupación y Empleo (ENOE) for Mexico and the Current Population Survey (CPS) for the United States; and the OECD Employment Database, http://www.oecd.org/employment/emp/onlineoecdemploymentdatabase.htm, for Australia, Israel, New Zealand and Turkey.
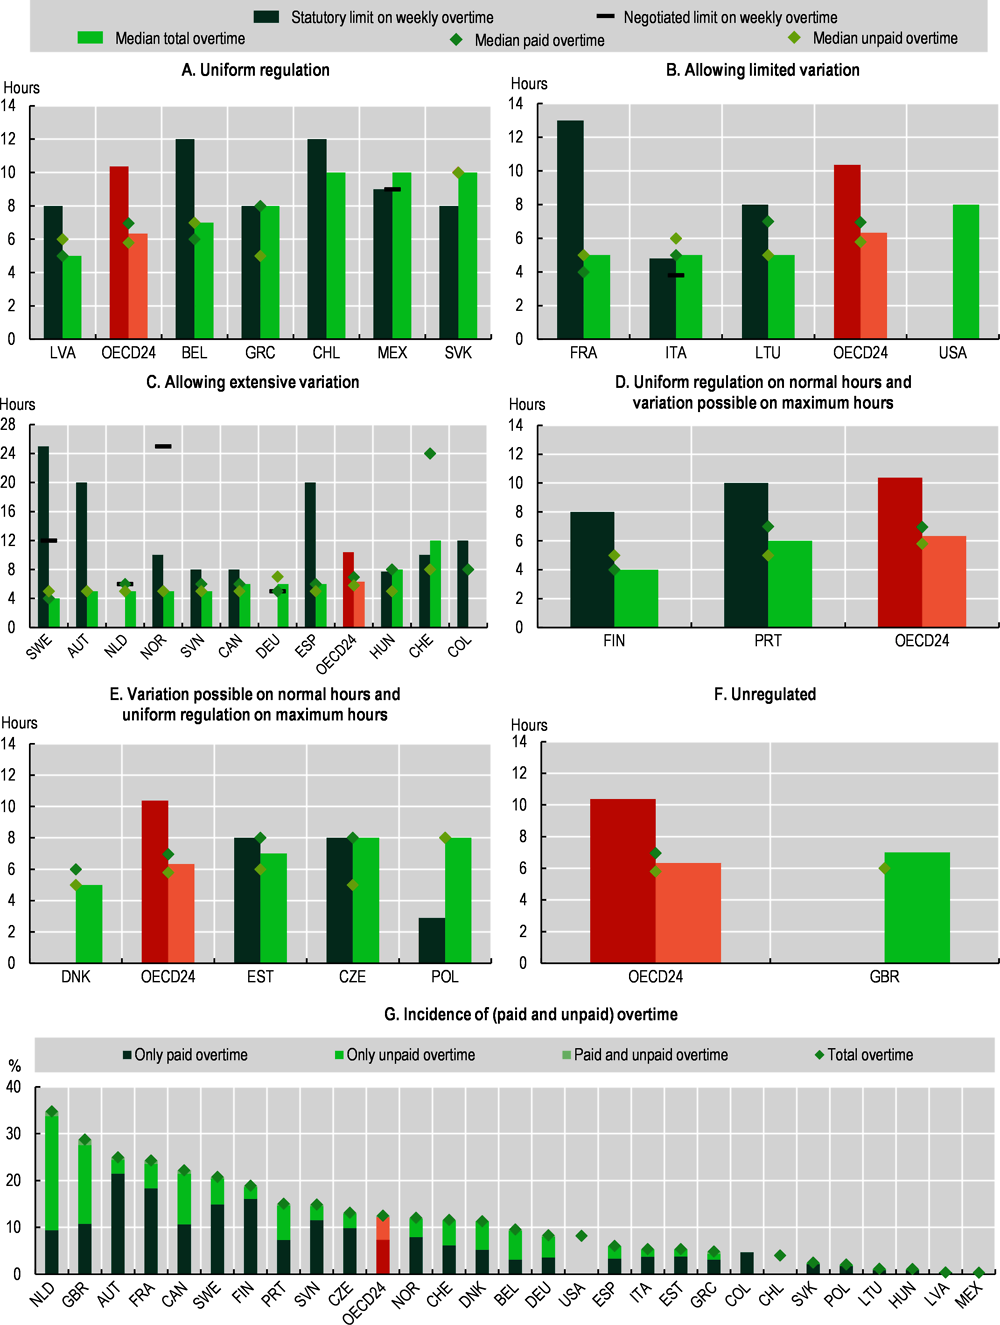
Note: The statutory weekly overtime limit in France, Estonia, Finland, Greece, Canada and Belgium are calculated as the difference between the limits on weekly normal hours and weekly maximum hours. The statutory weekly overtime limit is calculated from the yearly overtime limit in Hungary, Italy, Poland and Turkey, and from the daily overtime limit in Slovenia, Portugal, Sweden and Switzerland. Data on the incidence and median hours of overtime in Norway are from 2018. OECD24 is the unweighted average of the 24 OECD countries shown in this chart for which information on both paid and unpaid overtime is available (excluding Australia, Chile, Colombia, Costa Rica, Iceland, Ireland, Israel, Japan, Korea, Luxembourg, Mexico, New Zealand, Turkey and the United States). Countries are ordered by ascending order of the median total hours of overtime of full-time employees. For further details and explanations on the country grouping and the regulation of maximum hours, see Table 5.1, Annex Tables 5.A.2 and 5.A.7.
Source: OECD Policy Questionnaire on Working Time Regulation, 2020; OECD estimates based on the Canadian Labour Force Survey (CLFS) for Canada, the Encuesta Nacional de Empleo (ENE) for Chile, the Gran Encuesta Integrada de hogares (GEIH) for Colombia, the European Union Labour Force Survey (EU-LFS) for the European countries, the Encuesta Nacional de Ocupación y Empleo (ENOE) for Mexico and the Current Population Survey (CPS) for the United States.
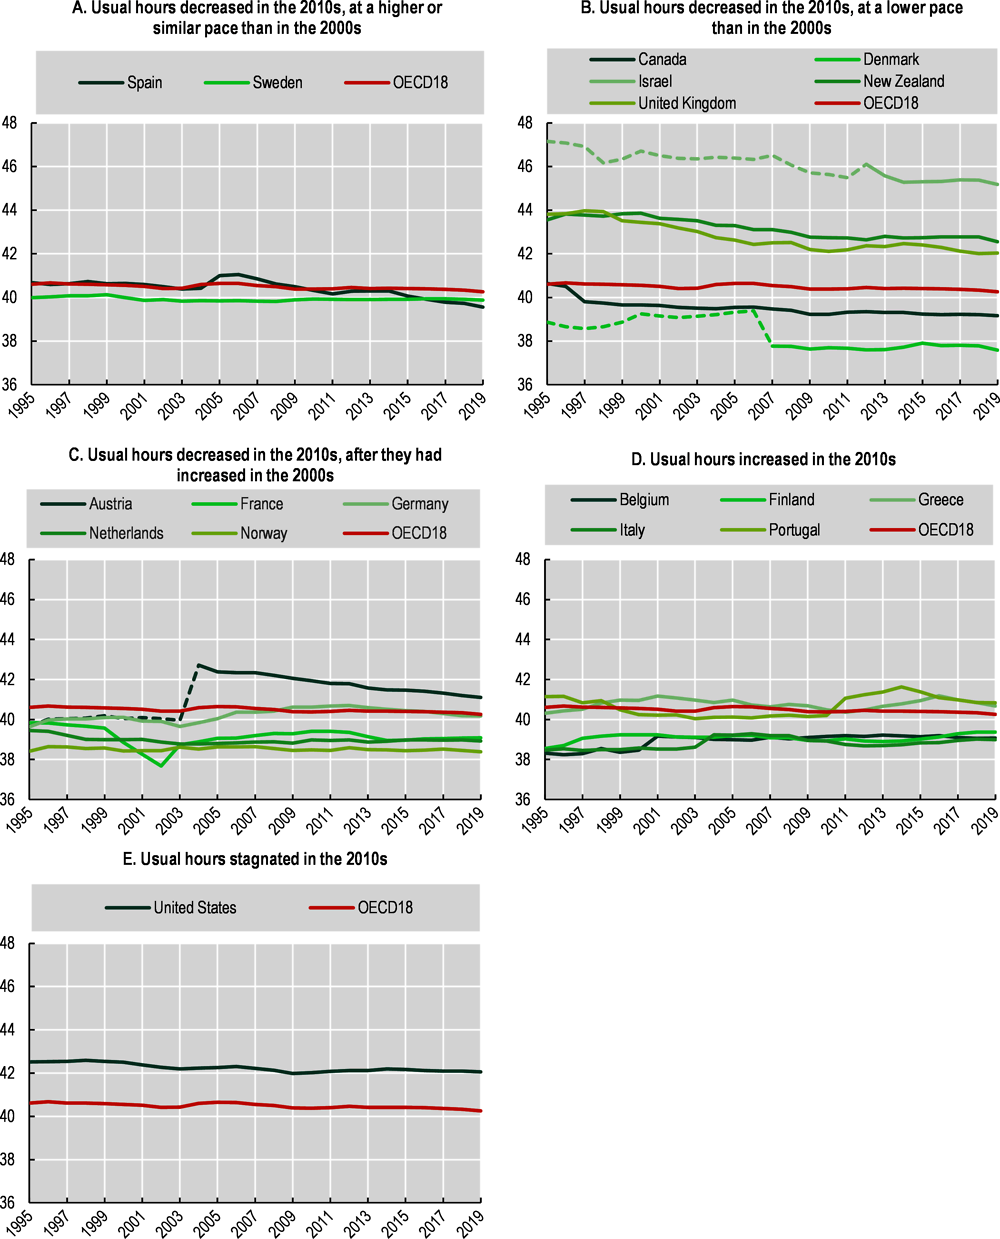
Note: Break in series for Austria in 2004 are due to a new categorisation of full-time job based on self-assessment (while it was previously based on a 35 hours cut-off before that year); breaks for Denmark in 2007 are due to the introduction of a new weighting scheme; and breaks for Israel are due to the change from a quarterly to a monthly Labour Force Survey and to changes in the definitions from “civilian labour force” to “total labour force” (including those who are in compulsory or permanent military service). Dashed lines refer to the series prior to the break in series (Austria, Denmark and Israel). The Netherlands are included in Panel C for simplification, although usual hours decreased in the 2010s after they had been stagnating in the 2000s. OECD18 is the unweighted average of the 18 OECD countries shown in this Chart.
Source: OECD estimates based on the Canadian Labour Force Survey (CLFS) for Canada, the European Union Labour Force Survey (EU-LFS) for the European countries, the Current Population Survey (CPS) for the United States; and the OECD Employment Database, http://www.oecd.org/employment/emp/onlineoecdemploymentdatabase.htm, for Israel and New Zealand.
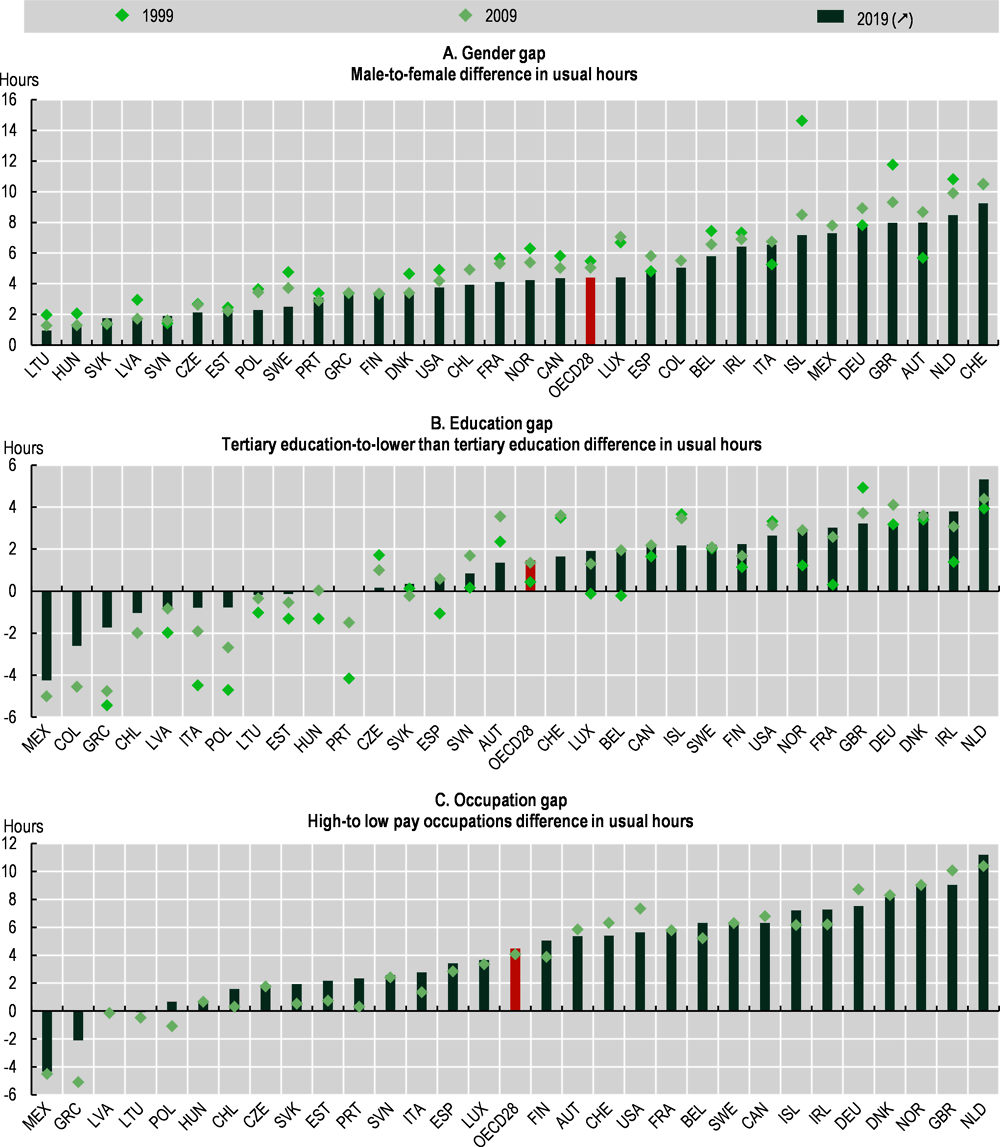
Note: OECD28 is the unweighted average of 28 OECD countries (excluding Australia, Chile, Colombia, Costa Rica, Israel, Japan, Korea, Mexico, New Zealand and Turkey). 1999 refers to 2001 for Poland (Panels A and B); and 2009 refers to 2010 for Chile. No data in 1999 for Chile, Colombia and Mexico. See the note in Figure 5.13 for the definition of occupation groups.
Source: OECD calculations based on the European Union Labour Force Survey (EU-LFS), the Canadian Labour Force Survey (CLFS) for Canada, the Encuesta Nacional de Empleo (ECE) for Chile, the Gran Encuesta Integrada de Hogares (GEIH) for Colombia, The Encuesta Nacional de Ocupación y Empleo (ENOE) for Mexico and the Current Population Survey (CPS) for the United States.
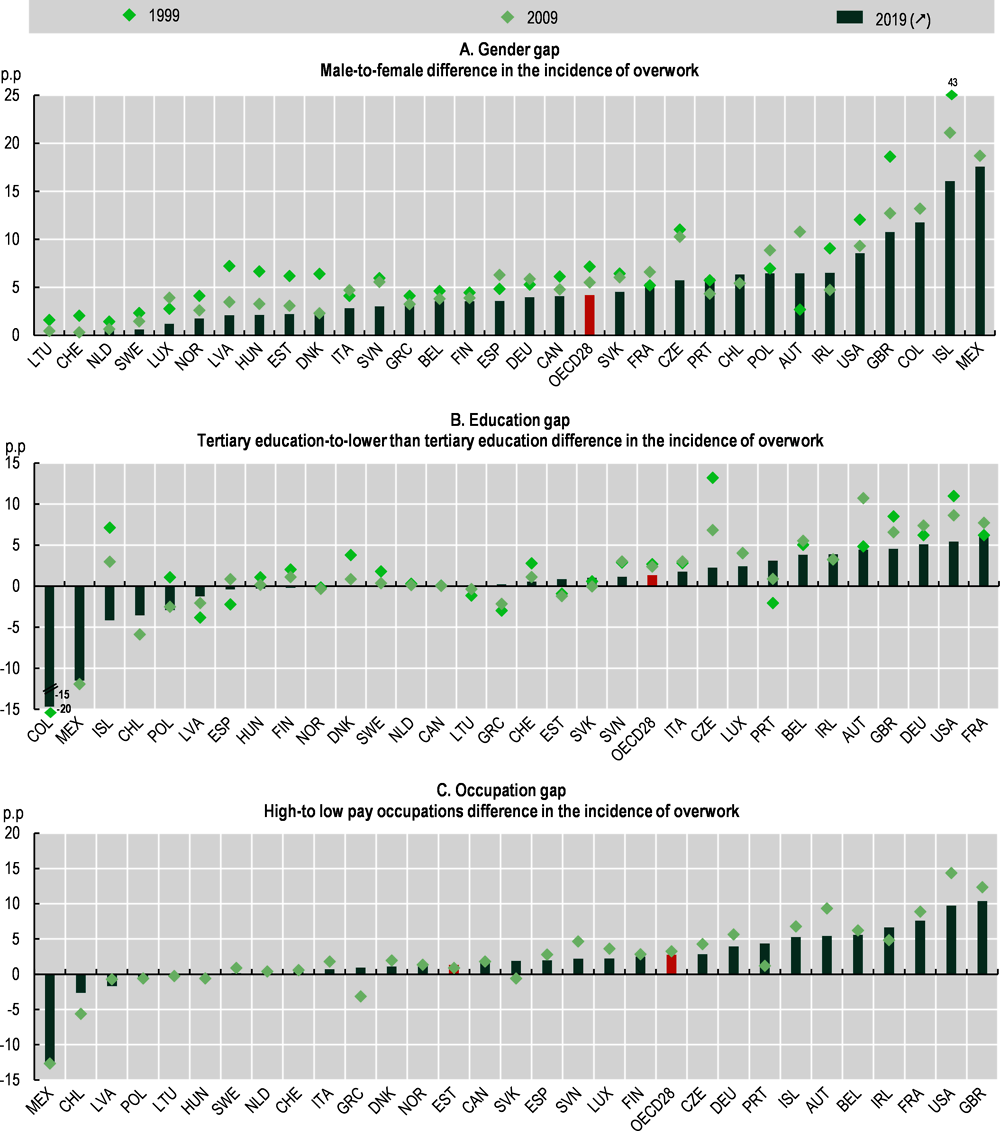
Note: OECD28 is the unweighted average of 28 OECD countries (excluding Australia, Chile, Colombia, Costa Rica, Israel, Japan, Korea, Mexico, New Zealand and Turkey). 1999 refers to 2001 for Poland (Panels A and B); and 2009 refers to 2010 for Chile. No data in 1999 for Chile, Colombia and Mexico. See the note in Figure 5.13 for the definition of the occupation groups.
Source: OECD calculations based on the European Union Labour Force Survey (EULFS), the Canadian Labour Force Survey (CLFS) for Canada, the Encuesta Nacional de Empleo (ECE) for Chile, the Gran Encuasta Integrada de Hogares (GEIH) for Colombia, the Encuesta Nacional de Ocupación y Empleo (ENOE) for Mexico and the Current Population Survey (CPS) for the United States.
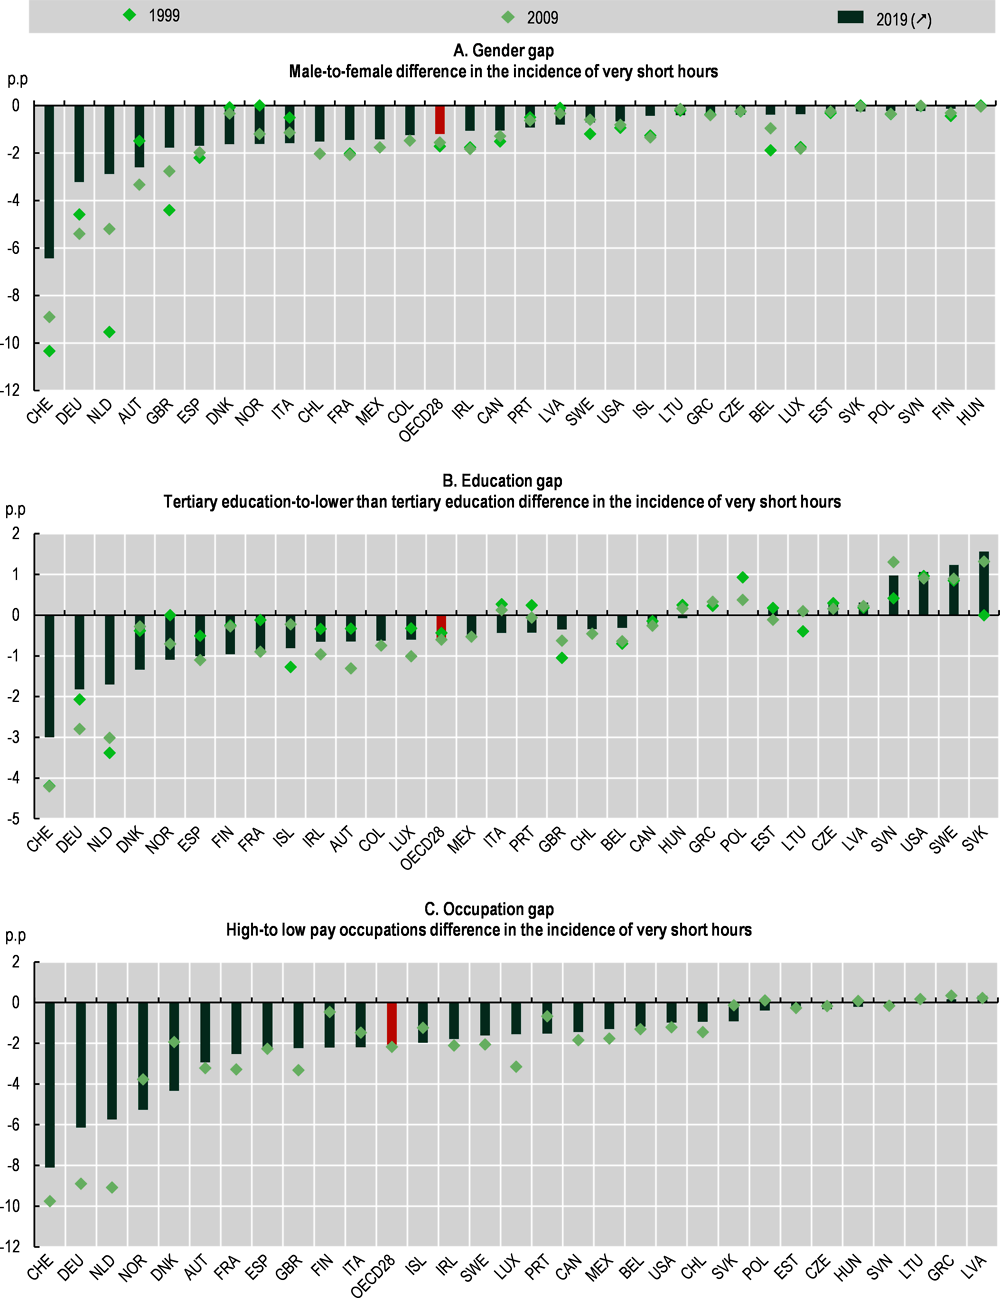
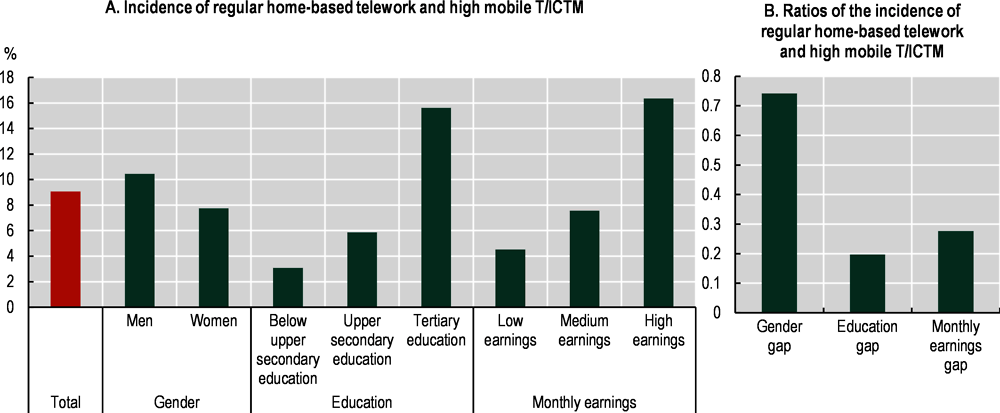
Note: Statistics shown in this chart refer to all employees using always or almost of all the time ICT and working in at least one other location than the employer’s premises several times a month (either from home at least several times a month and in all other locations (except employer’s premises) less often than several times a month or at least several times a week in at least two locations other than the employer’s premises or working daily in at least one other location). Unweighted averages of 28 OECD countries: Austria, Belgium, the Czech Republic, Denmark, Estonia, Finland, France, Germany, Greece, Hungary, Ireland, Italy, Korea, Latvia, Lithuania, Luxembourg, the Netherlands, Norway, Poland, Portugal, the Slovak Republic, Slovenia, Spain, Sweden, Switzerland, Turkey, the United Kingdom and the United States. Monthly earnings categories refer to the terciles of the net monthly earnings in the main job. The gender gap refers to the ratio of the incidence of women over the incidence of men and the education and earnings gaps refer, respectively, to the ratio of low-skilled to high-skilled and to the ratio of low earnings to high earnings. 2015 refers to 2017 for Korea.
Source: OECD calculations based on the 6th European Working Conditions Survey (EWCS), the 5th Korean Working Conditions Survey (KWCS) and the American Working Conditions Survey (AWCS) 2015.
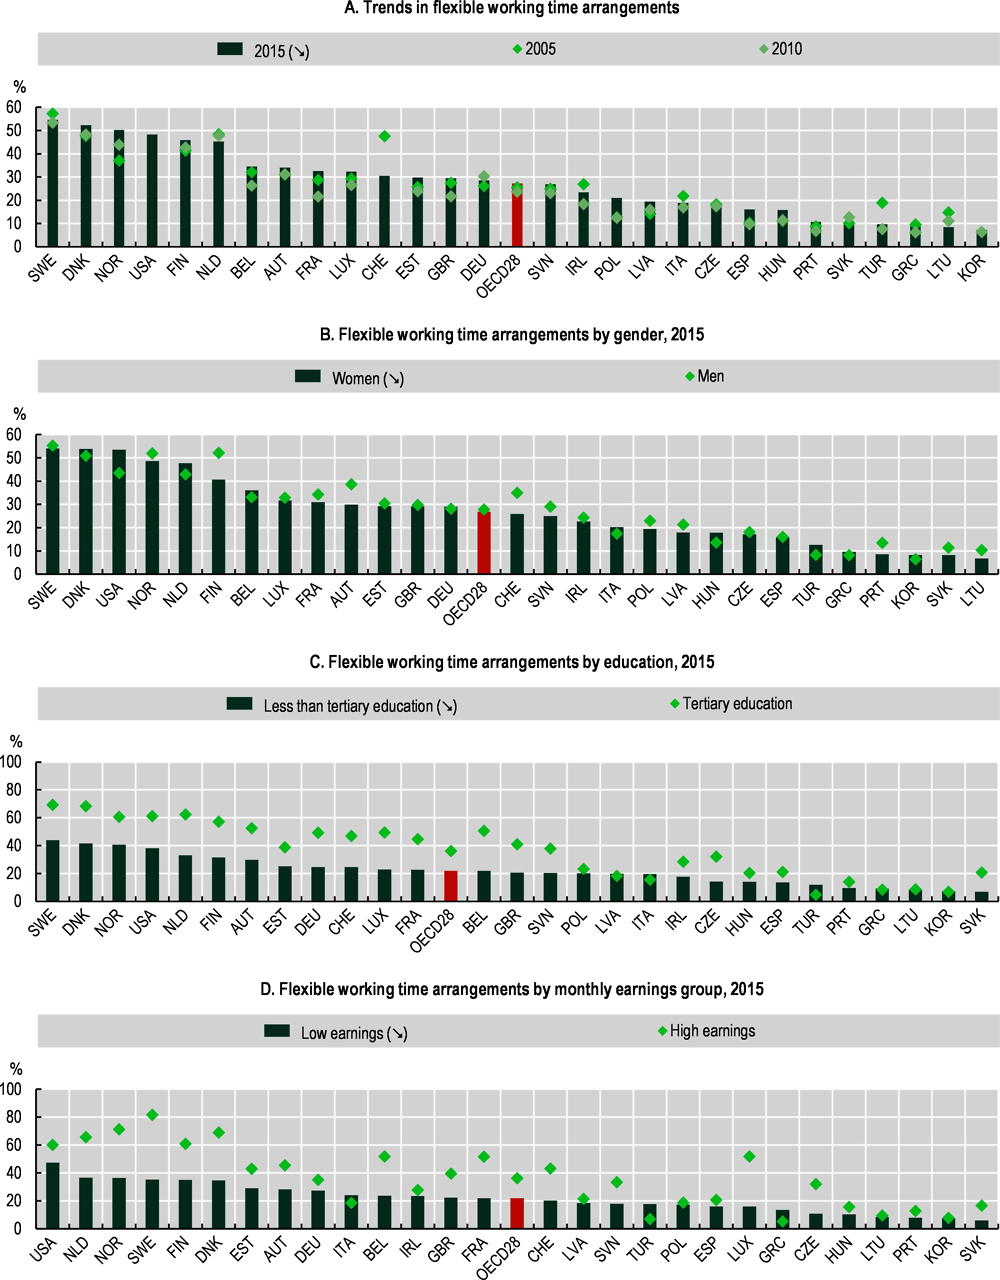
Note: Flexible working hours refer to the situation of employees who can either fully determine or at least adapt within certain limits their working hours (e.g. flexitime). Monthly earnings categories (Panel D) refer to the 1st and last terciles of the distribution of the net monthly earnings in the main job. OECD28 is the unweighted average of the 28 OECD countries shown in this chart. This average is estimated for 2005 and 2010 by chaining the unweighted averages based on 26 countries (excluding Switzerland and the United States) in 2010-15, and the unweighted average based on 25 countries (excluding Korea, Switzerland and the United States) in 2005-10. 2010 and 2015 refer, respectively to 2011 and 2017 for Korea. No data for Switzerland in 2010.
Source: OECD calculations based on the 4th, 5th and 6th European Working Conditions Survey (EWCS), the 1st, 3rd and 5th Korean Working Conditions Survey (KWCS) and the American Working Conditions Survey (AWCS) 2015.
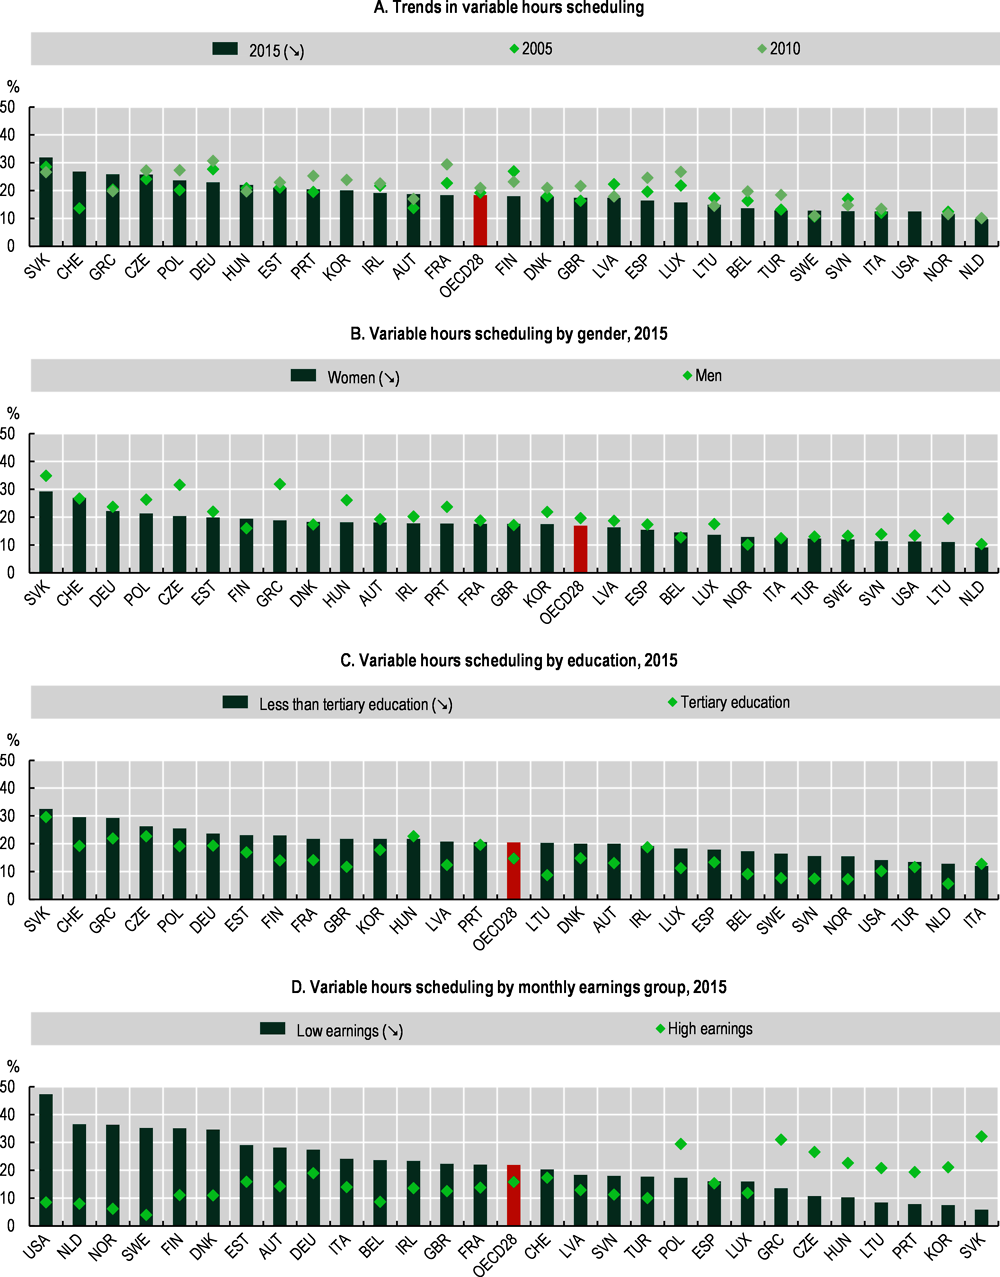
Note: Variable hours scheduling refers to situation of employees for which working time arrangement is set by the employer or who have to choose between fixed several fixed hours schedules determined by the employer (e.g. shift work) and who are informed about changes in their work schedules at relatively short notice. Monthly earnings categories (Panel D) refer to the 1st and last terciles of the distribution of the net monthly earnings in main job. OECD28 is the unweighted average of the 28 OECD countries shown in this chart. This average is estimated for 2005 and 2010 by chaining the unweighted averages based on 26 countries (excluding Switzerland and the United States) in 2010-15, and the unweighted average based on 25 countries (excluding Korea, Switzerland and the United States) in 2005-10. 2010 and 2015 refer, respectively to 2011 and 2017 for Korea. No data for Switzerland in 2010.
Source: OECD calculations based on the 4th, 5th and 6th European Working Conditions Survey (EWCS), the 1st, 3rd and 5th Korean Working Conditions Survey (KWCS) and the American Working Conditions Survey (AWCS) 2015.
Notes
← 1. The second relationship, between working time outcomes and labour market outcomes such as productivity, employment and workers’ well-being, will be the object of future OECD work.
← 2. In general, except in some particular cases, the chapter focuses on rules for, and outcomes of, full-time employees. It should be noted that this might be less representative of the situation for the whole employed population in countries with high incidence of self-employment, like Italy, Greece or Poland, or in countries with a high incidence of part-time employment, such as the Netherlands.
← 3. The data reported correspond to the pre COVID-19 situation and do not account for temporary changes introduced as a response to the pandemic, which are discussed in a dedicated section below.
← 4. In the case of locally regulated regimes where firm-level agreements or even individual contracts dominate, the chapter could not always capture the content of the rules negotiated at these levels.
← 5. Derogations are meant as deviation in peius (e.g. provisions that would be less favourable to workers) from higher-level rules. By default, it is almost always possible to deviate in melius from higher-level rules, i.e. to agree on a rule that is more favourable to workers.
← 6. Daily working hours limits also apply in some contexts. Where daily limits but not weekly ones exist, daily limits have been multiplied by the number of working days to present weekly ones in the chapter.
← 7. France has the lowest statutory limit among OECD countries since the Aubry law which introduced the 35-hour workweek in 2002.
← 8. Beyond this statutory limit, effective limits on normal hours in Australia are often set at an industry and occupational level in modern awards and can also feature in enterprise agreements.
← 9. Deviations directly granted in the law also exist for particular groups, but they are not considered in this section as a source of variation from the norm as such statutory derogations merely set a different ceiling for different groups, but that ceiling is binding, and local actors cannot deviate from the rules on the ground.
← 10. Only at the sectoral / central level in Sweden.
← 11. In many countries, there are several possible ways to introduce averaging, from least demanding on the employer (unilateral introduction), to more demanding (employee-employer agreement), to most demanding (collective bargaining agreement). Countries are classified according to the least demanding possibility existing (i.e. if in a country, it is possible for employers to introduced averaging unilaterally, even though this is sometimes done through collective bargaining, that country will be grouped with other countries where averaging can be unilaterally introduced).
← 12. In Finland, averaging can be decided by simple agreement between employee and employer; however it is most often agreed upon through collective agreement.
← 13. In Hungary, employers can unilaterally decide to define normal working hours not on a weekly basis, but over a longer period of time (called “time banking”): 4 months by default, 6 months in some cases (e.g. continuous shifts, seasonal work, stand-by jobs, etc.; a longer defining period of 36 months is also possible, but it requires a collective agreement). In the context of time banking, the overall limit of 48 hours per week (including overtime) must be respected on average over 4 or 6 months (and over a maximum of a year in the case of the 36 months “time banking” agreed upon by collective bargaining). So technically, employers can unilaterally decide to define normal working hours over 4 or 6 months, during which total hours must respect the 48 hours limit on average. Since this double mechanism can be used to delay the starting point of overtime rates, it is considered here an equivalent to normal hours averaging.
← 14. In Australia, averaging arrangements can also be set in modern awards. However, countries are classified according to the least demanding possibility to introduce averaging existing, see Note 11.
← 15. In Korea, employers can unilaterally decide to average normal hours over a maximum averaging period of two weeks. For longer averaging periods (3 or 6 months), a collective agreement is necessary. However, since countries are classified here according to the least demanding possibility existing (see Note 11), Korea is classified in this group.
← 16. The normal hours limit in the United States stems from the provision in the Fair Labor Standards Act (FLSA) according to which employees must be paid overtime compensation when working more than 40 hours per week – which in practice, corresponds to the definition of a normal hours limit as defined in most OECD countries, and in this chapter. This limit does not apply to “exempt workers“ under the FLSA (mainly workers employed as bona fide executive, administrative, professional, outside sales employees and agricultural workers. Exemptions are set at the federal level, and states cannot deviate from the provisions in the FLSA. For more details see, https://www.dol.gov/sites/dolgov/files/WHD/legacy/files/fs17a_overview.pdf; https://www.dol.gov/sites/dolgov/files/WHD/legacy/files/whdfs12.pdf).
← 17. Sectoral only in Sweden.
← 18. In some countries, limits on minimum daily rest may also exist, either in the law or in collective agreements. These can act as limits on maximum hours.
← 19. In the EU Member States and Norway, collective bargaining on the length of working time takes place within the framework of the EU Directive on working time (Directive 2003/88/EC), which limits working hours inclusive of overtime to 48-hours per week on average over four months, and mandates a minimum daily rest period of 11 hours and a minimum uninterrupted weekly rest of 35 hours.
← 20. After that limit, more overtime is possible but it has to be compensated with time-off.
← 21. In cases where normal weekly hours are capped at 45 hours; in other cases, where normal weekly hours are capped at 50 hours, the maximum quantity of overtime is set at 140 hours per year.
← 22. Although in Australia some awards may contain provisions on minimum daily rest. In addition, in Australia and New Zealand, employees can refuse a request to work overtime if the amount of additional hours is “unreasonable”; however this concept of unreasonable hours is not precisely defined but determined on a case by case basis (should the employee contest the request for overtime), based on factors including risks to health and safety, or family responsibilities.
← 23. Although a statutory minimum daily rest of 11 hours apply. The United Kingdom formally introduced the European Union 48 hours limit, but with a broadly used individual opt-out system which largely reduces its effect in practice. Employees have to individually consent to the opt-out, however the latter is sometimes attached to employment contracts, and employers can legally refuse to hire a new worker who declines to opt-out (Barnard, Deakin and Hobbs, 2003[50]). Note that this classification is aligned with the Eurofound classification of the United Kingdom in the “Unilateral working time regime” group where statutory legislation hardly plays a role and the most important institutional level for working time regulation is the individual one (Eurofound, 2016[36]).
← 24. Derogations from the overtime / maximum hours limit considered in this chapter do not include derogations in cases of force majeure and emergency work – these exist in the majority of OECD countries, and do not represent a good measure of how binding and uniform vs. variable the regulation of maximum hours is. As with the limit on normal hours, there might also be deviations directly granted in the law for particular groups (for instance, in Belgium, the law sets a higher maximum hours limit in case of continuous work, and a higher limit can be granted for certain particular industries by Royal decree). However, these are not considered here as a source of variation from the norm, since such statutory derogations merely set a different ceiling for different groups, but that ceiling is binding, and local actors cannot deviate from the rules on the ground.
← 25. See Note 13. The double mechanism of unilaterally introduced time banking to define normal schedules (and the start of overtime), and averaging of total hours within that time banking period, allow employers to unilaterally go beyond the 48 hours limit in any week within the averaging period, provided the limit is respected on average. This mechanism is an equivalent to averaging of maximum hours.
← 26. Although in cases of unforeseen circumstances or exceptional increase in work, workers can renounce compensation in time for overtime hours in Belgium.
← 27. Except for exempt workers under the FLSA, see Note 16.
← 28. In Germany, employers can unilaterally extend the 48 hours limit up to 60 hours through averaging mechanisms. Derogations through collective bargaining are also possible, but only in the particular case of work characterised by substantial proportions of standby work. Since this is unlikely to correspond to the majority of cases, the maximum hours limit is considered “binding” for the purpose of this exercise.
← 29. See Note 15. The same conditions apply to the averaging of maximum hours as to that of normal hours.
← 30. Maximum hours can also be exceeded through an excess hours permit in Canada.
← 31. Although, see Notes 22 and 23: in Australia and the United Kingdom, provisions on minimum daily rest act as a de facto limit on the maximum amount of work that can be performed.
← 32. Except for statutory derogations for e.g. specific occupations that are fixed in the law, see Note 9.
← 33. For instance the presence and binding nature of minimum compensation for overtime – although information on this is discussed above and in Annex Table 5.A.7).
← 34. Usual hours considered here do not include overtime except for regular overtime determined by agreement between the employee and the employer.
← 35. This unweighted average covers 28 OECD countries, excluding those for which data on median usual hours are unavailable (Australia, Israel, Japan, Korea, New Zealand and Turkey), and those for which information on the governance of working hours could not be collected (Costa Rica, Iceland, Ireland, and Luxembourg).
← 36. This average falls down to 39.7 hours per week when excluding the countries with median usual hours superior or equal to 45 hours per week (namely Chile, Colombia and Mexico).
← 37. Data on collectively agreed rules have been collected in the OECD questionnaires and generally refer to the average or most frequent clause among all covered workers by collective bargaining at the sectoral level (except for Japan and Estonia where it refers to the average of rules at the firm level). It should be borne in mind these data are patchy and often difficult to compare.
← 38. Except in France, where the negotiated limit is higher than the statutory one, but where the statutory normal hours limit is also the lowest of the OECD. Moreover, the negotiated rules in France, although higher than the statutory one, remain low compared to other EU countries for which data on negotiated rules are available, with an average of 35.6 hours a week according to Cabrita and Brandsma (2019[8])). By contrast, France is one of the only countries where usual hours observed exceed the statutory limit on working hours.
← 39. Except in France, where a typical full-time employee works more than the stipulated statutory weekly limit. This might be due to the prevalence of the “forfait jour” regime, which allows stipulating contractual hours above the statutory 35 hours limit, that are not counted as overtime, but are compensated through “reductions in working time” days Réductions de Temps de travail, or RTT, a lump-sum of time which workers accumulate and can use later. This regime concerns 1 in 8 employees in the private sector. See also Note 64.
← 40. Although all countries are represented in the graph, they might not all be visible since many countries cluster behind similar co-ordinates, e.g. (40,40) – see Annex Figure 5.A.1 for more detailed data.
← 41. However note that in Australia and Israel, where normal hours are uniformly regulated, average usual hours are higher than the statutory limit. Australia and Israel are, however, not represented on Figure 5.2 since data on median usual hours are lacking. In Finland, median usual hours are below the statutory limit, at 39 hours.
← 42. The fourth one being France, see Note 39.
← 43. Not shown in the chart.
← 44. The high standard deviations in normal hours in Mexico might be partly attributable to the fact that Mexican labour law recognises three types of work shifts of different normal lengths: the day shift (8 hours), the night shift (7 hours), the mixed shift (7.30 hours). It should also be noted that data presented in Figure 5.2 for Mexico might suffer from selection bias, due to the way in which usual hours are identified: workers answering “no” to the question Q5c. in the Encuesta Nacional de Empleo e Occupacion (ENOE) “Is this the number of hours you usually work?” are dropped from the sample.
← 45. Being in the group of countries allowing for extensive variation is negatively correlated with standard deviation in usual weekly hours, while being in the groups of countries with uniform regulation or allowing for a limited variation only is positively correlated to it – yet none of these correlations are statistically significant.
← 46. For countries for which such data could be collected. In general, data on negotiated provisions correspond either to most frequent provisions, or to the negotiated provisions in one particular representative sector.
← 47. Except in Switzerland, which is the clear outlier in Panel A of Figure 5.3.
← 48. Another element pointing towards rules evasion / a lack of enforcement of rules on overtime is the non-negligible incidence of unpaid overtime, as well as the high average hours reported. A 2020 report by the European Agency for Safety and Health at Work suggests that awareness of psychosocial risks linked to prolonged hours is lagging behind in European workplaces, with only 29% of firms reporting that they would intervene to stop employees working excessively long hours. Reluctance to openly discuss these issues is cited as the number one issue preventing progress in this area (EU-OSHA, 2029[52]).
← 49. By contrast, low-paid workers might work more unpaid overtime: for instance Green (2017[5]) showed that unrecorded and unpaid overtime hours (“off-the-clock work”) in the United States were mainly driven by low-skill workers, those in non-supervisory positions and those paid by the hours. Low-paid workers are also more likely to work a second job rather than working paid overtime. These second jobs would not be counted as overtime. Accordingly, there is a positive and significant (although small, i.e. inferior or equal to 0.2) correlation between earnings and paid overtime hours for full-time employees reporting paid overtime in 12 of the 18 OECD countries where data are available.
← 50. For firms, it contributes to preserving workers’ human capital by providing a period of rest and recovery that enables them to remain productive. It can contribute to reduce absenteeism, and to increase workers’ motivation. For workers, paid leave is not only a way to regenerate their own human resources, but a driver of well-being.
← 51. The EU Working Time Directive (1993) establishes that “Member States shall take the measures necessary to ensure that every worker is entitled to paid annual leave of at least four weeks, which may not be replaced by an allowance in lieu”.
← 52. The ILO Holidays with Pay Convention 1970 (No. 132) entitles workers to take three weeks of paid leave each year. Those who have been employed for less than one year but longer than six months have a right to a proportional period of paid leave. The Convention also specifies that it should be possible for an employee to take two weeks of the annual leave in one block without interruption. The timing of the leave period should in principle be set by the employer, in consultation with the employee or his/her representatives.
← 53. Although many employers in the United States grant at least some of their employees paid leave, there is no law that establishes a legal minimum entitlement.
← 54. The ILO Convention prescribes three weeks of paid leave – a 15-day entitlement when expressed in working days and on the basis of a five-day working week.
← 55. For instance in Australia shift workers may get up to 25 days.
← 56. Possibly more in some collective agreements.
← 57. These entitlements are primarily found in central government agreements, with fewer than 7% of private sector employees covered by collective agreements entitled to above statutory minimum leave (Blumenfeld, Ryall and Kiely, 2015[9]).
← 58. For instance extra days are granted in the cleaning and security sector in Israel, in the banking sector in Greece, and, after five years of service, in the metal, machinery and electronic industry in Switzerland.
← 59. This is the case in the Canadian Province of Quebec: up to 30 days for employees covered by a collective agreement and with 20 years of service in Quebec.
← 60. In Korea, that is the case if normal operations are greatly disturbed. In Japan, another day of leave has to be granted in replacement.
← 61. In France for instance, public holidays are not systematically non-working days for all employees, except for the 1st of May.
← 62. Public holidays are not included here because available data sources on leave actually taken (e.g. the Structure of Earnings Survey for the European countries and the General Survey of working conditions for Japan) do not include them.
← 63. Unfortunately no data on negotiated paid leave in France could be collected.
← 64. This scheme is a particularity of the French system, whereby collective agreements stipulate that high-skilled workers and those in managerial positions are not subjected to the usual limits on normal weekly hours and overtime, but cumulate “reductions in working time” days (Réductions de Temps de travail, or RTT) as a lump sum (forfait jour) in compensation. The number of RTT days varies every year but is around 10 days annually. See also Note 39.
← 65. Data for the United States refer to access to paid leave and not to leave effectively taken, and thus can not be compared with data represented in Figure 5.4.
← 66. This analysis is based on information before the COVID-19 crisis and excludes potential ensuing changes in the legislation – for a summary of COVID-19 related evolutions to date, see 1.4 below.
← 67. There are two types of teleworking in Italy. Occasional teleworking, “lavoro agile”, falls in this first category. Regular teleworking falls in the third category, see below.
← 68. In Spain, employees have a right to ask for teleworking for work-life balance adaptations; in this case, employers have to motivate their refusal and show that the request is unreasonable. When teleworking is asked for any other reason than work-life balance, however, employers can refuse without justification.
← 69. “Encompassing” legal frameworks are defined as such if they regulate most working conditions of teleworkers. For instance, while most countries still do not mandate the recording of teleworkers’ hours (Vargas Llave and Weber, 2020[49]), legal frameworks regulating most other aspects (e.g. occupational safety and health, cost of equipment, working hours, etc.) are still considered “encompassing”. By contrast, regulations only stipulating the conditions for workers to request teleworking (e.g. by written demand) and for employers to respond (e.g. written notification within x months) are not considered encompassing.
← 70. Note that in Canada, there are binding guidelines on how employees can request flexible work arrangements (including teleworking), and how employers must respond to those requests. However these do no constitute « encompassing » legal frameworks as defined in this section – see Note 69.
← 71. There are two types of teleworking in Belgium, both fall within this third category, but occasional teleworking is regulated in the law, while regular teleworking is regulated in a central collective agreement.
← 72. Such as for instance those with a minimum amount of service in the same company in Australia, the Netherlands and the United Kingdom; the victims of domestic violence in Portugal; workers with disability or chronic diseases in Italy, or employees with specific caring duties in Lithuania. Only in Spain and New Zealand is this right opened to all employees (but it is conditioned by the employee justifying work-life balance needs in Spain).
← 73. According to a 2020 study, it ranged from just under 30% in the Slovak Republic, to 54% in Luxembourg (Fana, 2020[37]).
← 74. The 25 March 2020 ordinance also allows the derogations to the minimum 11 hours daily rest from 11 to 9 hours and modify Sunday rest time.
← 75. The Swedish Municipal Workers Union signed a crisis agreement for workers in municipalities which gives the employer the possibility to exceed 48 hours a week in case of special need for overtime. Employees are guaranteed 24 hours off work with pay after the crisis agreement expires and paid 120 to 150% of the regular pay per hour.
← 76. See paragraph 1155(4) General Civil Code (Allgemeines Burgerliches Gesetzbuch, ABGB). This regulation ceased to apply on 31 December 2020.
← 77. There were no changes to the Paid Act Leave, however a decree under the Emergency Powers Act active until 30 June 2020 enabled the health care and social services sector employers to suspend or postpone employee’s paid leave if deemed necessary.
← 78. The Fair Work Commission temporarily amended the majority of awards to provide two weeks of unpaid pandemic leave and give workers the ability to take twice as much annual leave at half their normal pay rate if their employer agreed.
← 79. Statistics refer to the share of employees (aged 15-64) working usually or occasionally from home in 2019, and to the share of workers working from home in March/April 2020 who were usually employed before the onset of the COVID-19 crisis.
← 80. The work at home (“trabajo en casa”) status in Colombia is different from teleworking in that it is only accessible in exceptional circumstances preventing work to be performed on site. In parallel, the law 1221 of 2008 law regulates regular teleworking.
← 81. BGBl. I Nr. 61/2021. At this occasion, the Austrian Parliament also stated that the Working Hours Act (Arbeitszeitgesetz AZG) and the Rest Periods Act (Arbeitsruhegesetz ARG) apply without restriction to teleworking.
← 82. In Chile the law was introduced in March 2020, but negotiations on it had started before the COVID-19 outbreak.
← 83. As a consequence, all the descriptive trends presented in Sections 5.2 and 5.3 below are likely to be at least partly attributable to composition effects.
← 84. And 40.1 in 2020 – although note that this small drop is likely to be in large parts due to the pandemic context. Data for 2020 are not available in Germany, so this average is calculated with data for 2019 for this country.
← 85. Except for regular overtime, e.g. overtime anticipated and explicitly agreed on in individual contracts.
← 86. Changes in the statutory regulation of overtime might explain this surge in paid overtime in France: the use of paid overtime has indeed become more attractive since August 2016, when a law relaxed the terms and conditions for overtime compensation. In addition, since 1 January 2019, overtime pay is exempted from employees’ social security contributions and income tax (Brunetto et al., 2019[46]).
← 87. In addition to the relatively small reduction in the median amount of overtime observed, it is important to bear in mind that the reduction in overtime only applies the relatively small proportion of employees who are working overtime: in absolute terms, the reduction in hours of paid overtime is thus small.
← 88. Time use data are grouped in five broad categories: 1) paid work, which includes work-related activities, e.g. time spent on paid work (full or part time), studying, time spent looking for a job; 2) unpaid work, which includes domestic activities (cleaning, shopping, etc.) and time spent caring for a child or another person; 3) personal care, which relates to all regenerative activities, such as sleeping, eating, grooming, health related self-care, etc.; 4) leisure which concerns a wide range of indoor and outdoor activities, such as sports, entertainment, socialising with friends and family; 5) unspecified time which includes all activities not covered elsewhere (including e.g. religious activities, but also time spent going places and commuting). Weights are applied to correct for potential imbalances in the repartition of week-ends and weekdays.
← 89. Observing trends from these data, should, however, be done with caution due to the high frequency of breaks in the classification of activities. Confusion might also typically arise from the difficulty to distinguish between main and parallel activities when simultaneous activities are recorded. Other issues that may comparability across countries include differences in sample composition, the sampling of diaries, etc. – see OECD (2016[51]) for more details.
← 90. The OECD average for time spent on paid work presented from this section differs from the data on hours worked presented in Section 5.2.1 in terms of data sources, of definition (here paid work covers all work-related activities, including time spent on studies and searching for a job), but also in terms of country coverage. Hence, the two statistics are not comparable.
← 91. Although, as explained above, time spent on personal care has increased throughout that period.
← 92. While these two years are chosen based on data availability, they are also comparable since they are years of expansion, but not “peak” years – i.e. they occupy similar positions in the business cycle. 2019 can be considered as “not peak” because, in the absence of COVID-19, economies would have continued to grow. Also, a sensitivity test of the results was carried out by smoothing the data over two consecutive years (i.e. 1999-2000, 2009-10 and 2018-19) but this does not change the conclusions based on the years as shown in the Figure 5.13.
← 93. Australia, Japan, Korea and New-Zealand and Turkey are not covered in this OECD average due to data availability.
← 94. Data on very-short hours do not include employees aged 15-24.
← 95. Data are based for the European countries on the 4th, 5th and 6th waves of the European Working Conditions Survey (EWCS) for 2005, 2010 and 2015, on the 1srt, 3rd and 5th Korean Working Conditions Survey for Korea and on the American Working Conditions Survey for the United States (2015 only).
← 96. Variable hours scheduling refers to arrangements in which employees’ schedule is set by the employer and changed at a relatively short notice.
← 97. OECD Employment Database, http://www.oecd.org/employment/emp/onlineoecdemploymentdatabase.htm.
← 98. Although cross-country comparisons should be made with caution due to the relatively small sample sizes.
← 99. Although it should be noted that a number of states in the United States have minimum wages that are higher than the federal one.
← 100. OECD Employment Database, http://www.oecd.org/employment/emp/onlineoecdemploymentdatabase.htm, and Golden (2016[48]).
← 101. Similarly, anecdotal evidence on the working time preferences of gig workers, and in particular delivery riders (who are not presented in Figure 5.20) show that a majority of them also wish to work more hours (Drahokoupil and Piasna, 2019[47]). The fragmented nature (and the low pay rate) of on-demand gig work means that in 2017, a majority of Deliveroo riders expressed a preference to work on average 9 hours more for the platform each week (with only 12.5% saying they would like to work fewer hours).