1. Recent trends in international mobility of doctors and nurses
This chapter reviews the contribution of foreign-born and foreign-trained doctors and nurses to the rising number of doctors and nurses working in OECD countries over the past decade. The number of foreign-trained doctors working in OECD countries increased by 50% between 2006 and 2016 (to reach nearly 500 000 in 2016), while the number of foreign-trained nurses increased by 20% over the five-year period from 2011 to 2016 (to reach nearly 550 000). The United States is still the main country of destination of foreign-trained doctors and nurses, followed by the United Kingdom and Germany. The number of foreign-trained doctors has also increased rapidly over the past decade in some European countries like Ireland, France, Switzerland, Norway and Sweden. However, it is important to bear in mind that not all foreign-trained doctors are foreigners as a large number in countries such as Norway, Sweden and the United States are people born in the country who obtained their first medical degree abroad before coming back. In these cases, it is not appropriate to refer to this phenomenon as a “brain drain”, particularly as these people usually pay the full cost of their education while studying abroad.
The statistical data for Israel are supplied by and under the responsibility of the relevant Israeli authorities. The use of such data by the OECD is without prejudice to the status of the Golan Heights, East Jerusalem and Israeli settlements in the West Bank under the terms of international law.
1.1. Introduction
This chapter builds on and updates earlier work on the international mobility of health workers undertaken by the OECD, often jointly with WHO and the European Commission. In 2007, the chapter devoted to immigrant health workers in the OECD publication International Migration Outlook (2007[1]) presented a broad picture of the migration flows with a view to support more informed policy dialogues. This information on migration flows was updated in the 2015 edition of the International Migration Outlook (OECD, 2015[2]). This topic was also addressed in a chapter in the 2016 OECD publication, Health Workforce Policies: Right Jobs, Right Skills, Right Places (2016[3]), which analysed the impact of health and migration policies on the migration of foreign-trained doctors and nurses in OECD countries.
At the global level, the adoption of the WHO Global Code of Practice on the International Recruitment of Health Personnel in May 2010 called for a more ethical recruitment of health personnel to avoid active recruitment in those countries with acute shortages of skilled health workers as well as for a regular monitoring of the international mobility of health workers (WHO, 2010[4]). The third round of country reporting on the Global Code took place in 2018 and 2019, and a report on the implementation of the Code was discussed at the World Health Assembly in May 2019, contributing to such a regular monitoring.
The migration of health professionals takes place in a broader context of larger migration trends, including the increasing migration of highly-skilled workers and changes to the configuration of the European Union. There has been a steady rise in highly-skilled migration to OECD countries over the past 15 years: the number of tertiary-educated immigrants in the OECD more than doubled between 2000 and 2015.
This chapter draws on the OECD’s long experience in collecting data across OECD countries to review the most recent trends in the overall number of doctors and nurses working in OECD countries (Section 1.2) and update the information on the international migration of health workers measured in terms of both foreign-born doctors and nurses (Section 1.3) and foreign-trained (Section 1.4). Annex 1.A provides further data and analysis on the growing efforts in most OECD countries to train more doctors and nurses domestically to respond to their needs and in some cases also to reduce their reliance on foreign-trained health workers. Annex 1.B provides further information on the country of education of foreign-trained doctors working in the two main destination countries, the United States and the United Kingdom.
1.2. The number of doctors and nurses has increased in most OECD countries, driven mainly by growing numbers of domestic graduates
Concerns about shortages of health professionals are not new in OECD countries, and these concerns have grown in many countries with the prospect of the retirement of the ‘baby-boom’ generation of doctors and nurses. These concerns prompted many OECD countries to increase over the past decade the number of students in medical and nursing education programmes to train more new doctors and nurses in order to replace those who will be retiring and avoid a “looming crisis” in the health workforce.1
Because of these education and training policies, but also because of greater retention rates of current doctors and nurses and greater immigration of doctors and nurses in some countries, the number of doctors and nurses has continued to increase in most OECD countries since 2000, both in absolute number and on a per capita basis. In absolute number, a total of 3.7 million doctors and 11.2 million nurses were working in OECD countries in 2016, up from 2.9 million doctors and 8.3 million nurses in 2000. On a per capita basis, there were 3.4 doctors per 1 000 population on average across OECD countries in 2016, up from 2.7 in 2000 (Figure 1.1), and 8.6 nurses per 1 000 population, up from 7.3 in 2000 (Figure 1.2).
The growth in the number of doctors per capita has been particularly rapid in some countries that started with low levels in 2000, such as Korea, Mexico and the United Kingdom, converging to some extent to the OECD average. But there has also been rapid growth in several countries that already had high levels of doctors per capita in 2000 (e.g. Greece, Austria, Portugal and Norway2). The number of doctors per capita has also grown quite rapidly in Sweden, Germany and Australia.
On the other hand, the number of doctors per capita has grown much more slowly or remained stable since 2000 in Belgium, France, Poland and the Slovak Republic. In these four countries, the number of domestic students admitted in medical schools has increased in recent years, which should contribute to increasing the number of new doctors who will be available to replace those who will be retiring in the coming years, if these newly-trained doctors end up working in these countries.
In Israel, the absolute number of doctors has increased substantially since 2000 (by over 20%), but this has not kept up with population growth (which has gone up by more than 33%). This explains the reduction in the doctor-to-population ratio between 2000 and 2016.
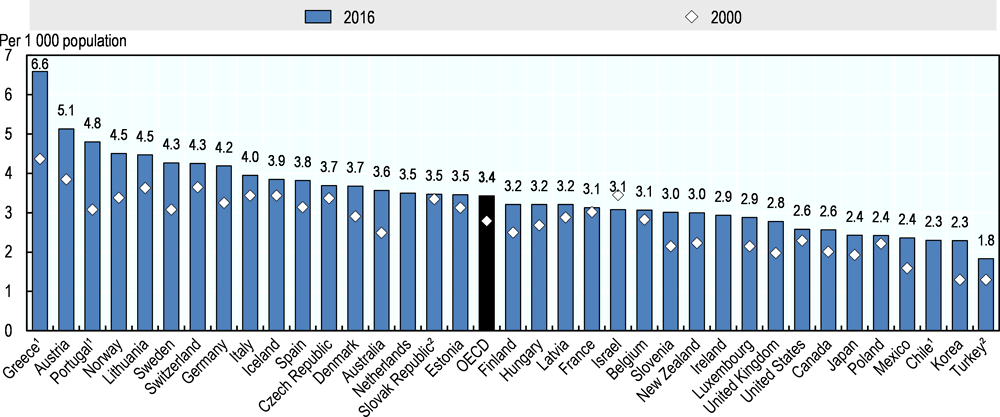
Notes: 1. Data refer to all doctors licensed to practice, resulting in a large over-estimation of the number of practising doctors (e.g. adding around 30% of doctors in Portugal). 2. Data include not only doctors providing care to patients, but also those working in the health sector as managers, researchers, etc. (adding another 5-10%).
Source: OECD Health Statistics 2018, https://doi.org/10.1787/health-data-en.
For nurses, the growth in the number per capita has been particularly rapid in countries that already had a relatively high number of nurses in 2000 such as Norway, Switzerland and Finland (Figure 1.2). In Switzerland, most of the growth in the number of nurses has been in lower-qualified nurses. Strong growth in the number of nurses per capita has also occurred in Japan and Korea. The growth rate has been more modest, but still noticeable, in the United States, Canada and Australia. In the United Kingdom, the number of nurses per capita increased rapidly between 2000 and 2006, but has gradually decreased since then, so that the number per capita was slightly lower in 2016 than in 2000. Similarly, in Ireland, the number of nurses peaked at 13.6 per 1 000 population in 2008, but has decreased since then to 11.6 per 1 000 population in 2016.

Notes: In Finland, Iceland and Switzerland, about one-third of nurses are "associate professional" nurses with a lower level of qualifications. In Switzerland, most of the growth in the number of nurses since 2000 has been in this category of “associate professional” nurses. 1. Data include not only nurses providing care for patients, but also those working as managers, educators, etc. (adding another 8-10% on nurses on average). 2. Austria and Greece report only nurses employed in hospital (resulting in an under-estimation).3. Data in Chile refer to all nurses licensed to practice.
Source: OECD Health Statistics 2018, https://doi.org/10.1787/health-data-en.
In most countries, the growth in the number of doctors and nurses has been fuelled largely by growing numbers of domestic graduates who have entered these professions, although in some countries the immigration of foreign-trained doctors and nurses also played an important role (as discussed in section 1.4). For example, in the United States, 75% of the increase in the number of doctors between 2006 and 2016 came from domestic graduates from US medical schools (i.e. about 150 000 out of a total increase of 200 000 doctors), while the other 25% came from foreign-trained doctors (see Table 1.3 below). A growing number of these foreign-trained doctors were Americans who went to get a first medical degree abroad before coming back.
Overall, the number of medical graduates in OECD countries has increased from less than 100 000 per year in 2006 to over 125 000 in 2016, whereas the number of nurse graduates across OECD countries has increased from about 450 000 per year in 2006 to more than 600 000 in 2016 (see Annex 1.A for more country-specific information).
1.3. Foreign-born doctors and nurses have contributed significantly to the growing number of doctors and nurses in many OECD countries
Immigrant doctors and nurses have contributed significantly to the growth in the overall number of doctors and nurses over the past decade in many OECD countries. This section presents the most recent data on the number of foreign-born doctors and nurses working in OECD countries. It is important to keep in mind that many of these foreign-born doctors and nurses may have pursued their medical or nursing studies in their country of destination, not in their country of origin (because they moved with their family at a young age or because they pursued their university education in their country of destination). Box 1.1 provides a summary of the pros and cons of different approaches to monitor the international migration of health workers, along with the data sources used in this paper.
A regular monitoring of the international migration of health personnel needs to be based on two key criteria: 1) relevancy to both countries of origin and countries of destination; and 2) feasibility of regular data collection.
Approaches to measure migration patterns
Migration patterns can be measured based on nationality, place of birth, or place of education/training. The first approach, based on nationality, faces a number of shortcomings. Firstly, foreigners disappear from the statistics when they are naturalised. Secondly, in several OECD countries, many people who were born and raised in the country hold a different nationality, so there is therefore no systematic link between migration and nationality.
The second approach, based on the place of birth, is more meaningful because when the country of birth differs from the country of residence, it implies that the person did cross a border at some point in time. However, the main question that arises to evaluate the impact of highly skilled migration on origin countries is where the education took place. Some foreign-born people arrived at younger ages, most probably accompanying their family, while others came to the country to pursue their tertiary education and have stayed after completing their studies. In these cases, most of the cost of education will have been supported by the receiving country, and/or by migrants themselves, not by the country of origin.
The third approach, based on the place of education/training, is the most relevant from a policy perspective, although it does raise a number of measurement issues. One of these issues is that nursing and medical education and training can be very long and go through different stages. The definition used in the annual OECD/Eurostat/WHO-Europe Joint Questionnaire is based on where people have received their first medical or nursing degree. Another issue has to do with the internationalisation of medical education, which means that a certain number of foreign-trained doctors or nurses may be people who were born in a country and decided to pursue their studies in another country before returning to their home country. The Joint Questionnaire seeks to collect data on the number of such native-born but foreign-trained doctors and nurses.
Data sources
The description of the international mobility of health workers presented in this chapter is based on the second and third approaches (doctors and nurses born abroad, and doctors and nurses trained abroad). Two data sources were used to identify the country of birth: the latest round of population censuses and Labour Force Surveys (LFS) for some European countries. National censuses generally include all persons aged 15 years and older, while the LFS is restricted to persons between the ages of 15 and 64. Health workers are generally identified on the basis of the International Standard Classification of Occupations (ISCO), revised in 2008. Data collected cover "medical doctors" (221) and "nursing and midwifery professionals" (222) and "nursing and midwifery associate professionals" (322).
The data on foreign-trained doctors and nurses come from the annual OECD/Eurostat/WHO-Europe Joint Questionnaire that is administered to designated focal points in member countries. The main data source used by countries to supply these data are professional registries managed either by a professional organisation (e.g. a National Medical or Nursing Council) or by a government agency, although some countries have used other data sources.
To a certain degree, the share of migrants among health professionals mirrors that of immigrants – particularly those who are skilled – in the workforce as a whole. That being said, the percentage of foreign-born doctors tends to be greater than the percentage of immigrants among highly educated workers (Figure 1.3), whereas the share of foreign-born nurses is similar or lower (Figure 1.4).
The proportion of doctors born abroad ranges from less than 2% in the Slovak Republic to more than 50% in Australia and Luxembourg. With regard to nurses, the share of foreign-born is insignificant in the Czech Republic and the Slovak Republic, but over 30% in Switzerland, Australia and Israel. With the exceptions of a few countries, immigrants make up a higher proportion of doctors than of nurses, and markedly so in Luxembourg, Sweden, Switzerland and Australia.
Unsurprisingly, the proportions of foreign-born doctors and nurses are highest in the main settlement countries (e.g. Australia, Canada and Israel) and European countries like Luxembourg and Switzerland where large migrant flows head. Ireland and the United Kingdom are also near the top of the list for shares of foreign-born health professionals. Countries in Southern, Central and Eastern Europe have the lowest proportions of foreign-born health workers.

Note: The OECD average is the unweighted average for the 27 OECD countries presented in the chart. It differs slightly from the OECD total presented in Table 1.1 which is a weighted average of the 18 OECD countries for which data are available in 2000/01, 2010/11 and 2015/16.
Source: DIOC 2015/16, LFS 2015/16.

Note: The OECD average is the unweighted average for the 27 OECD countries presented in the chart. It differs slightly from the OECD total presented in Table 1.2 which is a weighted average of the 19 OECD countries for which data are available 2000/01, 2010/11 and 2015/16.
Source: DIOC 2015/16, LFS 2015/16.
In absolute terms, the United States remains the main country of destination for migrant doctors and nurses. Of all foreign-born health workers who practise in OECD countries, 42% of doctors and 45% of nurses practise in the United States (Figure 1.5). This is roughly equal to the share of all foreign-born highly-skilled people in OECD countries working in the United States (41%). The United Kingdom is the second country of destination for doctors, receiving 13% of all foreign-born doctors who practise in OECD countries, followed by Germany (11%). This ranking is reversed for nurses, with Germany in second place (15%) followed by the United Kingdom (11%).
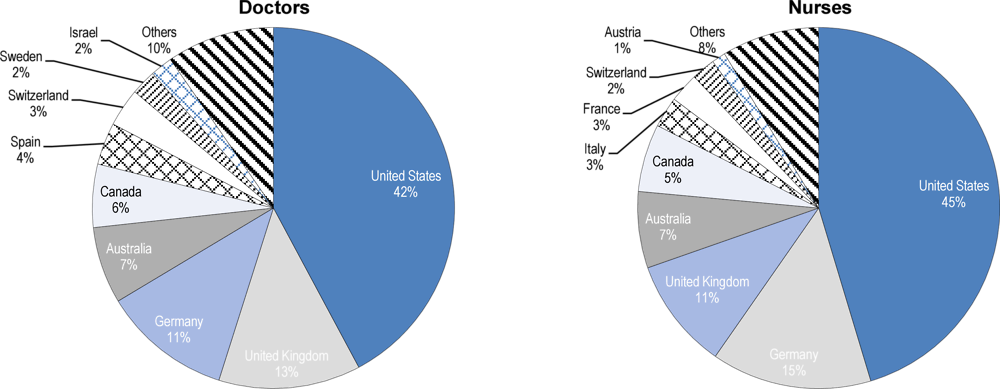
Source: DIOC 2015/16, LFS 2015/16.
Among the 18 OECD countries for which data are available and comparable over time, the number of foreign-born doctors rose by over 20% between 2010/11 and 2015/16, a much higher growth rate than the overall increase in the number of doctors of 10% (Table 1.1).3 As a result, the proportion of foreign-born doctors across these OECD countries rose by 3.1 percentage points to 27.2%. This growth is due to both migration dynamics and differences in age structures between foreign-born and native-born doctors and nurses, which affect their exits from the labour market via retirement.
Increases in the share of immigrant doctors were highest in Luxembourg (+15 percentage points), Switzerland (+6), Germany (+5), Canada (+4), the United States (+4) and Spain (+3). In terms of absolute numbers, the greatest swing in the number of foreign-born doctors came in the United States (+67 000) and Germany (+22 000), followed by Australia (+11 100), Canada (+11 000), Switzerland (+5 400) and Spain (+4 900). By way of comparison, the increase in the United Kingdom was a mere 3 000.
Some OECD countries, such as Greece and Italy, recorded declines in the number of foreign-born doctors between 2010/11 and 2015/16. The negative trend in Greece may be related to the government-debt crisis after 2010, which may have prompted foreign-born doctors to leave the country.
The overall trend for nurses is similar to that of doctors. The number of foreign-born nurses increased by 20% between 2010/11 and 2015/16 while the overall increase in nurses was about 10%, so the share of foreign-born nurses increased by an average of 1.5 percentage points to 16.2% (Table 1.2). The largest numerical increase was in the United States (+130 000), followed by Germany (+68 000) and Australia (+26 000). On the other hand, the number of foreign-born nurses decreased in some OECD countries.
In six out of fifteen OECD countries, more than half of the increase in the total number of doctors in recent years is attributable to immigration (Figure 1.6). For nurses, in half of the OECD countries for which data is available, more than a third of the increase in the total number of nurses came from people who were born in another country (Figure 1.7).

Source: DIOC 2010/11 and LFS 2009/12 for 2010/2011, DIOC 2015/16 and LFS 2015/16 for 2015/16.
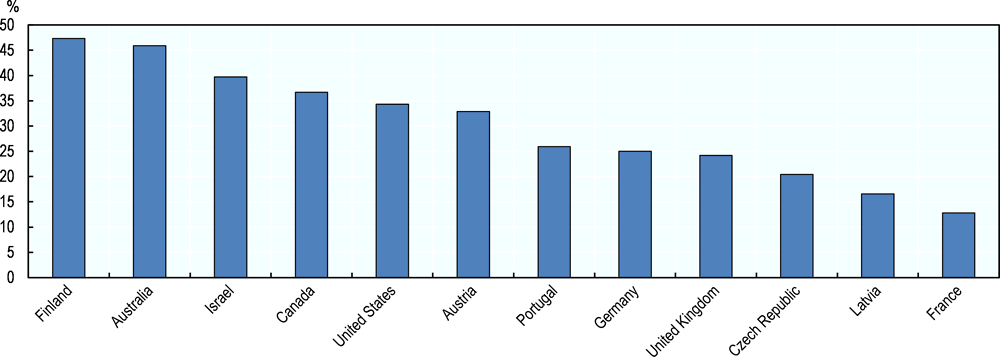
Source: DIOC 2010/11 and LFS 2009/12 for 2010/2011; DIOC 2015/16 and LFS 2015/16 for 2015/16.
1.4. Many OECD countries have also relied increasingly on foreign-trained doctors and nurses
In most OECD countries, the proportion of health workers trained abroad is lower than those born abroad, reflecting the fact that destination countries provide part of the education and training to migrants. For example, 40% of foreign-born doctors in Australia received their medical education there (according to 2016 census data).
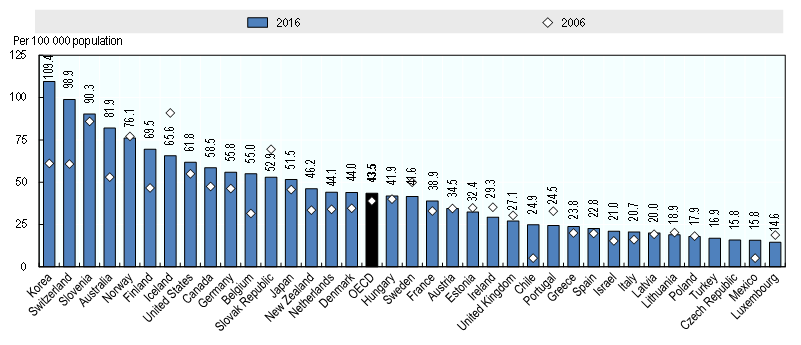
Overall, 16% of all doctors working in 26 OECD countries in 2016 had obtained at least their first medical degree in another country, that is, about 483 000 doctors (Table 1.3). This is up from 14% of all doctors in 2006 (or about 323 000) and 15% in 2011 (or about 424 000). The number and share of foreign-trained nurses has also increased in most OECD countries over the past decade (Table 1.4). However, it is important to keep in mind that not all of the foreign-trained doctors and nurses are foreigners, and that a large number in some countries (e.g. Chile, Israel, Norway, Sweden and the United States) are people born in the country who went to obtain at least a first medical degree abroad before coming back (see also Chapter 2).
Looking a bit more specifically at the trends in foreign-trained doctors in various parts of the OECD:
-
Outside Europe, the share of foreign-trained doctors has increased greatly in New Zealand and Australia between 2006 and 2011, but has started to decline in recent years as the number of domestically-trained doctors increased faster. In Canada, both the number and share of foreign-trained doctors have increased steadily, whereas the share has remained relatively stable in the United States as the number of foreign-trained doctors increased at the same rate as the domestically-trained. Among the medical graduates with a foreign degree who obtained a certification to practice in the United States in 2017, a third were American citizens, up from 17% in 2007 (see also Figure 2.3 in Chapter 2). Similarly, in Israel, a growing number of foreign-trained doctors are people born in Israel who went to study abroad: their number nearly doubled between 2006 and 2016, accounting for 40% of all foreign-trained doctors in 2016.
-
In Europe, the share of foreign-trained doctors has increased rapidly over the past decade in Ireland, Norway, Switzerland and Sweden, whereas it has decreased slightly in the United Kingdom as the number of domestically-trained doctors has increased slightly more rapidly. However, in Norway more than a half of foreign-trained doctors are in fact people who were born in the country and went to study abroad before returning. In Sweden, the number of foreign-trained natives quadrupled since 2006, accounting for nearly a fifth of foreign-trained doctors in 2015 (see also Figures 2.1 and 2.2 in Chapter 2). In Belgium, France and Germany, the number and share of foreign-trained doctors has also increased steadily over the past decade (with the share doubling from about 5 to 6% of all doctors in 2006 to 11 to 12% in 2016).
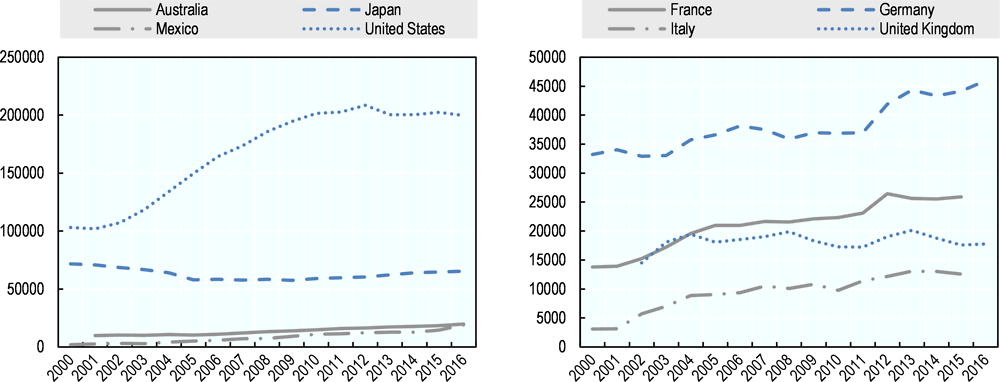
In absolute number, the United States had by far the highest number of foreign-trained doctors, with more than 215 000 initially trained abroad in 2016. Following the United States, the United Kingdom had more than 50 000 foreign-trained doctors in 2017. The main country of origin of these foreign-trained doctors in the United States and the United Kingdom is India, followed by Pakistan (see Annex 1.B).
The trends in foreign-trained nurses working in OECD countries are as follows:
-
Outside Europe, the number and share of foreign-trained nurses have increased steadily over the past decade in Australia, New Zealand, Canada and the United States. In Israel, the share of foreign-trained nurses has remained at around 10% (the fourth highest share among OECD countries), but one in four are in fact people born in the country who obtained their nursing degree abroad before coming back.
-
In Europe, the number and share of foreign-trained nurses has increased particularly rapidly in Switzerland (with most of them coming from neighbouring countries, mainly Germany and France, but also to a lesser extent from Italy; it also includes a growing number of foreign-trained but native-born). In Belgium, France and Germany, the number and share of foreign-trained nurses have also increased quite rapidly over the past decade. In Italy, the number of foreign-trained nurses increased sharply between 2007 and 2015 (driven mainly by the arrival of many nurses trained in Romania following Romania’s accession to the EU is 2007), but the number and share have started to decrease in recent years. Norway has a relatively high share of foreign-trained nurses (fifth highest among OECD countries), but more than one in eight were native-born in 2017.
In absolute number, the United States has by far the highest number of foreign-trained nurses, with an estimated number of almost 200 000 registered nurses (RNs) trained abroad in 2015. Following the United States is the United Kingdom with over 100 000 foreign-trained nurses in 2017 and Germany with 62 000 foreign-trained nurses in 2016.
1.5. Conclusions
While there continue to be concerns in many countries about growing shortages of health professionals, the number of doctors and nurses in absolute number and on a per capita basis has never been greater in most OECD countries. Since 2000, the number of doctors and nurses has grown more rapidly than the overall population in most countries, so both the doctor-to-population and nurse-to-population ratios have generally increased.
The growth in the number of doctors and nurses since 2000 has been driven mainly by growing numbers of domestically-trained doctors and nurses, as most OECD countries took actions to increase the number of students in medical and nursing education programmes in response to concerns about current or projected shortages. The United States provides a striking example of this growth: the number of medical graduates from American medical schools grew from 18 000 per year in 2000 to 24 000 in 2016, while the growth in the number of nurse graduates (as proxied by the number of new nurses receiving an authorisation to practice) doubled from 100 000 per year in 2000 to 200 000 in 2016.
At the same time, growing numbers of foreign-trained doctors and nurses have also contributed significantly to the rise in the number of doctors and nurses in several countries. Taking the example of the United States again, whereas about three quarters of the overall increase in the number of doctors between 2006 and 2016 came from domestic graduates, the other one quarter came from foreign-trained doctors (who accounted for about 50 000 new doctors out of a total increase of 200 000). However, a growing number of these foreign-trained doctors were Americans who went to study abroad before coming back.
Immigration contributed to the growing number of doctors and nurses particularly in the main settlement countries (e.g. Australia, Canada, the United States and Israel) and European countries where large number of immigrants go (e.g., Luxembourg and Switzerland). In several OECD countries for which data is available, more than half of the increase in the total number of doctors in recent years came from doctors who were born in another country. For nurses, the proportion is a bit smaller, but still in half of OECD countries for which data is available, more than a third of the increase in the number of nurses came from foreign-born nurses. It is important to keep in mind that many of these foreign-born doctors and nurses may have pursued their medical or nursing studies in their country of destination.
Focussing more on the place of medical or nursing education, the number and share of foreign-trained doctors and nurses have increased in most OECD countries over the past decade. One in six doctors working in OECD countries in 2016 had obtained at least their first medical degree in another country, up from one in seven in 2006. For nurses, one in fourteen had obtained their first nursing degree in another country in 2016, up from one in fifteen in 2011. However, it is important to bear in mind that not all these foreign-trained doctors and nurses are foreigners: a large and growing number of foreign-trained doctors and nurses in some countries (e.g. Israel, Norway, Sweden and the United States) are people born in the country who went to obtain a first medical degree abroad before coming back. In these cases, it is not appropriate to refer to this phenomenon as a “brain drain” as these students usually pay the full cost of their education while studying abroad.
References
[3] OECD (2016), “Trends and policies affecting the international migration of doctors and nurses to OECD countries”, in Health Workforce Policies in OECD Countries: Right Jobs, Right Skills, Right Places, OECD Publishing, https://doi.org/10.1787/97892.
[2] OECD (2015), “Changing patterns in the international migration of doctors and nurses to OECD countries”, in International Migration Outlook 2015, OECD Publishing, Paris, https://dx.doi.org/10.1787/migr_outlook-2015-6-en.
[1] OECD (2007), International Migration Outlook 2007, OECD Publishing, Paris, https://dx.doi.org/10.1787/migr_outlook-2007-en.
[4] WHO (2010), The WHO Global Code of Practice on the International Recruitment of Health Personnel, World Health Organization, http://www.who.int/hrh/migration.
The increase in the number of doctors and nurses in most OECD countries since 2000 has been driven mainly by an increase in domestic graduates from medical and nursing education programmes. This rise in the number of medical and nursing graduates reflects in most cases deliberate policy decisions that were taken a few years earlier to increase the number of students admitted in medical and nursing schools, in response to concerns about current or possible future shortages of doctors and nurses. In some countries like Ireland, Poland and other Central and Eastern European countries, the strong increase in recent years also reflects the growing number of international medical students and graduates.
In the United States, the number of medical graduates has steadily increased from about 18 000 in 2000 to 24 000 in 2016 (Annex Figure 1.A.1). The number has also gone up substantially in Mexico, rising from 9 200 in 2000 to 15 000 in 2016. In Japan, the increase has been more modest, from 7 500 in 2000 to 8 500 in 2016, but the government decision to increase student intakes in medical education in 2008 in response to current and projected shortages of doctors should result in growing numbers of medical graduates in the coming years.
In Europe, while the number of medical graduates has remained relatively stable in Germany and Italy between 2000 and 2016, it has gone up markedly in the United Kingdom and France. The number of medical graduates in the United Kingdom increased from 4 400 in 2000 to over 8 300 since 2010, whereas in France it increased rapidly in recent years following a decade of stability in the 2000s. This rise reflects the gradual increase in the numerus clausus in France since 2000 (see Chapter 3).
Overall, the number of medical graduates across OECD countries has increased from less than 100 000 in 2006 to over 125 000 in 2016 (Annex Table 1.A.1).

Source: OECD Health Statistics 2018, https://doi.org/10.1787/health-data-en.
Relative to the population in each country, the proportion of new medical graduates per capita in 2016 was highest in Ireland and Denmark (Annex Table 1.A.2), although the number of Denmark may be an over-estimation as it reflects doctors getting a new authorisation to practice and may therefore also include foreign-trained doctors. In Ireland, about 50% of medical graduates nowadays are international students; in most cases, these international students do not pursue their postgraduate training and work in Ireland afterwards (see Chapter 4).
The number of medical graduates relative to the population in 2016 was lowest in Japan and Israel. In Israel, the low number of domestic medical graduates is compensated by the high number of foreign-trained doctors, who increasingly are people born in Israel who went to pursue their studies abroad before coming back.

Note: In Denmark, Mexico, New Zealand and Sweden, the data refer to the number of new doctors receiving an authorisation to practice, which may result in an over-estimation if these include foreign-trained doctors. There are no medical graduates in Luxembourg (explaining why this country is not shown in this chart).
Source: OECD Health Statistics 2018, https://doi.org/10.1787/health-data-en.
The number of nursing graduates has also increased in most OECD countries since 2000, often reflecting deliberate policies to increase the number of students in nursing schools in response to concerns about current or possible future shortages of nurses (Annex Table 1.A.3 and Annex Table 1.A.2).
In the United States, the number of nursing graduates (as proxied by the number of new nurses receiving an authorisation to practice) doubled between 2000 and 2010, rising from 100 000 per year to 200 000, but it has stabilised since then at around 200 000 per year. The number of nurse graduates has also doubled in Australia, increasing from less than 10 000 in 2000 to nearly 20 000 in 2016. By contrast, the number of nurse graduates decreased in Japan between 2000 and 2010, but it has started to increase since 2010. In Europe, the number of nurse graduates has increased fairly steadily in Germany, France and Italy since 2000. In the United Kingdom, it has levelled off since the mid-2000s and even decreased slightly in 2015 and 2016, before starting to rise again in recent years.
Overall, the number of nurse graduates across OECD countries has increased from about 450 000 in 2006 to more than 600 000 in 2016 (Annex Table 1.A.2).
Note: In the United Kingdom and the United States, the data are based on the number of new nurses receiving an authorisation to practice, which result in an over-estimation as these may include foreign-trained nurses.
Source: OECD Health Statistics 2018, https://doi.org/10.1787/health-data-en.
In proportion to the population size in each country, the number of new nurse graduates per capita was highest in 2016 in Korea and Switzerland, whereas it was lowest in Luxembourg, Mexico and Czech Republic (Annex Figure 1.A.4).
Note: In Mexico, the data refer to professional nursing graduates only. In Denmark, Israel, Sweden, the United Kingdom and the United States, the data are based on the number of new nurses receiving an authorisation to practice; this may result in an over-estimation if these include foreign-trained nurses. The data for Turkey refer to 2017.
Source: OECD Health Statistics 2018, https://doi.org/10.1787/health-data-en.
In 2016, several OECD countries reported that they had raised admission rates in medical and nursing schools over the previous four years (Annex Table 1.A.3), so the number of medical and nursing graduates can be expected to continue to increase in these countries in the coming years.
The United States and the United Kingdom are the two main countries of destination of foreign-trained doctors working in OECD countries, with over 215 000 foreign-trained doctors working in the United States in 2016 and more than 50 000 working in the United Kingdom in 2017. Annex Figure 1.B.1 shows that the main country of origin of foreign-trained doctors working in these two countries was by far India, followed by Pakistan.
In the United States, more than one-fifth (21%) of foreign-trained doctors in 2016 came from India, with doctors trained in Pakistan and the Philippines following (with a share of 6% and 5% respectively). Many foreign-trained doctors in the United States were also trained in the Caribbean Islands (notably in Grenada and Dominica), but in many cases these are American students who went to study abroad and then came back to the United States to complete their postgraduate training and work. A large number of foreign-trained doctors also came from neighbouring countries (Mexico and Canada).
In the United Kingdom, nearly one-third (32%) of foreign-trained doctors in 2017 came from India, followed by Pakistan (11%). Many foreign-trained doctors also came from African countries (e.g. Nigeria, Egypt and South Africa). A significant number of foreign-trained doctors in the United Kingdom also came from other EU countries (e.g. Ireland, Greece, Germany, Italy, Romania and Poland).
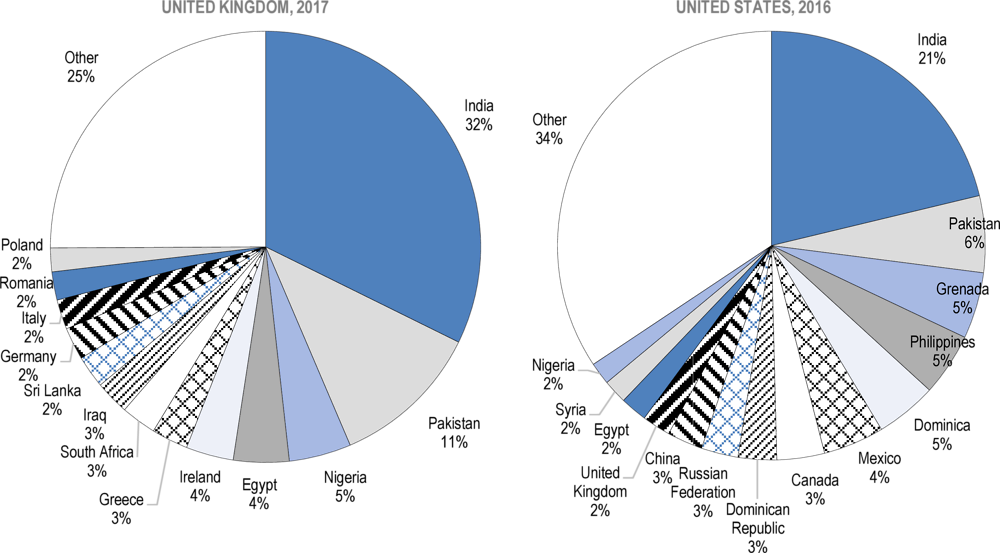
Source: OECD Health Statistics 2018.
Notes
← 1. “The Looming Crisis in the Health Workforce: How Can OECD Countries Respond?” was the title of an OECD publication in 2008 that called for greater efforts from OECD countries to train more doctors and nurses, as well as to improve retention rates and delay the retirement of existing health workers, to respond to growing demand for health care arising from population ageing.
← 2. It is important to bear in mind, however, that the number of doctors in Greece and Portugal is over-estimated as it includes all doctors who are licensed to practice but may no longer be practising because some of them might have emigrated, be unemployed or retired.
← 3. This increase is roughly equal to the growth in the number of highly-skilled immigrants in OECD countries during that period.