copy the linklink copied!Chapter 5. Education funding: Policy priorities and trends, 2008-19
This chapter identifies developments in policy priorities related to education funding between 2008 and 2019, both from the perspective of participating education systems in OECD member countries and non-member economies, and previous OECD country-based work. Such policy priorities, often shared by different education systems, include: increasing or maintaining educational expenditure; improving efficiency in the use of resources; refining criteria and mechanisms used to allocate funding; and revising funding sources.
Taking a comparative approach, this chapter also analyses policy trends identified for education governance between 2008 and 2019, providing evidence of progress or impact for a selection of policies.
The statistical data for Israel are supplied by and under the responsibility of the relevant Israeli authorities. The use of such data by the OECD is without prejudice to the status of the Golan Heights, East Jerusalem and Israeli settlements in the West Bank under the terms of international law.
copy the linklink copied!Highlights
-
This chapter analyses policy priorities and trends in education funding across participating education systems in terms of the overall amount of financial resources that countries invest in education systems and at educational levels; sources of funding for education, considering the distribution of funding across public and private sources; and the use of financial resources both at system and institutional levels.
-
The most frequently observed funding-related policy priorities between 2008 and 2019 were: increasing or maintaining educational expenditure (identified in 24 education systems); improving efficiency in the use of resources (identified in 23 education systems) and improving equity in resource allocation (also identified in 23 education systems). Other priorities identified were: revising the sources of funding for educational institutions (identified in 16 education systems); refining the mechanisms used to allocate funding to schools and other educational institutions (identified in 15 education systems); and tackling shortages in human and material resources in schools (identified in 12 education systems).
-
The most frequently observed funding-related policy trends between 2008 and 2019 were on policies to: invest in early childhood education and care (ECEC), primary and secondary education; use performance-based and needs-based funding formulas in higher education; better use time, human and material resources; explore public financial aid for students; allocate targeted support to population sub-groups; and seek greater involvement from the private sector or student tuition fees.
copy the linklink copied!Setting the scene
Education funding policies, as defined in this chapter, refer to the investment of different kinds of resources in schools and educational institutions, as well as to how effectively and efficiently resources are used to ensure quality and equity in education. In recent years, OECD countries have placed increased attention on the mechanisms that govern, distribute and monitor funding for education, so as to ensure that resources go where they can most impact teaching and learning outcomes (OECD, 2017[1]; OECD, 2015[2]).
The overall level of funding in an education system matters for student learning, but only up to a certain point. For example, at the school level, evidence collected through the Programme for International Student Assessment (PISA) shows that once funding reaches a certain threshold, it is how it is allocated between schools, and how resources are used within schools, that become more important.
PISA 2015 data show that a strong positive correlation exists, on average, between the level of funding in a school system and learning outcomes for students aged 15, among countries whose cumulative expenditure per student is under USD 50 000 (OECD, 2016[3]). However, among countries that spend more than USD 50 000 per student, as is the case in most OECD countries, the positive correlation between funding per student and learning outcomes is no longer observed. In other words, adequate funding for schools and educational institutions is a necessary prerequisite for high educational performance, but the highest spending education systems are not guaranteed to be the top-performing. Furthermore, differences in the level of funding in education explain only about 25% of the variance in average student performance in science in PISA 2015 among OECD countries. The remaining 75% is explained by other factors, including public policy decisions.
Equitable approaches to funding appear to have a positive impact on student outcomes, in general: on average across OECD countries in PISA 2015, education systems that allocate educational resources more equitably performed higher in PISA than systems with lower levels of equitable funding (OECD, 2016[3]). Policies that help allocate resources more equitably across socio-economically advantaged and disadvantaged schools can include ensuring that pre-primary and tertiary education (which in many countries require more private funds from families) remain affordable for all students and families. Another example would be employing funding formulae or mechanisms that take into consideration schools’ socio-economic profiles (OECD, 2012[4]).
However, funding allocations involve making informed choices in the face of various possible priorities. The division of funding across education levels (ECEC, primary, secondary or higher education) is an obvious example, or assigning investment across different inputs such as human resources (e.g. salaries for teachers and other staff) or material resources and infrastructure. In this regard, public funding instruments can help greatly to improve transparency and counter individuals’ or employers’ tendencies to underinvest in skills development (OECD, 2012[5]).
The Education Policy Outlook Analytical Framework analyses education funding by looking at three specific areas: the financial resources invested in education (measured, for example, in terms of public expenditure per student, by educational level); the sources of funding (i.e. the relative weight of both governmental and private sources); and the use of resources (including human, material and time resources) (Figure 5.1).

Source: OECD (2015[2]), Education Policy Outlook 2015: Making Reforms Happen, OECD Publishing, Paris, https://doi.org/10.1787/9789264225442-en.
With this framework as a basis, this chapter provides a comparative overview of the evolution of policy priorities related to education funding as identified by the OECD in previous country-based work and as reported by participating education systems at different points between 2008 and 2019.
General principles of action, as identified by the OECD to support countries in tackling these priorities, are then explored.
The chapter also analyses policy trends in over 100 education policy developments undertaken mainly during 2008-19. Over half of the policies collected have been in place since at least 2014, offering evidence of progress or impact in most cases. Throughout this chapter, evidence of progress or impact is included, in order to assist the reader in analysing factors relevant to the implementation of these policies (also see Chapter 1 and the Reader’s Guide).
All of the policy reforms relating to education funding and collected by the OECD are listed in the policy trends tables included in this chapter; more detailed descriptions of each of these policies and, where possible, their progress or impact, can be found in Chapter 8.
copy the linklink copied!Financial resources
Higher overall levels of funding can make it more likely that all schools in the education system will have the resources they need, but the strategies and mechanisms used to allocate funding are also important. Given that the financial resources available for education systems are limited, using these resources efficiently is crucial (OECD, 2017[1]).
How much a country spends on education depends partly on its wealth: countries with a higher gross domestic product (GDP) per capita tend to have greater levels of expenditure per student (Figure 5.2). This is true for expenditure at all levels of education, but the relationship between GDP per capita and education spending is strongest at the primary, secondary and post-secondary levels (hereafter, non-tertiary) (R2=0.56) than at the tertiary level (R2= 0.43).
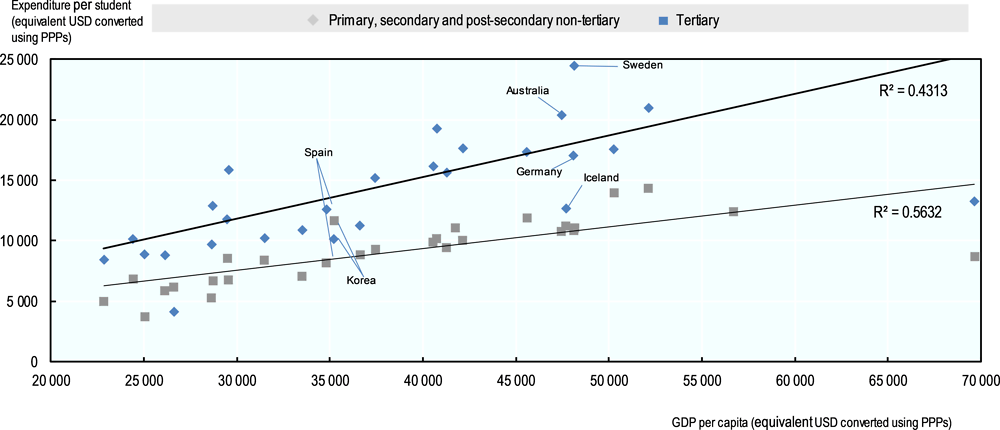
Source: Based on data from OECD (2018[6]), Education at a Glance 2018: OECD Indicators, OECD Publishing, Paris, https://doi.org/10.1787/eag-2018-en.
Also, at all levels of education, there are some countries with similar GDP per capita that nevertheless present very different levels of education spending. For example, Korea and Spain present a similar level of GDP per capita (around USD 35 000), but Korea invests significantly more per student than Spain in non-tertiary education and significantly less than Spain in tertiary education. Similarly, Australia, Germany, Iceland and Sweden have similar levels of GDP per capita (around USD 48 000); however, their spending per student in tertiary education differs significantly: it is higher in Australia and Sweden and lower in Germany and Iceland. These findings suggest that regardless of their level of economic development, there is a lot that countries can do to control how much they spend in education.
In the same way, as mentioned above, although countries may face limitations on how they allocate resources, depending on their specific governance arrangements, they can make policy decisions to optimise resources so that they reach where they are most needed. It is possible to achieve and sustain improved outcomes for students, without having a high level of resources: Colombia and Portugal are examples of education systems that have achieved this (OECD, 2018[7]).
Policy priorities
Increasing or maintaining educational expenditure
A common policy priority related to education funding refers to increasing or maintaining educational expenditure. The desire among education systems to expand access to educational opportunities and to improve the quality of education can translate into higher costs per student (OECD, 2018[6]). Between 2008 and 2019, this policy priority was identified in at least 24 education systems, either by the OECD in previous country-based work (20 education systems), by participating education systems (9 education systems), or both (5 education systems) (Figure 5.3).
Previous OECD work identified this policy priority for at least 15 education systems, including Latvia, the Slovak Republic and the United Kingdom (England), between 2015 and 2019. The OECD identified it as a priority for four other education systems (Japan, Korea, Slovenia and Turkey) in 2008-14. For Mexico, the OECD identified this priority both before and after 2014.
To address this policy priority, general principles of action as proposed by the OECD to participating education systems include introducing new funding at early educational levels (ECEC and primary) or re-orienting funding from secondary and post-secondary to focus on these earlier levels. This follows empirical evidence that the highest returns to education are seen in the earliest years. Another general principle of action seen in OECD work regards increasing investment in vocational education and training (VET) and higher education. This is generally to increase participation rates and improve transitions from education to work.
In terms of increasing investment in education in general, Chile and Colombia are examples of education systems for whom the OECD identified a need to raise educational expenditure to improve school quality, given that the level of spending per student was lower than the OECD average (OECD, 2015[8]; OECD, 2017[9]). In Estonia, the OECD found that more investment in pre-primary education was necessary to raise staff salaries and the overall quality of education at this level (Santiago et al., 2016[10]). In Germany and Hungary, the OECD recommended increasing funding in higher education in order to improve access to, and quality of, tertiary education (OECD, 2012[11]) (OECD, 2016[12]).

Notes:
1. Priority according to the OECD: See Annex A (OECD publications consulted) and Reader’s Guide (years covered).
2. Principles of action: Component of a recommendation that draws from international evidence produced on a specific topic, either by the OECD or externally.
3. Priority according to participating education system: Based on responses to Education Policy Outlook (EPO) Surveys 2013 and 2016-17, although responses for Austria, Belgium (Flemish, French and German-speaking Communities), Italy, Kazakhstan, Spain and Sweden are based on the EPO Country Profiles published during 2017 and 2018. Responses given during the validation processes for all education systems in 2019 are also included (see the Reader’s Guide).
4. Comparing previous OECD analysis and country responses: Education systems highlighted in bold are those where the policy priority was identified by both the OECD and the education system.
Figure 5.3 also shows that nine education systems reported increasing or maintaining educational expenditure as a policy priority between 2008 and 2019. For five of these education systems, Austria, Belgium (Flemish Community), the Czech Republic, Germany and Mexico, this can be classed as an emerging priority having first been reported in 2015-19. The remaining four education systems first reported this as a priority in 2008-14. In tackling this emerging priority, Austria introduced a one-off levy on banks in 2016 for a four-year period to create an overall fund of EUR 1 billion entirely dedicated to education projects such as the expansion of all-day schools, establishing a foundation for innovation and research in education, and creating new student places at Universities of Applied Sciences.
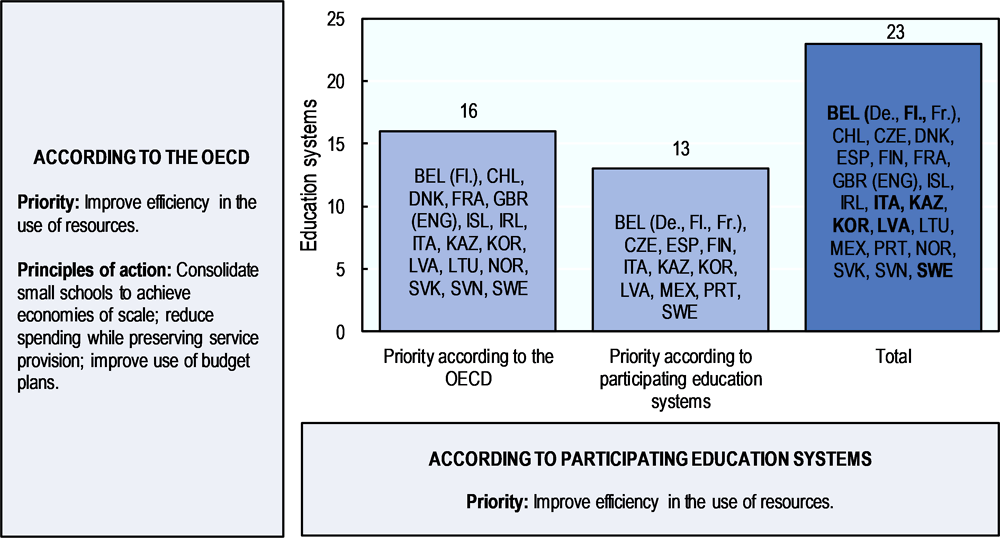
Improving efficiency in the use of resources
As the majority of education funding comes from public budgets, improving efficiency, both in economic and educational terms, is a key concern for policy makers. Between 2008 and 2019, this policy priority was identified in at least 23 education systems, either by the OECD in previous country-based work (16 education systems), by participating education systems (13 education systems), or both (6 education systems) (Figure 5.4).
Notes:
1. Priority according to the OECD: See Annex A (OECD publications consulted) and Reader’s Guide (years covered).
2. Principles of action: Component of a recommendation that draws from international evidence produced on a specific topic, either by the OECD or externally.
3. Priority according to participating education system: Based on responses to Education Policy Outlook (EPO) Surveys 2013 and 2016-17, although responses for Austria, Belgium (Flemish, French and German-speaking Communities), Italy, Kazakhstan, Spain and Sweden are based on the EPO Country Profiles published during 2017 and 2018. Responses given during the validation processes for all education systems in 2019 are also included (see the Reader’s Guide).
4. Comparing previous OECD analysis and country responses: Education systems highlighted in bold are those where the policy priority was identified by both the OECD and the education system.
The OECD has identified improving efficiency in the use of resources as a policy priority for at least 16 education systems since 2008. For 13 of those education systems, including Denmark, Korea, and Sweden, this policy priority was identified between 2015 and 2019, while for 2 education systems it was first identified between 2008 and 2014. The OECD identified this as a priority for Iceland and Slovenia both before and after 2014.
In supporting education systems to address this policy priority, the OECD has proposed general principles of action focused on rationalising school networks. This is generally recommended through the consolidation of small schools to achieve economies of scale. Other principles of action regarding efficiency in educational spending evident in OECD work include reducing spending while preserving quality service provision and better use of budget plans. As with all principles of action, the context of implementation must also be taken into account.
France and the Slovak Republic are examples of education systems for which the OECD recommended merging small schools or classes in order to increase efficiency (OECD, 2015[13]; Santiago et al., 2016[14]). In Belgium, the OECD recommended reducing spending while preserving service provision, specifically by, for example, eliminating the option for teachers to stop working, while retaining most of their salary, before qualifying for early retirement (mise en disponibilité) (OECD, 2015[15]). In Kazakhstan, the OECD recommended improving efficiency by enhancing analytical capacity within the governance structures for education funding, specifically in terms of budgeting, accounting, budget monitoring and supervision (OECD/The World Bank, 2015[16]).
Some 13 education systems reported improving efficiency in the use of resources to the OECD as a policy priority. For five education systems, including Kazakhstan, Spain and Sweden, this is an emerging priority, having been reported for the first time between 2015 and 2019. However, 8 education systems including Belgium (French and Flemish Communities), the Czech Republic and Latvia first reported this as a priority in 2008-14.
In Greece in 2011, the Ministry of Education undertook a mapping of schools across the country to identify and facilitate mergers and consolidation within the network, particularly in the context of the specific geographic conditions of the country. With some guidance from the OECD, Kazakhstan implemented a new funding model in 2018 in order to help make school funding more transparent, efficient and equitable (OECD, 2018[17]). In Spain, financial constraints created by the economic crisis led to a 2012 decree introducing lower growth in salaries for primary and secondary school teachers, increases in teaching hours per teacher and relaxation of class size restrictions. These measures have recently been repealed (Ley 4/2019).
Refining the criteria and mechanisms used to allocate funding to educational institutions
Another policy priority related to education funding which is relevant for several education systems refers to refining the criteria and mechanisms used to allocate funding to educational institutions. This includes questions about how allocations are determined, distributed and by who, as well as how to ensure mechanisms and criteria remain optimal over time (OECD, 2017[1]). Between 2008 and 2019, this policy priority was identified in at least 15 education systems, either by the OECD in previous country-based work (11 education systems) or by participating education systems (4 education systems). There are no examples where this priority was identified by both (Figure 5.5).
The OECD identified this as a policy priority for at least 11 education systems. For eight education systems, including Austria, Colombia and Norway, this policy priority was first identified between 2015 and 2019. The OECD identified it as a priority for two education systems, Australia and Ireland in 2008-14 and for Slovenia both before and after 2014.
General principles of action recommended by the OECD in response to the policy priority of refining funding allocation mechanisms include the use of funding formulae that consider multiple factors. Additionally, depending on the context of implementation, formulae that allocate more funding based on performance-based factors are required in some countries, whereas, in others, it may be more appropriate to attribute more weight to needs-based factors.
In Austria, the OECD recommended introducing needs-based funding formulae for the distribution of teaching and other resources in schools, in order to address the lack of transparency in the system (Nusche et al., 2016[18]). In contrast, Colombia and Ireland are examples of education systems for which the OECD recommended that a larger share of resources for higher education institutions be distributed based on key performance indicators (OECD, 2016[19]; OECD, 2013[20]).

Notes:
1. Priority according to the OECD: See Annex A (OECD publications consulted) and Reader’s Guide (years covered).
2. Principles of action: Component of a recommendation that draws from international evidence produced on a specific topic, either by the OECD or externally.
3. Priority according to participating education system: Based on responses to Education Policy Outlook (EPO) Surveys 2013 and 2016-17, although responses for Austria, Belgium (Flemish, French and German-speaking Communities), Italy, Kazakhstan, Spain and Sweden are based on the EPO Country Profiles published during 2017 and 2018. Responses given during the validation processes for all education systems in 2019 are also included (see the Reader’s Guide).
4. Comparing previous OECD analysis and country responses: Education systems highlighted in bold are those where the policy priority was identified by both the OECD and the education system.
Figure 5.5 also shows that four education systems reported refining the criteria and mechanisms used to allocate funding to educational institutions as a policy priority. Belgium (French Community) and Mexico first reported this as a priority in 2015-19 whereas Latvia and Hungary first reported it in 2008-14. In response, Latvia introduced a new funding model for tertiary education in 2015 which combines the core funds with a performance-oriented funding pillar and an innovation-oriented funding pillar. Also, in 2015, Mexico established a national fund regarding the teachers’ payroll and operative expenditure to better direct funding to the most disadvantaged regions.
Policy trends
The policy changes in the area of financial resources reported to the OECD during 2008-19 show two key trends, as presented in Table 5.1. The first trend relates to a group of policies that place a particular focus on funding early educational levels, especially early childhood education and primary education. The second identifiable trend groups policies focused on higher education, emphasising not only the level of funding, but also the mechanisms used to allocate funding at this level. In particular, there is growing evidence of performance-based funding being used to incentivise better performance among universities and other higher education institutions.
The evidence collected on the progress or impact of policies collected for this report highlights the importance of aligning policies related to financial resources with clear guiding objectives at the system level, particularly in decentralised systems. In Ireland, for example, a major challenge in the introduction of performance budgeting for higher education institutions lay in ensuring institutions have sufficient flexibility to respond to local needs while also having specific priorities set at the system level. Similarly, evidence collected on the implementation of extra investments for teacher training made as part of Denmark’s Folkeskole reform shows that achieving coherence across municipalities was among the key challenges identified.
Furthermore, the longest-standing reforms to financial resources are those that have been able to reflect evolving education ecosystems by adapting those objectives over time. New Zealand’s Performance-Based Research Fund (2003) was modified between 2015 and 2018 to clarify and simplify objectives and processes and an independent review launched in 2019 is further investigating how to update the fund to ensure that it best supports the evolving environment of research and tertiary education.
Investing in early childhood education and care, primary and secondary education
With more than 20 policies collected in this group, the majority of which have been introduced since 2015, investing in early childhood education and care, primary and secondary education appears to be an area of policy work receiving increasing attention across participating education systems. Looking more closely at the type of policies introduced within this group, improving access to, and quality of, early childhood education and care through increasing funding has clearly been a key focus for several education systems.
Germany, for example, has repeatedly worked to expand and strengthen its ECEC system since 2008 with four large-scale investment programmes. Ireland has recently invested public funds in expanding support to families for childcare, as well as increasing the subsidies for childcare providers through the Affordable Childcare Scheme (2019). Japan introduced free ECEC from 2014 to ensure that all children, regardless of their family’s financial situation, have the opportunity to receive high-quality pre-school education.
Other countries have developed more general investment programmes targeted at early stages of education, including both ECEC and primary school. For example, the German-speaking Community of Belgium passed a decree, in 2014, to increase the amount of per-student funding for children in kindergarten and primary school.
In some countries, funding has been re-oriented from higher levels of education towards earlier levels in order to improve efficiency in spending. For example, in the Slovak Republic, a fall in the student population, particularly acute at the secondary level, led to a policy of optimisation from 2016. The resulting efficiency gains have been redirected to improve access to ECEC, particularly for children from low-income backgrounds.
Other countries have focused on specific funding policies for primary and secondary education. In Chile, a special fund to support public education was created in 2014. This aims to tackle the education budget deficit faced by many municipalities by contributing substantial funds for the costs incurred by municipalities in providing and administering public education services at primary and secondary levels. In Estonia, a national investment programme to support the consolidation of the upper secondary school network for general education was created in 2014.
Policy focus
-
Since 2008, Germany has launched four investment programmes to support the expansion (investment and operating costs) of ECEC services throughout the country. The federal government provided EUR 3.28 billion in the first three investment programmes for the expansion of ECEC places for under 3-year-olds (BMFSFJ, 2019[21]). The fourth investment programme (2017-20) aims to support the increase of up to 100 000 additional ECEC places for 3-year-olds with an allocation of EUR 1 126 billion (BMFSFJ, 2017[22]). The federal government supports the Länder by granting them tax releases (valued-added tax [VAT]) to subsidise the operating costs of services for children under the age of three. In addition, in 2019, a new law on ECEC quality (Gutes-Kita-Gesetz) took effect with a total budget allocation of EUR 5.5 billion from 2019 to 2022 (BMFSFJ, 2019[23]).
Progress or impact: Within the first three investment programmes, from 2008 to 2018, 400 000 additional places for children under three were created (BMFSFJ, 2019[21]) As of 2018, it was put forward that in early childhood education and care, unsatisfied demand and demographic changes necessitate more than 600 000 additional places until 2025 for children up to school age (European Commission, 2018[24]). Issues persist around service quality and flexibility (European Commission, 2018[24]). The federal and Länder governments have taken further initiatives to improve access to and quality of early childhood education and childcare, such as with the programme “Entry into ECEC – Building bridges to early education” (KitaEinstieg – Brücken bauen in Frühe Bildung), the programme “KitaPlus” or “child care centres with a focus on language education and development” (Sprach-Kitas). The government has also supported improving the qualifications of daycare staff. The federal government and the Länder have also taken stock of progress in improving quality and identified further steps to be taken (OECD, 2018[25]).
-
Under Japan’s Second Basic Plan for the Promotion of Education (2013-17), access to free and universal early childhood education and care for all children (2014) became a priority to ensure that all children, regardless of their family’s financial situation, are able to receive high-quality pre-school education. The policy’s objectives included the elimination of tuition fees and incremental provision of free early childhood education to 5-year-olds as of 2014. Also, the plan aimed to provide free early childhood education at kindergarten for children whose parents are welfare recipients, alleviate financial obligations for large families starting in 2014, and increase financial support for children whose parents qualify for municipal tax exemption starting in 2015 (OECD, 2015[26]).
Progress or impact: As of 2014-15, Japan eliminated childcare costs for families who receive social benefits (approximately JPY 6 600 per month) as well as those under an annual income limit (approximately JPY 6.8 million) for the tax breaks of half-price fees for a second-born child and free tuition for any children after the second one. In 2015-16, the cost of childcare for families exempt from their municipality’ residence tax decreased from JPY 9 100 to 3 000. In 2016-17, families with a total annual income below JPY 3.6 million began paying half-price for childcare for the second child and received free childcare for three or more children. During the same year, tuition was no longer required for children with single parents exempt from residence tax. In addition, single-parent families with income under JPY 3.6 million began paying half-price for their first child and received free childcare for all future children. Finally, in 2017, the government planned to eliminate tuition for second-born children and any additional children of families exempt from residence tax. Single-parent households with annual income below JPY 3.6 million would benefit from reduced monthly costs for the first child from JPY 7 550 to JPY 3 000. Similarly, the costs for the first child would be reduced from JPY 16 100 to JPY 14 000 for two-parent households with a similar income (OECD, 2018[27]).
Performance-based and needs-based funding in higher education
In higher education, a key identifiable policy trend is the introduction of performance-based funding. A variety of performance-based funding mechanisms now exist across participating education systems. Some countries are increasing the percentage of public funding that is based on institutional performance indicators, for example. This is the case in policies such as Austria’s Goal-Oriented Budgeting implemented from 2013, Hungary’s Decree on the Financing of the Basic Activities of Higher Education Institutions (HEIs) (2016), Italy’s Operating Fund (2010) and Latvia’s new funding model for higher education (2015). Some of the performance indicators employed within these new funding mechanisms include: graduation rates (or graduation within nominal time); the share of graduates who are employed or that continue into masters or doctorate programmes; research outcomes; and the proportion of international students attracted to the institution. In some education systems, the evaluation of institutional performance takes into account a range of such performance indicators. This can be seen in the modifications to New Zealand’s Performance-Based Research Fund in 2008 and 2015, and the funding regime introduced within Slovenia’s Higher Education Act (2016).
Another form of performance-based funding is the use of competitive tenders. This approach sees higher education institutions compete for funds through developing proposals for institutional improvement, the best of which are selected to receive financial support. Chile’s Programme to Improve the Quality of Higher Education (2008) is an example of this approach, as is Ireland’s Innovation and Transformation Fund (2018).
Introducing or enhancing performance-based funding usually involves reducing the share of “basic funding”. This refers to public funding allocated to higher education institutions based on structural characteristics such as institutional size (number of students or academic staff). However, some countries have introduced changes in the opposite direction, increasing baseline funding at the sake of performance-based funding. This is generally done to provide more stability of resources for institutions. In Estonia, a new funding model for the higher education system, introduced in 2018, shifted funding from being primarily performance-based to a combination of 80% baseline and 20% performance funding.
Policy focus
-
Ireland’s Higher Education Authority (HEA) has been introducing performance budgeting since 2013. The first System Performance Framework (2014), which was part of the National Strategy for Higher Education, introduced a strategic dialogue process between HEIs and the HEA by which a performance compact is produced. This ensures that HEIs engage with national strategic objectives while maintaining institutional autonomy. Accountability has also been strengthened: the HEA has a monitoring role across the system, HEIs must produce annual compliance statements and progress is ongoing through strategic dialogue. (Higher Education Authority, 2017[28]). The 2017 OECD and EU Country Review of Entrepreneurship in Higher Education fed into the development of a new System Performance Framework for higher education (2017-21) with a stronger focus on research, development and innovation.
Progress or impact: By 2017, the Higher Education Authority finished the compact-agreement phase and two reviews of progress cycles. Though the HEA had expected resistance, a great number of HEIs had set very ambitious goals by 2017, despite a decline in funding and growing student numbers. However, it was found that some HEIs did not have clear strategic planning processes to meet the new expectations. Furthermore, many HEIs under-performed in priority setting. A major challenge lay in having specific priorities set at the system level, while at the same time ensuring that multiple sets of responses could be taken to implement these priorities. Despite these ongoing challenges, only three institutions did not fulfil the goals and so had their funding held back. All three then secured funding after revising and resubmitting the compact (HEA, 2017[29]).
-
New Zealand’s Performance-Based Research Fund (PBRF, 2003) encourages and rewards excellent research in New Zealand’s degree-granting organisations. It does not directly fund research but supports it through assessing the research performance of organisations, as well as funding them based on the assessment results. The PBRF is the primary form of government funding for general research capability in higher education institutions and contributes to the government’s wider science, research and innovation objectives by supporting research activities that provide social, economic, cultural and environmental benefits to the country, including the advancement of mātauranga Māori.
Progress or impact: A 2012 review indicated that the Performance-Based Research Fund has contributed to an increase in the research performance and productivity of tertiary education organisations (TEOs) and has gained positive recognition internationally. Following this, New Zealand introduced changes to increase its efficiency and effectiveness. The 2013 PBRF assessment analysed survey responses from current students and recent graduates about teaching and supervision practices during 2003-11 and found that the introduction of the PBRF did not hurt teaching quality (Smart, 2013[30]). Between 2015 and 2018, the government committed to adopting further changes to make fund objectives clearer, simplify the quality evaluations, improve reporting on research performance and place more value on user perspectives of research quality and user-oriented research.
An independent review of the PBRF will commence in 2019 to refresh the programme so that it better supports the evolving environment of research and tertiary education. Interim results for the most recent quality evaluation show that the number of researchers awarded with a funded Quality Category has increased by 66.2% between 2003 and 2018. The number of awards given by the Pacific Research Panel to the top two categories is in line with the national average and, for the Māori Knowledge and Development Panel, it is well above the national average (Tertiary Education Commission, 2019[31]).
copy the linklink copied!Sources of educational funding
Sources of educational funding refer to how much investment in education comes from public sources and how much from private sources. Public sources include governmental funds that may be sourced centrally or at the various decentralised levels of governance. Private funds include international sources of funding, financial support from employers and individual contributions from households.
Different trends apply at different educational levels. Public funds constitute by far the main source of funding for education systems across OECD countries at primary, secondary and post-secondary non-tertiary levels. On average, in 2015, public sources accounted for 91% of all expenditure on non-tertiary educational institutions. There is very little cross-national variation in this measure: only in Australia, Chile, Mexico, New Zealand and Turkey does the share of spending in non-tertiary education come from private sources larger than 15%, and only in Colombia does it exceed 20% (OECD, 2018[6]). In Colombia, fee-paying, independent private schools account for a significant proportion of school enrolments, and so almost all of the private financing at these levels of education is sourced from households (Radinger et al., 2018[32]).
In comparison, at pre-primary level, private funds account for a larger share of expenditure: on average across OECD countries, 17% of expenditure on pre-primary education comes from public sources (OECD, 2018[6]). In a small number of countries, the share of privately sourced funding is much higher. Nevertheless, in those cases where a significant proportion of private expenditure is sourced from fees to parents, there is evidence of a growing trend to increase and expand the targeted public subsidies transferred to households. Alternatively, some countries are gradually expanding their commitment to tuition-free pre-primary education by guaranteeing free access for specific age groups or durations (OECD, 2017[33]).
The role of privately sourced funds is most significant in tertiary education, although even at this level, it is still rarely the main funding source (Figure 5.6). On average across OECD countries, 31% of expenditure on tertiary educational institutions comes from private sources, including households, businesses and subsidised private payments such as tuition fee loans (OECD, 2018[6]). Countries in which the majority of funds for tertiary education comes from private sources include: Australia, Canada, Chile, Colombia, Japan, Korea, the United Kingdom and the United States. Where a significant proportion of private expenditure comes from tuition fees for students, including international students, governments usually employ public transfers to households in the form of student scholarships, loans and grants as a key policy initiative to promote equitable access. Taking public to private transfers into account, the average direct private investment in educational institutions at the tertiary level is around 25% on average across OECD countries (OECD, 2018[6]).

Notes:
Countries are ranked in descending order of the proportion of public and international expenditure on educational institutions. The figure shows the final source of funds. International expenditure is aggregated with public expenditure for display purposes.
1. Excluding international sources.
2. Primary education includes data from pre-primary and lower secondary education.
3. Year of reference 2016.
Lithuania was not an OECD member country at the time of preparation of the report that this figure is sourced from. Accordingly, Lithuania is not included in the OECD average in this figure.
Source: OECD (2018[6]), Education at a Glance 2018: OECD Indicators, OECD Publishing, Paris, https://doi.org/10.1787/eag-2018-en.
Defining the sources of educational funding can be a complex area of education policy. Education systems have a duty to protect an individual’s right to free primary education, accessible secondary education and equitable tertiary education (OHCHR, 1966[34]). Public funding must therefore adequately deliver on each of these commitments. Accordingly, governments’ policy decisions regarding the sources of educational funding must carefully balance individuals’ rights and the wider economic and social benefits of a well-functioning education system, with significant private returns to education for individuals and growing pressures on public funds.
Many governments across the OECD are finding it increasingly challenging to adequately fund education through public sources alone. As a result, the role of private sources of funding is growing. Between 2010 and 2015, the share of private sources of expenditure on educational institutions from primary to tertiary increased by 11% on average across OECD countries (OECD, 2018[6]). Higher returns can be found through investment at earlier education levels, although in the right policy environments, increasing public expenditure on education at higher levels can be done without necessarily inhibiting equitable outcomes, as long as some conditions are met (OECD, 2012[35]; OECD, 2008[36]). Likewise, despite a common belief to the contrary, cross-country analysis demonstrates that there is no observed correlation between increased decentralisation of financial resources to local governance structures and inequality in education outcomes (Vermeulen, 2018[37]).
Policy priorities
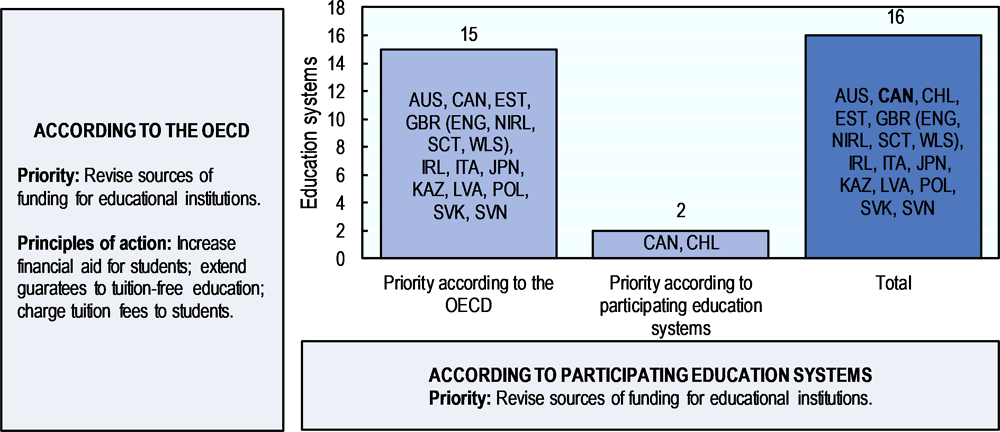
Revising sources of funding for educational institutions
Revising the sources of funding for educational institutions is another funding-related policy priority for several education systems as pressure on public funds is, in many cases, leading to a growing role for private sources of funding. Between 2008 and 2019, this policy priority was identified in at least 16 education systems, either by the OECD in previous country-based work (15 education systems), by participating education systems (2 education systems), or both (1 education system) (Figure 5.7).
The OECD identified revising the sources of education funding as a priority for least 15 education systems between 2008 and 2019. For 12 of these education systems, including Australia, Canada and Estonia, the OECD identified this priority in 2008-14. The OECD identified it as a priority for three other education systems (Kazakhstan, Latvia and Slovenia) in 2015-19.
While remaining cognisant of implementation contexts, certain general principles of action have been identified by the OECD to support education systems in addressing this policy priority. This includes increasing the share of funding coming from public sources by guaranteeing free education or increasing the share of funding coming from private sources by charging tuition fees to students. To mitigate potential equity concerns for certain disadvantaged groups when private sources of funding increase, another principle of action identified by the OECD is to increase financial aid for students through, for example, scholarship, grant or loan systems.
Notes:
1. Priority according to the OECD: See Annex A (OECD publications consulted) and Reader’s Guide (years covered).
2. Principles of action: Component of a recommendation that draws from international evidence produced on a specific topic, either by the OECD or externally.
3. Priority according to participating education system: Based on responses to Education Policy Outlook (EPO) Surveys 2013 and 2016-17, although responses for Austria, Belgium (Flemish, French and German-speaking Communities), Italy, Kazakhstan, Spain and Sweden are based on the EPO Country Profiles published during 2017 and 2018. Responses given during the validation processes for all education systems in 2019 are also included (see the Reader’s Guide).
4. Comparing previous OECD analysis and country responses: Education systems highlighted in bold are those where the policy priority was identified by both the OECD and the education system.
In terms of increasing the share of private funding in education, the OECD recommended introducing or increasing tuition fees in Ireland, Italy, Poland and Slovenia. To balance the cost to households, the OECD also recommended that these education systems develop, strengthen or increase financial aid schemes (OECD, 2009[38]; OECD, 2013[39]; OECD, 2012[40]) (OECD, 2013[41]). In Canada, Estonia and the United States, the OECD recommended improving or increasing targeted financial assistance for students in need (OECD, 2012[42]; OECD, 2012[43]; OECD, 2016[44]).
Figure 5.7 also shows that two education systems reported revising the sources of funding for educational institutions to the OECD as a policy priority. For Canada, this priority has persisted across the period 2008-19, whereas for Chile it emerged between 2015 and 2019.Canada initially reported the need to improve access to tertiary education and efficiency of funding at this level, including through strengthening and expanding student financial assistance. More recently, Canada reported the priority of making all post-secondary education more affordable for students from low- and middle-income families and making student loan repayments more manageable. In Chile, the School Inclusion law (2015) eliminated “shared financing” (co-pago), that is, fees that families were asked to pay to schools on top of the public subsidy per student. To compensate for the loss of funds in the privately subsidised schools that used shared financing before the reform, the law also increased the amount of resources destined for school administrators.
Policy trends
Analysis of the key policy work addressing the sources of funding, as undertaken by participating education systems during 2008-19, suggests that the policies in this area fall into two main trends. The first group of policies is aimed at increasing the share of public funds through guaranteeing tuition-free education or through increasing access to public-private transfers in the form of financial aid schemes. The second group brings together policies aimed at increasing private sources of funding and reducing public spending by charging part of the cost of education to students, mainly through higher tuition fees.
The evidence collected in this report on implementation processes shows, again, that reforms in this area should not be seen as operating in isolation. Successful reforms to sources of funding appear to be supported by accompanying initiatives that share common objectives. In the case of France, for example, following the expansion of its national bursary system for students from low-income families (2013-16), the government committed to guaranteeing a minimum proportion of tertiary study places for needs-based grant holders.
Alternatively, the comparative evidence collected also shows that possible shocks to the system caused by reforms to funding sources should be offset by compensatory efforts elsewhere in the system. For example, following the introduction of tuition fees for international students, and a subsequent fall in enrolments, Sweden launched an inquiry into measures to strengthen the internationalisation of Sweden’s higher education system. In both the cases of France and Sweden, the initiatives were implemented consecutively.
Public financial aid for students
Many countries have strengthened their commitment to public funding for education. For a significant number of countries, this has involved increasing public expenditure on higher education via public to private transfers through student financial aid policies such as grants, loans or free-tuition enrolment. For example, in 2016, Canada increased the value of its non-repayable grants for both students from low- and middle-income families and part-time students in tertiary education by 50%. Similarly, France reformed its national bursary system in 2017 to increase grants to students from low-income families.
Financial aid policies are also being implemented in countries where education is already heavily funded through private sources. Examples include Chile’s State Guaranteed Loans and Scholarships, Japan’s interest-free scholarship loans and Korea’s National Scholarship System, all of which were introduced in 2012. In contrast, some countries have expanded their commitment to free education either for targeted populations or full cohorts. For example, reforms introducing free higher education have been introduced in Chile (2016) and Estonia (2013).
Policies introducing or expanding student financial aid are not restricted to higher education. Some countries have implemented policies to create or enhance their scholarship, loan or tuition-free programmes for secondary level students. Examples include France’s Secondary School Scholarship Scheme (2016) and Japan’s Free Tuition Fee at Public High Schools (2012). In Chile, the School Inclusion Law (2015) outlawed tuition fees in any primary and secondary schools receiving governmental funding with the aim of transforming private-subsidised schools into tuition-free schools.
Policy focus
-
Canada’s Student Loans Program (CSLP) is among the actions undertaken by the Government of Canada to help make post-secondary education more affordable. The CSLP provides financial assistance to eligible students to cover part of their living and education-related costs with grants and loans. It has offered non-repayable grants to more than 3 million higher education students since 1995 (Government of Canada, 2019[45]). A 2017 national statistical review reported that in 2016/17, 380 000 students received non-repayable Canada Student Grants (CSGs) equivalent to CAD 1 014.6 million, which represented an increase from 369 000 students in 2015/16 who received CAD 719.5 million (Government of Canada, 2019[45]). Further national data highlights that 64% of CSG recipients in 2016/17 were low-income full- and part-time students, 27% were students from middle-income families, 10% were students with permanent disabilities, and 9% were students with dependents (Government of Canada, 2019[45]). In 2016, the Government of Canada budget increased by 50% the value of CSGs for students from low-income families and middle-income families, as well as part-time students. This was equivalent to an increase from CAD 2 000 to CAD 3 000 per year for students from low-income families; from CAD 800 to CAD 1 200 per year for students from middle-income families; and from CAD 1 200 to CAD 1 800 per year for part-time students. On 1 August 2017, new, more generous eligibility thresholds for the Canada Student Grant for Full-time Students (CSG-FT) were introduced. CSG eligibility for part-time students and students with dependents was also expanded as of 1 August 2018.
Progress or impact: Employment and Social Development Canada (ESDC)’s Evaluation Directorate has undertaken multiple evaluations of Canada’s Student Loans Program to monitor its implementation and effectiveness. A summative evaluation of the CSLP during 2006-10 reviewed the validity of the programme’s rationale, needs assessment and success at promoting access to post-secondary education (Government of Canada, 2012[46]). The evaluation found positive results, such as the CSLP serving its purpose and mandate, or reducing students’ financial constraints. Research on general effects of loans and grants on post-secondary education enrolment of low-income students showed a positive correlation between the total loan amount disbursed and the post-secondary education participation rate. At the same time, research on the Canada Student Grants Program has been less conclusive in identifying strong relationships between grants alone and participation, except in survey results. One suggested explanation was the corresponding reduction in student loan amounts caused by the grant amounts and, hence, overall student financial aid remaining constant in most cases (Government of Canada, 2016[47]).
Private sector involvement and tuition fees for students
An alternative strategy used in some countries to ensure sufficient funding for education is to seek greater involvement from the private sector. In both Latvia (2013) and Norway (2011), for example, the governments have offered public funds to private providers of ECEC in order to expand provision and increase student enrolment at this level. In 2015, New Zealand’s government reformed the VET training system to give private employers the option of directly managing public funds for workplace training, as opposed to working together with industry training organisations. In some countries, higher education institutions have been allowed to introduce or increase tuition fees charged to students. Examples include Belgium’s 2015 Budget Reshuffling and the introduction of tuition fees for international students in higher education in Sweden in 2011.
Policy focus
-
During 2013-15, Latvia granted state financial support to private pre-school institutions and childcare providers under the condition that by the end of 2015, municipalities would find satisfactory solutions to the shortage of pre-school education provision. Although the number of ECEC institutions increased from 550 to 617 between 2003-14, Latvia continued to face shortages of ECEC places, largely due to rural to urban migration (OECD, 2017[48]).
Progress or impact: Municipalities had not solved the issue by the end of 2015, and the government continued to provide financial support until 2016. In 2016, 89% of three-year-olds in Latvia were enrolled in pre-primary education, compared to an OECD average of 76%, and an increase of 23 percentage points from 2005 (OECD, 2018[6]). In 2016, municipalities and the private sector collaborated to open several child development and play centres. At that time, local governments assumed responsibility for providing financial aid to parents with children between 18 months of age and the start of primary education who were not able to enrol in public childcare in municipal kindergartens due to lack of space (National information reported to the OECD). Since 2016, the assessment of the costs to municipalities for this measure has been calculated via a single method in order to improve transparency and consistency. In 2017, municipalities provided EUR 213 per month, on average, for each child between the ages of one and a half and four years old who was unable to access state-provided ECEC, and EUR 155 per month for those aged five or six who did not receive a place in state-provided, mandatory pre-primary education (Government of Latvia, 2017[49]).
-
Tertiary education has always been free of charge in Sweden for all students who come from Sweden, the European Union, the European Economic Area (EEA) and Switzerland. However, for international students from outside the European Union and the EEA, a tuition fee was introduced in 2011. All students, including those from outside of the European Union and the EEA, who wish to enrol in Swedish universities, can apply for financial support (through study grants and study loans) to pay for living expenses, with eligibility determined according to a minimum performance level and the number of credits achieved. Non-Swedish residents, who moved to Sweden for a reason other than to study, are also eligible for financial support in most cases (OECD, 2018[7]).
Progress or impact: Following a dramatic fall in the number of foreign-born students with the introduction of tuition fees in 2011, international student numbers are now rising, including among those eligible for fees (European Commission, 2018[50]). The Swedish Higher Education Authority reports that for the last ten years, the number of first- and second-cycle foreign students in Swedish universities has surpassed the number of Swedish students abroad (SOU, 2018[51]). During 2017/18, there were 2 740 new incoming students who paid tuition fees, an increase of 23% compared to the year before (Swedish Higher Education Authority, 2017[52]).
In 2017, the Swedish government launched an inquiry into measures to strengthen the internationalisation of Sweden’s higher education system. A key proposal of the final report is to attract more international students by simplifying the application process and increasing scholarship funds. Higher education institutions must also increase transparency regarding tuition fees. The new measures are planned for implementation between 2020 and 2030 (SOU, 2018[51]).
copy the linklink copied!Use of resources
How different resources are used and distributed across educational institutions to effectively meet the needs, priorities and capacities of the education system is a crucial part of funding policies in education (OECD, 2015[2]). Key tasks in the use of resources in education involve decisions related to investing in human, time and material resources as well as infrastructure, and allocating resources more equitably across socio-economically advantaged and disadvantaged schools.
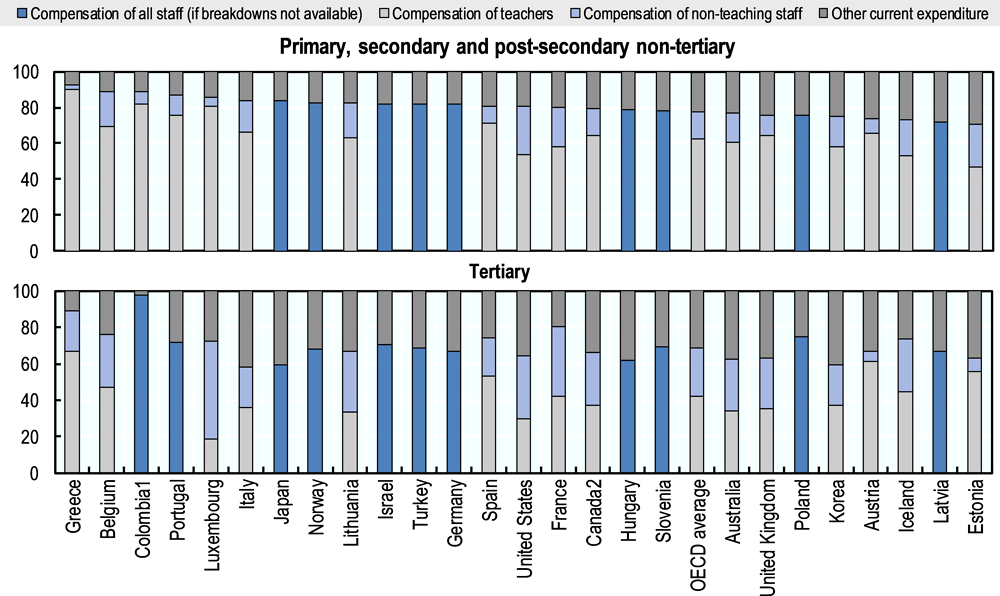
In all OECD countries, the largest part of funding for education is dedicated to human resources, specifically in the compensation of teachers and non-teaching staff. On average across OECD countries in 2015, teacher remuneration accounted for 63% of all current expenditure1 in primary, secondary and post-secondary non-tertiary education, and 42% of all current expenditure in tertiary education (Figure 5.8). This illustrates the large share that teachers’ salaries have in educational spending. It also shows the indirect impact on expenditure that teachers’ salaries can have through other policies. For example, policies aiming to implement full-day schools to increase students’ learning time might require an increase in the number of teachers hired or in the number of teaching hours.
Notes:
1. Year of reference 2016.
2. Primary education includes pre-primary programmes.
Countries are ranked in descending order of the share of all staff compensation in primary, secondary and post-secondary non-tertiary institutions.
Source: OECD (2018[6]), Education at a Glance 2018: OECD Indicators, OECD Publishing, Paris, https://doi.org/10.1787/eag-2018-en.
Figure 5.8 also shows that a smaller, yet significant, part of education funds are used in things that are not related to staff compensation, such as teaching materials and supplies, maintenance of school buildings, providing students’ meals and renting school facilities. These “other current expenditure” account for 22% of current expenditure in non-tertiary education levels, and 32% in tertiary education.
At school level, resource shortages may hinder a school’s capacity to provide quality instruction. According to lower secondary principals’ reports in the OECD Teaching and Learning International Survey (TALIS) 2018, two of the five biggest hindrances, relate to human resources (shortages of support personnel and teachers with competency in teaching students with special needs), another two relate to time resources (shortages of time for instructional leadership and time with students) and one more relates to material resources (shortage or inadequacy of physical infrastructure). Perhaps unsurprisingly, among teachers, the spending priorities considered to be of highest importance relate to human resources: the three most commonly cited were increasing teacher recruitment to reduce class sizes, increasing teacher salaries and offering high-quality professional development for teachers (OECD, 2019[53]).
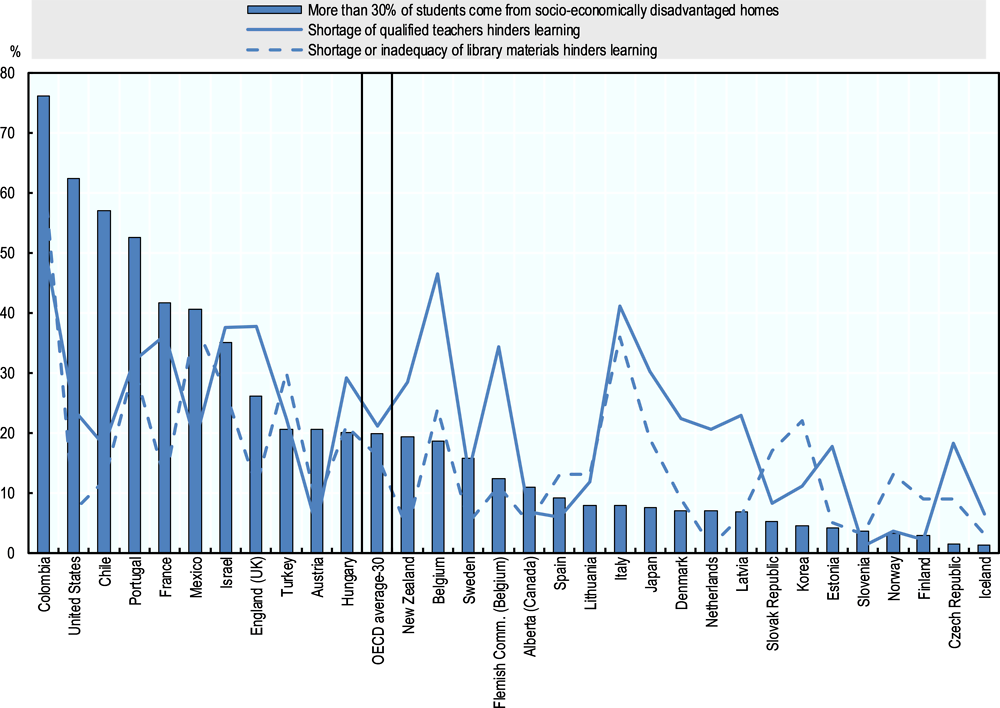
Although certain types of school (e.g. those located in rural areas or those with a higher proportion of disadvantaged students) appear more vulnerable to experiencing resource shortages, careful policy decisions can help to mitigate this. Previous OECD analysis has demonstrated that principals of schools serving more disadvantaged students are more likely to report perceived human and material shortages than their counterparts in schools with a high proportion of advantaged students (OECD, 2013[54]). However, despite this proven correspondence, there are exceptions. For example, according to evidence from TALIS 2018, experiences across education systems vary considerably; certain countries, such as Chile and the United States, appear to have successfully limited perceived teacher and material resource shortages, despite having a higher share of schools with a large proportion of disadvantaged students (Figure 5.9).
Source: OECD (2019[53]), TALIS 2018 Results (Volume I): Teachers and School Leaders as Lifelong Learners, TALIS, OECD Publishing, Paris, https://dx.doi.org/10.1787/1d0bc92a-en.
In other cases, there is a marked difference in the equitability of distribution between material and human resources. For example, although France and the United Kingdom (England) appear to have minimised perceived shortages of library materials, shortages of teachers remain high. For a much smaller group of countries, including Mexico, the inverse is true. Therefore, policy makers must successfully match resources to need and where there is pressure on resources, decisions should be informed by factors relating to both economic and educational efficiency. Disadvantaged students, for example, who are less likely to have access to books and other library materials outside school, may experience a more positive impact from having these materials provided in the school setting than their more advantaged peers.
Policy priorities
Improving equity in resource allocation
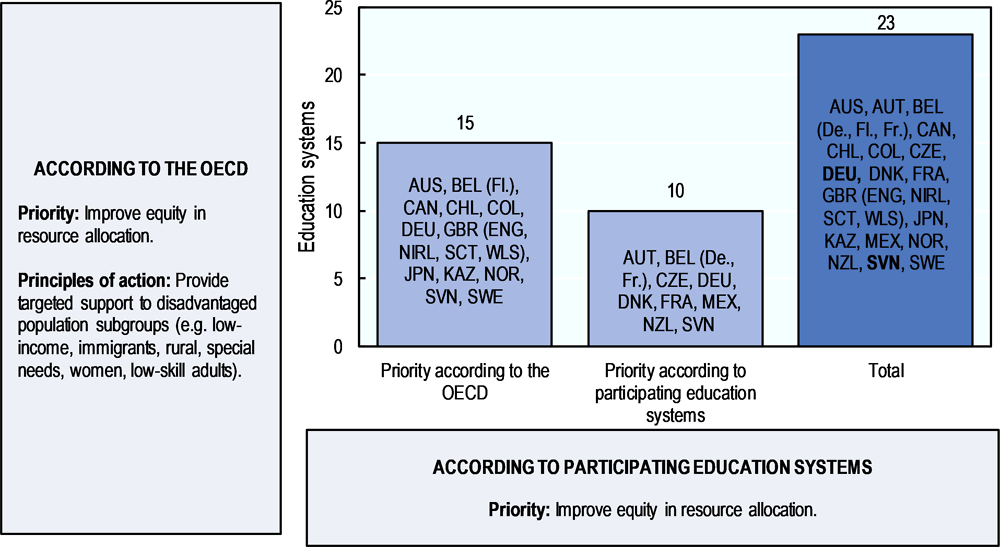
A common policy priority related to education funding and shared by several education systems relates to improving equity in resource allocation. This includes both horizontal equity (allocating similar levels of resources to similar types of provision) and vertical equity (allocating different levels of resources to student groups with different needs) (OECD, 2017[1]). Between 2008 and 2019, this policy priority was identified in at least 23 education systems, either by the OECD in previous country-based work (15 education systems), by participating education systems (10 education systems), or both (2 education systems) (Figure 5.10).
The OECD identified this as a policy priority for at least 15 education systems between 2015 and 2019, including Australia, Japan and Norway. In supporting education systems to tackle this policy priority, general principles of action identified by the OECD include providing targeted support to disadvantaged population sub-groups, including students with socio-economically disadvantaged or immigrant backgrounds, students living in rural areas, students with special needs or at risk of dropout, female students and adults with low skills.
For Canada, for example, the OECD identified the need to invest in indigenous students to improve their participation rates in early childhood education (OECD, 2017[55]). In Colombia, the OECD identified the need to increase enrolment and completion rates at the upper secondary level among socio-economically disadvantaged students and recommended measures to improve equity in resource allocation. This included more locally responsive and flexible allocation of resources that prioritise rural areas and less-developed departments and municipalities (OECD, 2016[19]). In Kazakhstan, the OECD recommended targeting funding to specifically help students at risk of failure when transferring from higher education to the labour market, by improving guidance and support (OECD, 2017[56]).
Some ten education systems reported improving equity in resource allocation as a policy priority. For five of these education systems (Austria, Denmark, Mexico, Czech Republic and Slovenia), this emerged as a priority more recently having first been reported between 2015 and 2019. For other education systems, including Belgium (German-speaking Community), France and New Zealand, it was first reported as a priority in 2008-14. Since 2009, the French Community of Belgium has been targeting resources to schools of lower socio-economic status using a differentiated staffing system. Austria has been using gender budgeting since 2013 to reach various performance targets associated with guaranteeing the equality of educational opportunities between women and men.
Notes:
1. Priority according to the OECD: See Annex A (OECD publications consulted) and Reader’s Guide (years covered).
2. Principles of action: Component of a recommendation that draws from international evidence produced on a specific topic, either by the OECD or externally.
3. Priority according to participating education system: Based on responses to Education Policy Outlook (EPO) Surveys 2013 and 2016-17, although responses for Austria, Belgium (Flemish, French and German-speaking Communities), Italy, Kazakhstan, Spain and Sweden are based on the EPO Country Profiles published during 2017 and 2018. Responses given during the validation processes for all education systems in 2019 are also included (see the Reader’s Guide).
4. Comparing previous OECD analysis and country responses: Education systems highlighted in bold are those where the policy priority was identified by both the OECD and the education system.
Tackling shortages of human and material resources in schools
For several education systems, tackling shortages of human and material resources in schools is an important policy concern. This requires short-term relief, as well as accurate identification of causes, scope and expected duration and strategic foresight to foster long-term solutions (OECD, 2018[57]). Between 2008 and 2019, this policy priority was identified in at least 12 education systems, either by the OECD in previous country-based work (12 education systems), by participating education systems (2 education systems), or both (2 education systems) (Figure 5.11).

Notes:
1. Priority according to the OECD: See Annex A (OECD publications consulted) and Reader’s Guide (years covered).
2. Principles of action: Component of a recommendation that draws from international evidence produced on a specific topic, either by the OECD or externally.
3. Priority according to participating education system: Based on responses to Education Policy Outlook (EPO) Surveys 2013 and 2016-17, although responses for Austria, Belgium (Flemish, French and German-speaking Communities), Italy, Kazakhstan, Spain and Sweden are based on the EPO Country Profiles published during 2017 and 2018. Responses given during the validation processes for all education systems in 2019 are also included (see the Reader’s Guide).
4. Comparing previous OECD analysis and country responses: Education systems highlighted in bold are those where the policy priority was identified by both the OECD and the education system.
The OECD has identified tackling shortages in human and material resources in schools as a policy priority for at least 12 participating education systems since 2008. For 8 of these education systems, including Austria, Kazakhstan, Lithuania and Sweden, the OECD identified this as a policy priority between 2015 and 2019. For the remaining 4 education systems (Finland, Iceland. Korea and the Slovak Republic), the OECD identified this policy priority in 2008-14.
The OECD has identified the following general principles of action to support education systems in tackling shortages of human and material resources in schools: invest in teachers’ career pathways, initial teacher education and professional development to increase the impact of teaching on student outcomes; and invest in the development of high-quality school leadership.
In Chile, the OECD recommended strengthening the teaching profession and promoting teaching as an attractive career path to raise the status of the profession and ensure that all children have good teachers (OECD, 2017[58]). Iceland is an example of an education system for which the OECD identified the need to invest in school principals, specifically through training programmes in pedagogical leadership that support leaders to collaborate within informal school clusters (OECD, 2012[59]). In Korea, for example, concerning ECEC, the OECD recommended revising initial teacher education and providing demand-driven teacher training covering a wide range of skills, such as communication with parents, orientation of curricular content and materials and child-centred teaching and care strategies (Taguma et al., 2012[60]).
Figure 5.11 also shows that only two education systems, Chile and Kazakhstan, reported tackling shortages of human and material resources as a policy priority. Kazakhstan reported this priority in 2015-19 whereas Chile reported it between 2008 and 2014. For Chile, the specific focus has been on material resources Its Strategic Plan for School Infrastructure (2014-18) has seen an estimated investment of over USD 500 million (EUR 438 million) to upgrade infrastructure standards of pre-primary, primary and secondary education schools.
Policy trends
There has been significant policy work across participating education systems from 2008-19 regarding the use of resources in education (Table 5.3). Work in this area can be usefully divided into two main trends. The first group of policy reforms and initiatives relate to targeted support for population sub-groups, predominantly socio-economically disadvantaged students, but also students from linguistic minorities or indigenous or immigrant backgrounds and students with special needs, among others. The second group refers to investments aimed at extending learning time and improving the human and material resources available to students and educational institutions.
The evidence collected for this report on progress or impact shows that policies in this area are often implemented incrementally. For example, several countries, including France and Latvia, have been gradually increasing teacher salaries in recent years. Furthermore, the introduction of England’s single national funding formula for schools has featured an interim period where funding is distributed to schools via the local authority’s funding formula. This system, which postpones direct payments to schools until at least 2021/22, has enabled the reform to develop organically, as local authorities are increasingly opting to mirror the national formula anyway. This suggests that incremental implementation may be an effective way to encourage stakeholder buy-in.
Targeted support to population sub-groups
Many countries are using their resources to provide targeted support for socio-economically disadvantaged children and schools. Policies targeting disadvantaged schools, for example, generally focus on improving the quantity and quality of human resources available in those institutions. This is the case in France’s Priority Education Plan (2014), for example, which also allocated more time for innovative practices. Other policies target disadvantaged students who demonstrate particularly high academic performance, for example, in Ireland’s Third-Level Bursary Scheme (2012). Policies not only provide targeted support for socio-economically disadvantaged students, but also those with special educational needs or second-language needs, such as the Flemish Community of Belgium’s M-Decree (2015), Latvia’s revised model for school funding (2016) and Sweden’s grants to municipalities for newly-arrived students (2017).
Policy focus
-
Final implementation of France’s Priority Education Plan (2014) took place in 2017. According to the European Commission, the primary objective of the plan was to reduce by 10% the differences in basic skills between students attending priority education schools and those attending schools outside priority education (European Commission, 2015[61]). The 2014 plan focuses on three key aspects: 1) updating the map of priority networks; 2) providing additional support to improve student-learning; and 3) reforming teaching practices to include collaborative teaching (European Commission, 2015[61]). France’s Minister of Education and Youth classified priority education schools into two groups: 1) schools with more students from mixed social backgrounds than in schools outside of priority education, categorised as REP (Réseaux d’éducation prioritaire); and 2) schools in isolated neighbourhoods where the impact of social difficulties on school success is the highest, classified as REP+ (Réseaux d’éducation prioritaire renforcée) (Éduscol, 2018[62]).
Progress or impact: During 2018/19, some 1 093 schools had been identified according to the map of priority education in France: 731 middle schools with REP status, and 363 middle schools with REP+ status (Éduscol, 2018[62]). France aimed to reduce class size by 50% in first and second grades in Priority Education Networks (REP) and Enhanced Priority Education Networks (REP+), and the goal was reached at the start of the school year 2018/19. In total, nearly 190 000 first and second-grade students in REP and REP+ were in classes of about 12 students (Ministère de l’Éducation Nationale et de la Jeunesse, 2018[63]).
The European Commission reported in 2017 that overall, between 2013 and 2017, some 54 000 additional teaching posts were created across primary and secondary education, and teachers in priority education were allocated extra time for collaborative teaching. France’s initial 2017 budget included EUR 814 million to increase teachers’ salaries between 2017 and 2020 to improve the attractiveness of the profession, in particular in priority education. Although the government later reduced this amount, it did announce plans to open 9 000 new teaching positions the same year in pre-schools and schools, particularly in priority education (European Commission, 2017[64]).
Additional evidence from the European Commission indicates that public funding for school education in 2018 increased by 2.6 percentage points compared to 2017. The government expects this will help raise teachers’ salaries in schools classified as REP. As of the school year 2018/19, teachers assigned to REP+ received a salary increase of EUR 1 000 net per year (Ministère de l’Éducation Nationale et de la Jeunesse, 2018[63]). The overall goal is to gradually increase the remuneration of staff assigned to REP+ schools and colleges until 2020 (National information reported to the OECD). However, while some teachers may benefit from increased salaries, gaps remain in teaching resources across different types of schools and regions in France (European Commission, 2018[65]).
At the beginning of 2019, the first results of the duplication of preparatory classes in REP+ areas were published, showing overall positive results (Ministère de l’Éducation Nationale et de la Jeunesse, 2019[66]). The results showed that compared to a non-treatment group with similar socio-economic profile, there had been a significant decrease in students with great difficulties by 7.8% in French and 12.5% in mathematics (60 000 students have benefited from the measure in the school year 2017/18).
-
England has undertaken several reforms of school funding in recent years. The School Funding Reform (2013-14) (DfE, 2013[67]) aimed to simplify the funding system in primary and secondary schools and make it more student driven to ensure that resources reach the schools and students who need it most (DfE, 2012[68]). The reform established three blocks of funding to be allocated from the Dedicated Schools Grant (DSG): Early Years Block, Schools Block and High Needs Block (DfE, 2013[67]). Local education authorities, in consultation with their schools’ forum, decide on the funding distribution between the blocks and set formulas for allocation to each school and early years provider (European Commission, 2017[69]). As such, by 2016, there existed 152 different formulae to determine funding allocation throughout the country. This, and the fact that funding allocated to local authorities was often based on historic characteristics, resulted in significant inter- and intra-regional variation in school funding. The system also lacked transparency. As a result, a major reform was proposed, establishing one single national funding formula (NFF) based on measures of student and school characteristics with a small provision for local variation (DfE, 2016[70]). Public consultations on the proposal took place during 2016-17.
Progress or impact: The DfE reported 25 222 submitted responses to the consultation process, most coming from parents (66%), followed by governors (9%), teachers (7%) and school leaders (7%). Many responses highlighted common themes such as calls to increase basic per-student funding, a need to balance fairness and stability to ensure schools do not lose funding, and the importance of supporting low-funded schools (DfE, 2017[71]). Following the consultations, the government introduced a new national funding formula (NFF) (2017) based on 14 factors across 4 key themes: basic per-student funding, additional school needs, school-led funding, and geographic funding. This was introduced, in the academic year 2018/19.
Although the DfE originally intended for the NFF to be allocated directly to schools, an adapted model that offers local flexibility by going through local authorities remains in place until at least 2021/22. This system sees schools’ funding calculated centrally using the NFF, then distributed to local authorities who allocate funding to schools by setting a local formula that follows government guidelines. To support transparency, DfE publishes illustrative school-level allocations and schools, and local authorities have access to the underlying data with which their allocation is calculated (National information reported to the OECD).
Up to 73 out of 152 local authorities have made efforts to better align their funding models to the NFF, and the DfE has identified 41 local authorities who are now using funding settlements that are mirroring the national funding formula factor values almost exactly (DfE, 2018[72]).
As well as revising funding formulae, the government has committed to investing an additional GBP 1.3 billion for schools funding and high needs funding, across the two financial years 2018/19 and 2019/20. This increase has supported the government to raise the funding floor so that schools receive at least a 1% cash increase per student by 2019-20, compared to 2017-18 (DfE, 2017[71]).
Time, human and material resources
Other funding policies are prioritising effective investment in time, human and material resources. In terms of time, education systems are providing resources for extending instructional time to a full day, for example in Austria’s All-day schools, Mexico’s Full Day Schooling, and in Germany’s Future of Education and Care programme. Regarding human resources, some new funding policies are rewarding the additional workload of teachers outside normal instruction hours. This is the case in Latvia’s Teacher Remuneration scheme (2016). Other policies are focused on improving transparency in the allocation of funding for teachers’ salaries, as seen in Mexico’s Fund for Education and Payroll Operating Expenses (2015). As for material resources, two key policy trends are investment in better information and communication technology (ICT) infrastructure and equipment for schools and improving the general school infrastructure through maintenance or construction programmes. Strengthening ICT facilities is the focus of a school investment programme in the French Community of Belgium (2011); and infrastructure is the focus of Chile’s Strategic Plan for School Infrastructure (2014-18) and Ireland’s School Building Programme (2016-21).
Policy focus
-
The School Building Masterplan (2015) is the Flemish Community’s first integrated and comprehensive plan tackling the issue of school infrastructure. It responds to growing pressure placed on the system by demographic changes, wear and tear and the demands of 21st-century learning. The plan has five strategic objectives: 1) renewing existing educational infrastructure; 2) expanding educational capacity; 3) tapping into alternative sources of financing; 4) developing school buildings of the future; and 5) improving long-term planning and management of school infrastructure (Ministry of Education, 2015[73]). A key project in the implementation of the plan has been the launch of a second and completely revised cycle of the Design, Build, Fund, Maintain initiative (DBFM, 2006 and 2016), which sees the development of public-private partnerships for the building of new schools. Through this model, a DBFM corporation takes on the 30-year ownership, maintenance and financing of school infrastructure expansion. Via government subsidies (around 80%) and the school governing body, the corporation receives performance-related availability funding. At the end of the 30 years, ownership transfers to the school governing body (Eurydice, 2019[74]).
Progress or impact: Schools of Tomorrow (Scholen Van Morgen, 2009), the collective name for the first round of the Design, Build, Fund, Maintain (DBFM) projects, is a partnership between the Government of Flanders, BNP Paribas Fortis and AG Real Estate. Schools of Tomorrow is scheduled to reach completion in 2022 when it will have delivered up to around 200 new school buildings through an investment programme totalling EUR 1.5 billion. So far, 159 school infrastructure projects have been completed, accommodating over 115 000 students; 6 more are in the construction phase. Following a reduction in the VAT (value-added tax) rate on school construction (2016), 17 new DBFM projects were added to the initial Schools of Tomorrow programme; these are currently in the design phase (Schools of Tomorrow, 2019[75]).
However, according to forecasts from the Federal Planning Bureau, the demographic pressure on the school system is set to increase in the medium and long terms, with significant implications for the secondary sector up to 2025, and again from 2035, and for the primary sector from 2026 onwards (National information reported to the OECD).
Accordingly, there has been a reaffirmation of the need for alternative financing models in school construction and renovation and a subsequent commitment to further DBFM operations, approved by decree in 2016. The government’s second call for DBFM submissions (2016) incorporates learning from the experience of Schools for Tomorrow and as such focuses on creating smaller, simpler and more project-specific operations with greater involvement from the school boards.
To provide additional support and manage applications, a project office was set up with the Agency for School Investment (AGION), SchoolInvest nv, and representatives from the school network. The Flemish Community has also made efforts to streamline and standardise administrative procedures to reduce transaction costs (Ministry of Education, 2015[73]).
The second call for DBFM projects was launched in 2017, and 52 school building projects were approved, with a total investment commitment of EUR 600 million (AGION, 2018[76]). In search of sustainable solutions to reduce pressure on the infrastructure, in 2019, the government also encouraged infrastructure master planning at the school level, which is aligned with local authorities’ visions. To this end, Go!, the principal education provider for the Flemish Community, set up an operational infrastructure database to monitor the quality and quantity of the current infrastructure (National information reported to the OECD).
-
In Latvia, the government approved a revised teacher remuneration scheme (2016) for pre-primary, primary, lower secondary and upper secondary education (Cabinet of Ministers, 2016[77]). This scheme is part of a new funding model that aims to recognise the additional workload of teachers outside instruction hours. It is based on a 30-hour work-week schedule in contrast to the previous model, which was based on a 21-hour teaching workload (OECD, 2017[48]). The new remuneration scheme also introduced a 13.3% increase in teachers’ minimum statutory salaries from EUR 420 per month in 2013 to EUR 710 per month in 2018. This led to an initial increase of EUR 9 million in the central budget for teachers’ salaries in 2016. The government has also maintained quality-related bonuses linked to teachers’ performance, and school principals can provide extra salary bonuses (European Commission, 2016[78]; Government of Latvia, 2016[79]). Going forward, the issue of teacher salaries will be evaluated within the budget-planning process (European Commisssion, 2017[80]).
Progress or impact: Teachers’ remuneration has always been a sensitive topic in Latvia and generally attracts significant public attention. Therefore, the government actively involved all relevant stakeholders in the consultation process, ensuring in-depth discussions (National information reported to the OECD). In 2018, the Cabinet of Ministers approved the plan to increase teachers’ salaries. The government announced a schedule of increases for 2018-22 by the end of which the minimum monthly salary is set to have reached EUR 900. Accordingly, the government has scheduled additional budget investments of EUR 26.9 million in 2019, EUR 51.5 million in 2020, EUR 81.3 million in 2021 and EUR 111.1 million in 2022 (National information reported to the OECD). However, as student numbers decrease, maintaining investment in high-quality teaching is increasingly challenging, as a disproportionate share of resources is dedicated to maintaining the extensive school network as opposed to enhancing teaching and learning (European Commission, 2019[81]). Improvements to the structure of the school network in order to better adapt to demographic changes are therefore crucial to overall policy success in Latvia’s education system (European Commisssion, 2017[80]). Latvia’s former school funding model, where money follows the student, has remained in place under the new remuneration scheme despite having previously caused teacher salaries to diverge greatly (European Commission, 2016[78]). Additionally, municipalities can still opt to assign top-ups to teachers’ salaries, which can create similar challenges in consistency (European Commission, 2016[78]).
References
[76] AGION (2018), New DBFM program, https://www.agion.be/nieuw-dbfm-programma (accessed on 15 May 2019).
[23] BMFSFJ (2019), Das Gute-KiTa-Gesetz: Für gute Kitas bundesweit [New law on ECEC quality: For good kindergartens nationwide], https://www.bmfsfj.de/bmfsfj/themen/familie/kinderbetreuung/mehr-qualitaet-in-der-fruehen-bildung/das-gute-kita-gesetz/mehr-qualitaet-und-weniger-gebuehren/das-gute-kita-gesetz--fuer-gute-kitas-bundesweit/128214 (accessed on 29 May 2019).
[21] BMFSFJ (2019), Kita-Ausbau: Gesetze und Investitionsprogramme [Expansion of ECEC places: Laws and investment programmes], https://www.bmfsfj.de/bmfsfj/themen/familie/kinderbetreuung/kita-ausbau/kita-ausbau--gesetze-und-investitionsprogramme/86394 (accessed on 29 May 2019).
[22] BMFSFJ (2017), Viertes Investitionsprogramm "Kinderbetreuungsfinanzierung" gestartet [Fourth Investment Programme on ECEC started], https://www.bmfsfj.de/bmfsfj/aktuelles/alle-meldungen/viertes-investitionsprogramm--kinderbetreuungsfinanzierung--gestartet-/117082 (accessed on 29 May 2019).
[77] Cabinet of Ministers (2016), Regulation number 445: Teacher salary rules, Cabinet of Ministers, Latvia, https://likumi.lv/ta/id/283667-pedagogu-darba-samaksas-noteikumi,%20LV (accessed on 31 May 2019).
[72] DfE (2018), The national funding formulae for schools and high needs: 2019 to 2020, Department for Education, UK, https://assets.publishing.service.gov.uk/government/uploads/system/uploads/attachment_data/file/728273/National_funding_formula_policy_document_-_2019_to_2020_-_BRANDED.pdf.
[71] DfE (2017), Analysis of and response to the schools national funding formula consultation, Department for Education, UK, https://assets.publishing.service.gov.uk/government/uploads/system/uploads/attachment_data/file/648553/Schools_national_funding_formula_consultation-response.pdf.
[70] DfE (2016), Schools national funding formula: Government consultation-stage one, https://consult.education.gov.uk/funding-policy-unit/schools-national-funding-formula/supporting_documents/Schools_NFF_consultation.pdf (accessed on 13 November 2018).
[67] DfE (2013), School Funding Reform: Findings from the Review of 2013-14, Arrangements and Changes for 2014-15, Department for Education, UK, https://assets.publishing.service.gov.uk/government/uploads/system/uploads/attachment_data/file/205195/school_funding_reform_2014-15.pdf.
[68] DfE (2012), School funding reform: Next steps towards a fairer system, Department for Education, UK, https://assets.publishing.service.gov.uk/government/uploads/system/uploads/attachment_data/file/179138/school_funding_reform_-_next_steps_towards_a_fairer_system.pdf.
[62] Éduscol (2018), La politique de l’éducation prioritaire : les réseaux d’éducation prioritaire REP et REP+ [The priority education policy: The priority education networks REP and REP+], Ministère de l’Éducation Nationale et de la Jeunesse, http://eduscol.education.fr/cid52780/la-politique-de-l-education-prioritaire-les-reseaux-d-education-prioritaire-rep-et-rep.html (accessed on 20 November 2018).
[81] European Commission (2019), Country Report Latvia 2019, Publications Office of the European Union, https://ec.europa.eu/info/sites/info/files/file_import/2019-european-semester-country-report-latvia_en.pdf (accessed on 12 April 2019).
[65] European Commission (2018), Commission Staff Working Document: Country Report France 2018, SWD(2018) 208 final, https://ec.europa.eu/info/sites/info/files/2018-european-semester-country-report-france-en.pdf (accessed on 20 November 2018).
[24] European Commission (2018), Commission Staff Working Document: Country Report Germany 2018, SWD(2018) 204 final, https://ec.europa.eu/info/sites/info/files/2018-european-semester-country-report-germany-en.pdf (accessed on 17 October 2018).
[50] European Commission (2018), Education and Training Monitor 2018: Sweden, Publications Office of the European Union, https://ec.europa.eu/education/sites/education/files/document-library-docs/et-monitor-report-2018-sweden_en.pdf.
[64] European Commission (2017), Education and Training Monitor 2017: France, Publications Office of the European Union, https://ec.europa.eu/education/sites/education/files/monitor2017-fr_en.pdf.
[69] European Commission (2017), Education and Training Monitor 2017: United Kingdom, Publications Office of the European Union, https://ec.europa.eu/education/sites/education/files/monitor2017-uk_en.pdf.
[78] European Commission (2016), Education and Training Monitor 2016: Latvia, Publications Office of the European Union, https://ec.europa.eu/education/sites/education/files/monitor2016-lv_en.pdf.
[61] European Commission (2015), Education and Training Monitor 2015: France, Publications Office of the European Union, http://ec.europa.eu/dgs/education_culture/repositaory/education/tools/docs/2015/monitor2015-france_en.pdf.
[80] European Commisssion (2017), Education and Training Monitor 2017: Latvia, Publications Office of the European Union, https://ec.europa.eu/education/sites/education/files/monitor2017-lv_en.pdf.
[74] Eurydice (2019), Belgium - Flemish Community: National reforms in school education, Eurydice.
[45] Government of Canada (2019), Canada Student Loans Program statistical review 2016 to 2017, Government of Canada, https://www.canada.ca/en/employment-social-development/programs/canada-student-loans-grants/reports/cslp-statistical-2016-2017.html.
[47] Government of Canada (2016), Summative evaluation of the Budget 2008 Canada Student Loans Program (CSLP) Enhancements, https://www.canada.ca/en/employment-social-development/corporate/reports/evaluations/2016-summative-evaluation-budget-2008-cslp-enhancements.html (accessed on 28 August 2019).
[46] Government of Canada (2012), Summative evaluation of the Canada Student Loans Program : final report, Human Resources and Skills Development Canada, https://www.canada.ca/en/employment-social-development/corporate/reports/evaluations/learning-2011-june.html (accessed on 28 August 2019).
[49] Government of Latvia (2017), National Reform Programme of Latvia for the Implementation of the Europe 2020 Strategy: Progress Report, European Commission, Riga, https://ec.europa.eu/info/sites/info/files/2017-european-semester-national-reform-programme-latvia-en.pdf.
[79] Government of Latvia (2016), Zaudējis spēku - Pedagogu darba samaksas noteikumi [Cabinet of Ministers Regulation on Teachers Remuneration], https://likumi.lv/doc.php?id=195578.
[29] HEA (2017), Review of the Allocation Model for Funding Higher Education Institutions Working Paper 7: The System Performance Framework and its Link to Performance Funding Contents, https://www.education.ie/en/The-Education-System/Higher-Education/HEA-Higher-Education-System- (accessed on 5 November 2018).
[28] Higher Education Authority (2017), Review of the Allocation Model for Funding Higher Education Institutions Working Paper 7: The System Performance Framework and its Link to Performance Funding Contents, https://www.education.ie/en/The-Education-System/Higher-Education/HEA-Higher-Education-System- (accessed on 5 November 2018).
[66] Ministère de l’Éducation Nationale et de la Jeunesse (2019), Dédoublement des classes de CP en éducation prioritaire renforcée: Première évaluation [Duplicate CP Classes in Enhanced Priority Education: First Assessment], Ministère de l’Éducation Nationale, https://www.education.gouv.fr/cid138289/dedoublement-des-classes-de-cp-en-education-prioritaire-renforcee-premiere-evaluation.html (accessed on 9 April 2019).
[63] Ministère de l’Éducation Nationale et de la Jeunesse (2018), Together for a School of Trust, Ministère de l’Éducation Nationale, https://cache.media.education.gouv.fr/file/English_contents/96/4/For-a-School-of-Trust-2018-2019_1052964.pdf (accessed on 9 April 2019).
[73] Ministry of Education (2015), Concept note to the Flemish Government: School Building Masterplan, Ministry of Education, Flemish Community, https://www.agion.be/sites/default/files/images/Conceptnota%20Masterplan%20Scholenbouw.pdf.
[18] Nusche, D. et al. (2016), OECD Reviews of School Resources: Austria 2016, OECD Reviews of School Resources, OECD Publishing, Paris, https://dx.doi.org/10.1787/9789264256729-en.
[53] OECD (2019), TALIS 2018 Results (Volume I): Teachers and School Leaders as Lifelong Learners, TALIS, OECD Publishing, Paris, https://dx.doi.org/10.1787/1d0bc92a-en.
[6] OECD (2018), Education at a Glance 2018: OECD Indicators, OECD Publishing, Paris, https://dx.doi.org/10.1787/eag-2018-en.
[27] OECD (2018), Education Policy in Japan: Building Bridges towards 2030, OECD Publishing, Paris, https://doi.org/10.1787/9789264302402-en (accessed on 12 November 2018).
[7] OECD (2018), Education Policy Outlook 2018: Putting Student Learning at the Centre, OECD Publishing, Paris, https://dx.doi.org/10.1787/9789264301528-en.
[17] OECD (2018), Education Policy Outlook: Kazakhstan Country Profile, OECD Publishing, Paris, http://www.oecd.org/edu/policyoutlook.htm (accessed on 10 April 2019).
[25] OECD (2018), OECD Economic Surveys: Germany 2018, OECD Publishing, Paris, https://dx.doi.org/10.1787/eco_surveys-deu-2018-en.
[57] OECD (2018), Responsive School Systems: Connecting Facilities, Sectors and Programmes for Student Success, OECD Reviews of School Resources, OECD Publishing, Paris, https://dx.doi.org/10.1787/9789264306707-en.
[58] OECD (2017), Education in Chile, Reviews of National Policies for Education, OECD Publishing, Paris, https://dx.doi.org/10.1787/9789264284425-en.
[48] OECD (2017), Education Policy Outlook: Latvia, http://www.oecd.org/education/policyoutlook.htm (accessed on 25 November 2018).
[56] OECD (2017), Higher Education in Kazakhstan 2017, Reviews of National Policies for Education, OECD Publishing, Paris, https://dx.doi.org/10.1787/9789264268531-en.
[9] OECD (2017), OECD Economic Surveys: Colombia 2017, OECD Publishing, Paris, https://dx.doi.org/10.1787/eco_surveys-col-2017-en.
[55] OECD (2017), Promising Practices in Supporting Success for Indigenous Students, OECD Publishing, Paris, https://dx.doi.org/10.1787/9789264279421-en.
[33] OECD (2017), Starting Strong 2017: Key OECD Indicators on Early Childhood Education and Care, Starting Strong, OECD Publishing, Paris, https://dx.doi.org/10.1787/9789264276116-en.
[1] OECD (2017), The Funding of School Education: Connecting Resources and Learning, OECD Reviews of School Resources, OECD Publishing, Paris, https://dx.doi.org/10.1787/9789264276147-en.
[19] OECD (2016), Education in Colombia, Reviews of National Policies for Education, OECD Publishing, Paris, https://dx.doi.org/10.1787/9789264250604-en.
[12] OECD (2016), OECD Economic Surveys: Hungary 2016, OECD Publishing, Paris, https://dx.doi.org/10.1787/eco_surveys-hun-2016-en.
[44] OECD (2016), OECD Economic Surveys: United States 2016, OECD Publishing, Paris, https://dx.doi.org/10.1787/eco_surveys-usa-2016-en.
[3] OECD (2016), PISA 2015 Results (Volume II): Policies and Practices for Successful Schools, PISA, OECD Publishing, Paris, https://dx.doi.org/10.1787/9789264267510-en.
[2] OECD (2015), Education Policy Outlook 2015: Making Reforms Happen, OECD Publishing, Paris, https://dx.doi.org/10.1787/9789264225442-en.
[26] OECD (2015), Education Policy Outlook: Japan, OECD Publishing, Paris, https://www.oecd.org/education/Japan-country-profile.pdf.
[15] OECD (2015), OECD Economic Surveys: Belgium 2015, OECD Publishing, Paris, https://dx.doi.org/10.1787/eco_surveys-bel-2015-en.
[8] OECD (2015), OECD Economic Surveys: Chile 2015, OECD Publishing, Paris, https://dx.doi.org/10.1787/eco_surveys-chl-2015-en.
[13] OECD (2015), OECD Economic Surveys: France 2015, OECD Publishing, Paris, https://dx.doi.org/10.1787/eco_surveys-fra-2015-en.
[20] OECD (2013), OECD Economic Surveys: Ireland 2013, OECD Publishing, Paris, https://dx.doi.org/10.1787/eco_surveys-irl-2013-en.
[39] OECD (2013), OECD Economic Surveys: Italy 2013, OECD Publishing, Paris, https://dx.doi.org/10.1787/eco_surveys-ita-2013-en.
[41] OECD (2013), OECD Economic Surveys: Slovenia 2013, OECD Publishing, Paris, https://dx.doi.org/10.1787/eco_surveys-svn-2013-en.
[54] OECD (2013), PISA 2012 Results: What Makes Schools Successful (Volume IV): Resources, Policies and Practices, PISA, OECD Publishing, Paris, https://dx.doi.org/10.1787/9789264201156-en.
[5] OECD (2012), Better Skills, Better Jobs, Better Lives: A Strategic Approach to Skills Policies, OECD Publishing, Paris, https://dx.doi.org/10.1787/9789264177338-en.
[4] OECD (2012), Equity and Quality in Education: Supporting Disadvantaged Students and Schools, OECD Publishing, Paris, https://dx.doi.org/10.1787/9789264130852-en.
[35] OECD (2012), “Is Increasing Private Expenditure, Especially in Tertiary Education, Associated with Less Public Funding and Less Equitable Access?”, Education Indicators in Focus, No. 8, OECD Publishing, Paris, https://dx.doi.org/10.1787/5k8zs43nlm42-en.
[42] OECD (2012), OECD Economic Surveys: Canada 2012, OECD Publishing, Paris, https://dx.doi.org/10.1787/eco_surveys-can-2012-en.
[43] OECD (2012), OECD Economic Surveys: Estonia 2012, OECD Publishing, Paris, https://dx.doi.org/10.1787/eco_surveys-est-2012-en.
[11] OECD (2012), OECD Economic Surveys: Germany 2012, OECD Publishing, Paris, https://dx.doi.org/10.1787/eco_surveys-deu-2012-en.
[40] OECD (2012), OECD Economic Surveys: Poland 2012: Volume 2012 Issue 7, OECD Publishing, Paris, https://dx.doi.org/10.1787/eco_surveys-pol-2012-en.
[59] OECD (2012), “Towards a Strategy to Prevent Dropout in Iceland”, OECD-Iceland Improving Schools Review, https://www.oecd.org/iceland/49451462.pdf.
[38] OECD (2009), OECD Economic Surveys: Ireland 2009, OECD Publishing, Paris, https://dx.doi.org/10.1787/eco_surveys-irl-2009-en.
[36] OECD (2008), Tertiary Education for the Knowledge Society: Volume 1 and Volume 2, OECD Reviews of Tertiary Education, OECD Publishing, Paris, https://dx.doi.org/10.1787/9789264046535-en.
[16] OECD/The World Bank (2015), OECD Reviews of School Resources: Kazakhstan 2015, OECD Reviews of School Resources, OECD Publishing, Paris, https://dx.doi.org/10.1787/9789264245891-en.
[34] OHCHR (1966), International Covenant on Economic, Social and Cultural Rights, United Nations Human Rights Office of the High Commissioner, https://www.ohchr.org/en/professionalinterest/pages/cescr.aspx (accessed on 20 June 2019).
[32] Radinger, T. et al. (2018), OECD Reviews of School Resources: Colombia 2018, OECD Reviews of School Resources, OECD Publishing, Paris, https://dx.doi.org/10.1787/9789264303751-en.
[14] Santiago, P. et al. (2016), OECD Reviews of School Resources: Slovak Republic 2015, OECD Reviews of School Resources, OECD Publishing, Paris, https://dx.doi.org/10.1787/9789264247567-en.
[10] Santiago, P. et al. (2016), OECD Reviews of School Resources: Estonia 2016, OECD Reviews of School Resources, OECD Publishing, Paris, https://dx.doi.org/10.1787/9789264251731-en.
[75] Schools of Tomorrow (2019), About us: Schools of Tomorrow, https://www.scholenvanmorgen.be/over-scholen-van-morgen (accessed on 15 May 2019).
[30] Smart, W. (2013), Analysis of the impact of the PBRF, Ministry of Education, http://www.educationcounts.govt.nz. (accessed on 26 November 2018).
[51] SOU (2018), Internationalisation of Swedish Higher Education Institutions, Swedish Government Inquiries, Stockholm, https://www.regeringen.se/4ab6ff/contentassets/2cf334f2792c42d4b8c414076eb59204/summary-in-english-internationalisation-of-swedish-higher-education-institutions (accessed on 4 April 2019).
[52] Swedish Higher Education Authority (2017), Higher education in Sweden - 2017 Status Report, Swedish Higher Education Authority, Stockholm, http://english.uka.se/download/18.327e2db015c8695b5ab327d/1497971771453/status-report-statistics-higher-education-sweden-2017.pdf.
[60] Taguma, M. et al. (2012), Quality Matters in Early Childhood Education and Care: Korea 2012, Quality Matters in Early Childhood Education and Care, OECD Publishing, Paris, https://dx.doi.org/10.1787/9789264175648-en.
[31] Tertiary Education Commission (2019), Improving Research Quality: The interim results of the PBRF 2018 Quality Evaluation, Tertiary Education Commission, https://www.tec.govt.nz/assets/Publications-and-others/e9b4639364/Improving-Research-Quality_The-interim-results-of-the-PBRF-2018-Quality-Evaluation.pdf.
[37] Vermeulen, W. (2018), “Decentralised funding and inequality in education”, in Fiscal Decentralisation and Inclusive Growth, OECD Publishing, Paris, https://dx.doi.org/10.1787/9789264302488-7-en.
Note
← 1. Current expenditure refers to spending on goods and services consumed within the current year and requiring recurrent production in order to sustain educational services. From primary to tertiary education, 92% of the spending of educational institutions is devoted to current expenditure, on average across OECD countries in 2015. Current expenditure is different from capital expenditure, which refers to spending on assets that last longer than one year, including construction, renovation or major repair of buildings, and new or replacement equipment. From primary to tertiary education, 8% of the spending of educational institutions is devoted to capital expenditure, on average across OECD countries in 2015. For more information, see (OECD, 2018[6]).
Metadata, Legal and Rights
https://doi.org/10.1787/2b8ad56e-en
© OECD 2019
The use of this work, whether digital or print, is governed by the Terms and Conditions to be found at http://www.oecd.org/termsandconditions.