Chapter 3. Earnings-related mandatory pensions
This chapter describes the mandatory earnings-related pension scheme and its historical background. The main component of the Portuguese old-age pension system is a pay-as-you-go defined benefit scheme, the so-called Pensão de velhice. The chapter presents current pension outcomes, describes the rules of the current pension system and assesses its capacity to deliver good pensions in a financially sustainable way. It also describes the pension scheme for civil servants and other special regimes. The chapter concludes with policy recommendations to improve earnings related pensions.
3.1. Introduction
The Portuguese earnings-related old-age pension system is pay-as-you-go defined benefit (DB). Private-sector workers are covered by pensions within the general social security scheme, regime geral da Segurança Social. The former civil service pension scheme, Caixa Geral de Aposentações (CGA), has been closed to new entrants since 2006 and new civil servants contribute to the general scheme. Yet, the CGA will continue to operate for most of the 21st century as, although rules have converged except for the pre-2006 entitlements, those who became civil servants before 2006 continue in the old scheme.
More than three-quarters (77%) of people older than 65 received a pension from the general social security scheme in 2016 and 22% from the CGA. Moreover, there are special rules for various professions who have lower official retirement ages and sometimes lower minimum contributory requirements.
Portugal has been particularly active reforming the pension system over past decades, mainly focusing on improving financial sustainability (European Commission, 2018[1]). The chapter is organised as follows. The next section contains a brief history of the Portuguese pension system. Section 3.3 describes the current situation of contributors and retirees in Portugal while the following section describes the rules of the current earnings-related pension system and includes simulations of future outcomes. Section 3.5 discusses survivor pensions, civil service schemes and the special regimes. Finally, the last section concludes and provides policy options.
3.2. Recent changes in the Portuguese pension landscape
The Portuguese pension system was initially a funded pension system but converted into a public pay-as-you-go defined benefit (DB) system starting from the 1960s. Over the years, the minimum years of required contributions increased as did the years used to calculate the reference wage. Additional payments, a 13th and 14th month, were granted, and a safety net for the poorest pensioners was introduced. In 2006, the two separate systems for private-sector workers and civil servants were merged and indexation rules were implemented while indexation had been largely discretionary up until then.
This section first discusses the population ageing context and then focuses on a brief history of the Portuguese pension system. It provides details about measures legislated over the past decades. In order to provide an overview upfront, the main pension reforms since 1990 are summarised in Table 3.1.
3.2.1. Population ageing
A combination of low fertility and rising life expectancy has pushed the old-age dependency ratio – the number of people older than 65 years per 100 people of working age (20-64) – from 19.6 in 1975 (close to the OECD average), to 34.6 in 2015 against 27.9 in the OECD on average (Figure 3.1). By 2050, it is expected to be 73.2, making Portugal the fourth oldest country in the OECD based on this measure using UN data, after Japan, Spain and Greece. Eurostat data produce a similar picture, with only Greece projected to have a higher old-age dependency ratio than Portugal in 2050 among EU countries. As a consequence, the financial pressure on Portugal’s pension system has grown.
The old-age dependency ratio is computed using fixed age boundaries, and as such only captures demographic shifts regardless of whether people are still working at higher ages. Accounting for the rising retirement age leads to a smaller increase in the effective old-age dependency ratio compared to the changes projected based on fixed age boundaries. Between 2015 and 2050, the statutory retirement age is projected to increase by 2.5 years (from 66 to 68.5 years) due to life expectancy gains (Section 3.4). Therefore, when using this increase of 2.5 years in the age boundary, the old-age dependency ratio in 2050 would be lower at 62 instead of 73.
As other OECD countries, Portugal has benefited from the long-term trends of rising longevity. Since 2000, life-expectancy gains have indeed been large in Portugal (Figure 3.2). Whereas countries like Mexico and the United States have gained less than 2.5 years in life expectancy at birth, the increase has been 4.5 years in Portugal, one of the highest in the OECD and well above the OECD average of 3.7 years. Moreover, the majority of the years gained are in reported good health: 3.8 out of 4.5 years.1

Note: The projected old-age dependency ratios differ based on the sources used. This report is based on UN medium variant projections for comparison reasons. The largest differences are the following: according to Eurostat the old-age dependency ratio (65+/20-64) would increase by 39 and 19 percentage points between 2015 and 2050 in Spain and Austria, respectively, against 47 and 29 points with UN data. On the other hand, it would increase in Latvia by 33 points based on Eurostat against only 21 points with UN data.
Source: United Nations World Population Prospects: The 2017 Revision.
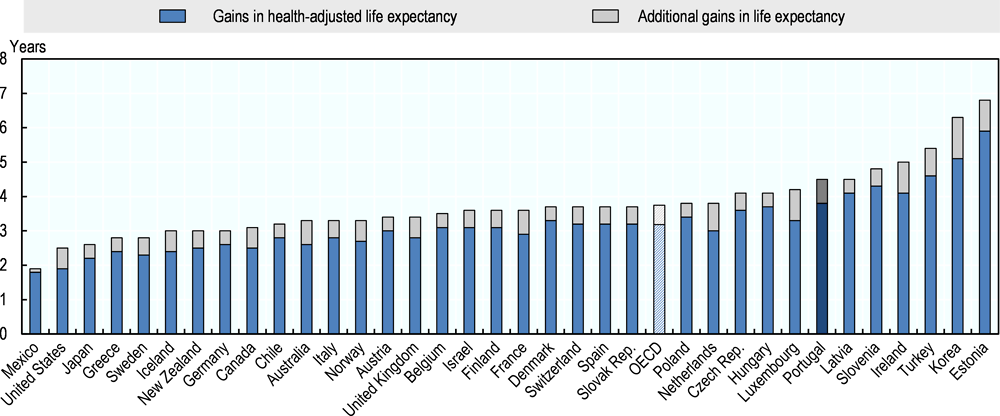
Note: Health-adjusted life expectancy is defined as the number of years that people can expect to live in “full health” by taking into account years lived in less than full health due to disease and/or injury.
Source: WHO (2016).
3.2.2. Main reforms before the financial crisis
A unified social insurance system, encompassing pensions, health care and social assistance, was created in 1962. Moving away from the previously funded schemes, most pensions under the new law were to be financed on a pay-as-you-go basis (Chuliá and Asensio, 2006[2]).
Initially, minimum contribution periods and periods used to calculate the reference wage to compute pension benefits were short. In 1973, the minimum contribution period was set at 24 months and the reference wage was based on the best five out of the last ten years of earnings. Men could retire at age 65 and women at age 62. While by the early 1970s most salaried workers were covered many participants had significant coverage gaps in their career. In an effort to combat old-age poverty, a thirteenth pension payment to all pensioners (Christmas payment) was introduced in 1974, and a fourteenth payment (holiday payment, in July) in 1990. In 1977, an old-age safety net, the so-called social pension, was established, which became means-tested in 1980. The late-70s and early-80s saw a significant expansion of coverage to self-employed workers, domestic employees, artists, workers without a work contract and those who decided to voluntarily contribute.
In 1977 and 1983, Portugal requested financial assistance from the IMF to deal with rising public deficits. The social security contribution rate was raised to 26.5% and subsequently to 28.5%. The minimum contribution period for a pension was increased to 60 months, taking effect in 1980; in 1982, it was again raised to 120 months starting in 1987.
In 1984, the goals and principles of social security were put into law with the Social Security Framework Law. In terms of funding, the law established that the general scheme was to be financed by the Social Security budget, through contributions from workers and employers, whereas the non-contributory schemes were to be financed by transfers from the state budget.
A single social security contribution came into force in 1986. The contribution rates for employees and employers were set at 11% and 24%, respectively. In 1993, the minimum years of contributions were raised again to the current level of 15 years with at least 120 days of contributions needed for one year to be recorded. The reference wage was based on the best ten out of the last 15 years rather than five out of ten previously. In the same year, additional levels of minimum pensions were introduced with longer contribution periods leading to larger minimum pensions (Chapter 2).
The retirement age for women increased gradually until it converged to men’s retirement age of 65 in 1999. The full-career reference in the Portuguese pension system, defined as the number of years after which accrual stops, was increased from 37 to 40 years. Early retirement was not possible before the age of 60. From 1993 up to 2002, each year of contributions led to an accrual of 2% of the reference wage. Previously it had been 2.2%. After 2002 it varied between 2% and 2.3% depending on career length and the reference wage.
In 1996, the period for which unemployment credits are granted was extended to the 45-54 age group against 55-65 previously. In 1999, a bonus of 10% per year of late retirement (with a maximum of 50%) was introduced for those with more than 40 years of contributions. Early retirement was made possible if the beneficiary had contributed for at least 30 years and was older than 54. For early retirement, benefits were reduced by 4.5% per year of anticipation, with a maximum of 45%. Finally, pensions for the long-term unemployed were introduced which could be taken from the age of 55 with 20 years of contributions.
Civil servants who started work before 1993 had much more favourable pension rules. They needed only five minimum years of contributions instead of 15 and the retirement age was 60 instead of 65. A more favourable pension formula resulted in much more generous pensions compared to the general social security scheme. Between 1993 and 2006 a gradual convergence between the rules of the civil-servant scheme and the general social security scheme was put in motion. Since 2006, no new entrants have been allowed in the civil-service scheme, instead new civil servants have contributed to the general regime. At the same time, the convergence of the retirement age, full career length and eligibility for early retirement between both schemes was sped up to eliminate the last remaining differences by 2015 for the majority of civil servants (and 2022 for the few remaining civil service occupations).
In 2002, after severe fiscal pressure, steps were taken to make pensions more financially sustainable through less generous pensions. The reference earnings used to calculate pension benefits were gradually changed from the best 10 years of the last 15 years to the full-career average earnings. Uprating of past wages was changed from price inflation to a combination of price inflation and earnings growth. Shortly after, in 2007, indexation rules of pensions in payment were introduced for the first time. Previously, indexation was largely discretionary with the law simply stating that pensions should be indexed according to salaries, prices and other politically relevant macro-economic figures. At the same time, a sustainability factor was introduced which adjusted the initial benefit level for new retirees to rising life expectancy. The sustainability factor is given by life expectancy at 65 in 2006 divided by life expectancy at 65 in the year before retirement. With rising life expectancy, the sustainability factor slowly moves away from one, reducing initial benefits at a given age more and more over time. Finally, from the age of 55 someone could apply for early retirement, maintaining the minimum of 30 years of contributions but increasing the penalty to 0.5% for each month of early retirement.
3.2.3. Main reforms during and after the financial crisis2
The 2007 financial crisis and subsequent sovereign debt crisis hit Portugal hard and, by 2010, the general government deficit had increased to 11.2% of GDP. Between 2011 and 2015, the receipts of pension contributions as percentage of GDP stayed relatively constant, while expenditures on earnings-related and minimum pensions kept rising until 2013 before stabilising (Figure 3.3, Panel A).
The balance of the general scheme is typically reported separately from the balance of the civil-servant scheme (Panel B). The total pension budget (combining both schemes) has been in structural deficit due to the negative balances in the civil-servant scheme: expenditures in the civil-servant scheme have been consistently higher than contributions, generating an annual deficit of about 3% of GDP since 2006, which is financed by taxes. Meanwhile new civil servants have entered the general scheme, contributing to its revenues while not yet claiming pensions.

Note: Non-contributory pensions are excluded except the top-up of minimum pensions. For the general regime, contributions are based on the proportion of social security contributions going to pensions 22.65/34.75.
Source: Ministério do Trabalho, Solidariedade e Segurança Social and OECD calculations.
In 2011, Portugal agreed to an ambitious reform programme in the context of a EUR 78 billion IMF-EU bailout. To combat shortfalls in social security contributions an extraordinary solidarity contribution (Contribuição Extraordinária de Solidariedade) was introduced under the Economic and Financial Adjustment Programme.3 The tax brackets and tax rates used of this extraordinary solidarity contribution have kept being modified. The contribution was a temporary additional tax applied to pensions in payment. Initially the tax was set at 10% for monthly pensions over EUR 5 000 (Annex Table 3.1 in the Annex).4 Subsequently, rates were raised (up to 40% for some pension levels) and the range of pensions subject to the extraordinary solidarity contribution widened. The extraordinary solidarity contribution scheme was abolished at the end of 2016.
In addition, in 2012, early-retirement possibilities under the social security programme and the 13th– and 14th–month pension payments (for those with monthly pensions over EUR 1 100) were suspended.5 Before the suspension of early-retirement schemes it was possible to claim an early pension at the age of 55 with at least 30 contribution years, with the pension being reduced by 0.5% for each month of anticipation. Pension indexation was temporarily suspended too. The bailout terms included measures to encourage employees to retire closer to the normal retirement age of 65, such as raising the minimum years of contributions for early retirement to 40 and raising the early retirement age to 60 (enacted in 2015). However, early retirement (with benefit reduction) at age 57 was still possible in case of unemployment (see Section 3.4).
In 2014, the retirement age was raised from 65 to 66 years and linked to life expectancy from 2016 onwards. This reform was implemented while abolishing the sustainability factor for those retiring at or after the official retirement age. Therefore, instead of linking initial pension levels to life expectancy, now only the retirement age is linked to life expectancy while the sustainability factor remains in place for early retirement.6 Moreover, technically, the base year used for the sustainability factor formula was changed from 2006 to 2000, implying a stronger penalty of about 7.5 percentage points, from 7.0% (2006 base) to 14.5% (2000 base) in 2014.
Some measures taken during the crisis were subsequently abolished through a ruling of the constitutional court. For instance, the decision to suspend the holiday and the Christmas allowance was reversed. What remained was the extraordinary solidarity contribution (until 2016) and the temporary suspension of both indexation and early retirement.
3.2.4. Future expenditures
The measures taken over the past two decades have improved the financial sustainability of the Portuguese pension system. Yet, given population ageing, public pension expenditure is expected, based on the projections by the European Commission (European Commission, 2018[3]), to rise over the medium term, before coming down to current levels around 2050 (Figure 3.4). By 2050, among the countries with the highest spending on pensions as a percentage of GDP, only France, Greece and Portugal would avoid an increase from the current levels. Still only Austria, Belgium, France, Italy, Slovenia and Spain are projected to spend more than Portugal with 13.7% of GDP in the middle of the century.

Note: The figure for Australia is 2055.
Source: For all non-EU OECD countries except Norway (OECD, 2017[4]) and for all EU OECD countries and Norway (European Commission, 2018[3]).
The stabilisation of future spending is the result of opposing forces. Changes in spending can be split into the change of the old-age dependency ratio, the benefit ratio, the coverage ratio, an employment effect and the labour share:
An increase of 1% in the old-age dependency ratio that is not offset by a decrease of 1% in the average pension relative to the average wage leads to an increase of 1% in the share of pension spending in GDP, assuming that the labour share in the economy, the coverage ratio (number of pensioners for 100 people over 65) and the employment ratio (total employment relative to the population aged between 20 and 64) are constant. This is why it matters crucially that employment increases, especially through a raise in the effective retirement age, in order to avoid that ageing directly leads to lower pensions, higher spending or both.
The old-age dependency ratio – based on fixed age boundaries – in Portugal is projected to increase rapidly. This will thus tend to mechanically increase spending on pensions. This effect alone would add 10.6 percentage points of GDP on spending by 2050. However, according to the European Commission (European Commission, 2018[3]), it is partially offset by a drop in the coverage ratio thanks to a rising retirement age (-3.0 percentage points of GDP) and by a drop in the benefit ratio of almost 30% contributing to a drop of about 5 percentage points. of GDP in spending. According to projections of the effective exit age by the European Commission, people will retire on average before the normal retirement age (one year and eight months early for men and two years and one month for women). Given the large penalty for early retirement in Portugal (see Section 3.4) this leads to a large projected drop in pension benefits and spending. Finally, the employment effect is expected to lower pension spending by an additional 2.0 percentage points of GDP.
3.3. Current outcomes of the pension system
3.3.1. Contributions
In Portugal, all non-contributory pensions are financed by taxes. While the law stipulates that earnings-related pensions should in principle be financed by contributions, any deficit should also be financed by the general government budget.
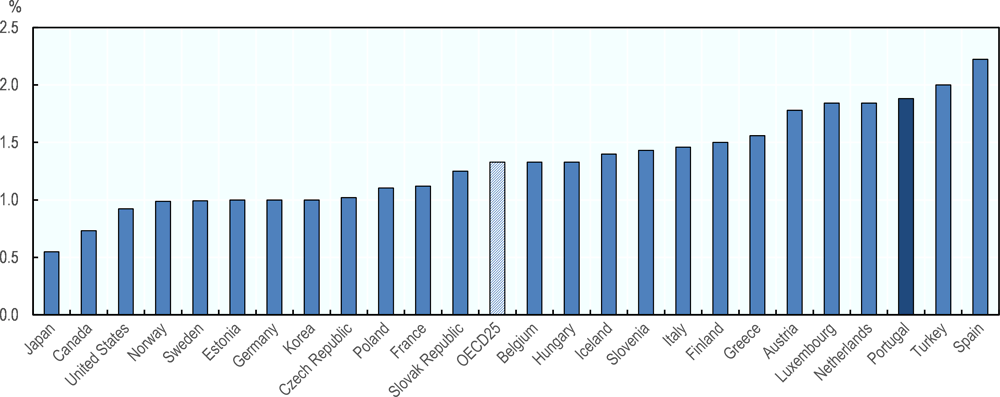
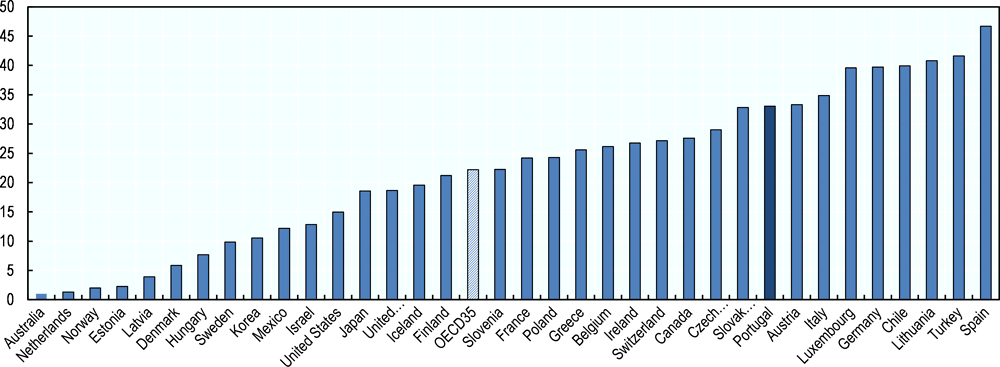
Employees and employers pay social contributions equal to 11% and 23.75% of wages (34.75% in total); in total, although this does not represent an earmarked pension contribution rate, 22.65 percentage points go to the pension budget.7 The contribution rate is relatively high, compared to the OECD average (of countries with earmarked pension contributions) of 18.6%, especially given that there is no wage ceiling in Portugal. However, it is still 10 percentage points below the maximum in Italy at 33% (Figure 3.5).
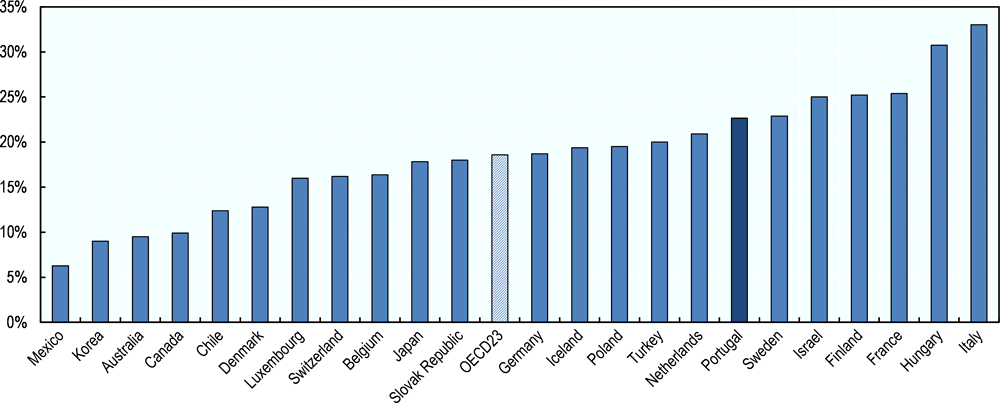
Note: Other OECD countries do not have earmarked pension contributions, instead pensions are paid from general social security contributions.
Source: (OECD, 2017[4]).
Four million people between the ages of 20 and 65 contributed to the pension system in 2016, which is equivalent to 64% of the population in that age group to be related to an employment rate of 68%. Contributions had the following age pattern in 2016 (Figure 3.6): 50% of women and 58% of men between the ages of 20 and 24 contributed, with this share rising to a peak of 79% and 84% for 30-34, declining after age 35 and more sharply towards the retirement age.
Between 2006 and 2016, the share of women contributing increased significantly among those aged between 30 and 59 years. By contrast, during the same period, the share of men contributing has been relatively stable for most age groups. However, there has been a slight increase of 3.5 percentage points in the share of contributors aged 55-59, which likely reflects the heavier penalty for early retirement.

Source: OECD calculations based on Portuguese social security data and UN population statistics.
3.3.2. Benefit levels
The average pension in payment of the general social security scheme in December 2016 was EUR 453, or 36% of the gross average wage. This is only slightly above the safety net benefit (CSI) at 28.5% of the average wage (Chapter 2). Moreover, newly granted pensions in 2016 were EUR 555 on average, 44% of the average wage. Pension benefits vary across age groups and gender (Figure 3.7). Women received an average pension of EUR 332 whereas men got EUR 583, i.e. 26% and 46% of the average wage, respectively. The gender pension gap is much larger than in other European countries, on average.8
Since 2006, the average pension increased from 41.5% to 45.9% of the average wage for men, and from 24.5% to 26.1% for women, partly due to past improvements in employment.9 This increase happened for almost all age groups, especially for men. Older women (75+) tend to receive pensions that are on average close to the lowest minimum pension level (Figure 3.7, Panel A and Chapter 2).

Source: OECD calculations based on Portuguese social security data.
Moreover, younger age groups among both men and women, tend to receive a higher pension, due in part to the combination of wage improvements, and longer careers for women, across generations. The indexation of pensions in payments, which is less favourable over time than wage indexation, also contributes to this. Only those who retire very early (age group 55-59) now receive a lower pension than those who are slightly older (age group 60-64, who are also in early retirement). Early retirement, however, is less attractive financially given the reforms of the past decades.
Compared to other countries, Portuguese retirees have relatively high pension benefits relative to earnings of those close to the retirement age. The median gross pension of someone aged 65-74 in Portugal was 64% of median gross earnings of someone aged 50-59 in 2016 (Figure 3.8). One reason why this figure is much higher than the average pension from the general regime mentioned above is that it takes into account all pensioners including civil servants. The EU23 average is 56% with countries ranging from as low as 35% in Ireland to as high as 88% in Luxembourg. This is consistent with a high relative income of those older than 65 in Portugal (Figure 3.9). On average those older than 65 receive 95% of the average income for the whole population, against 88% in the OECD on average.
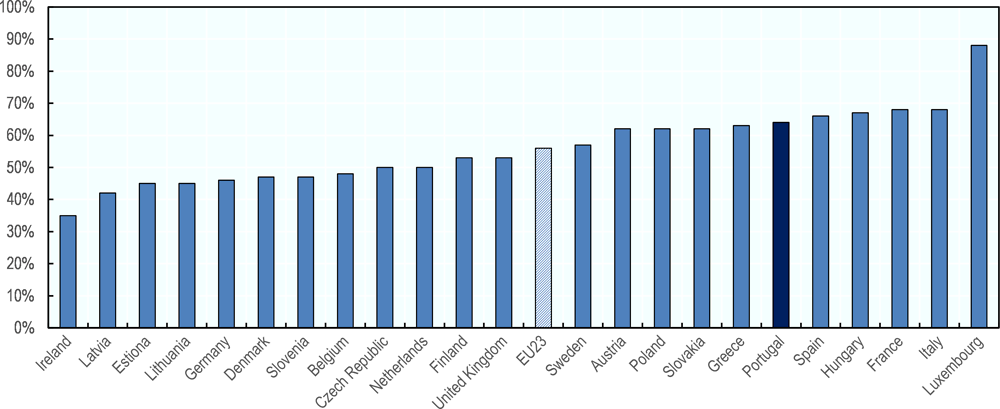
Source: European Commission, Pension Adequacy Report 2018.
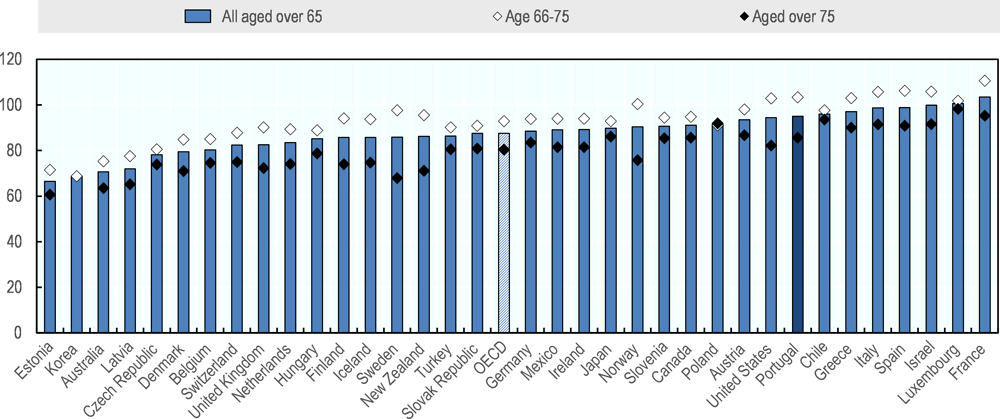
Source: (OECD, 2017[4]).
3.3.3. Inequality
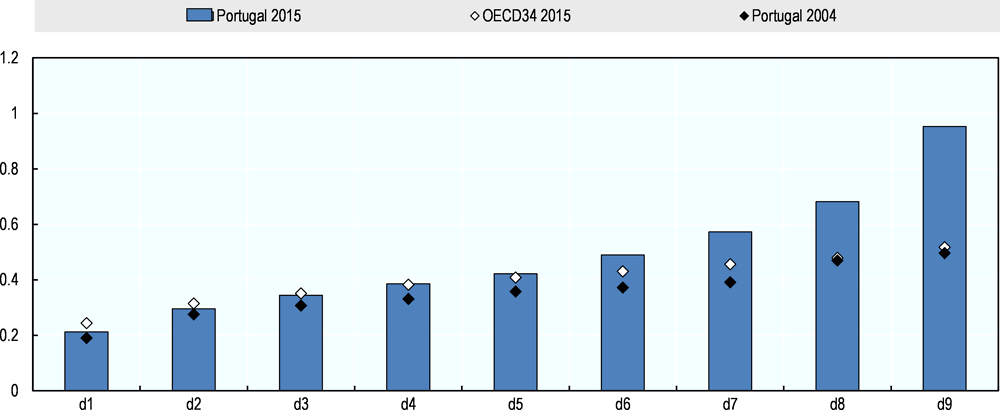
Inequality in old-age social security transfers, the majority of which is made up of pension benefits, is very high in Portugal with a substantial increase over the last decade. The 10% pensioners with the highest transfers received more than 4.5 times the transfers of those receiving the 10% lowest pensions in 2015 (Figure 3.10). By contrast, for the OECD on average, this inter-decile ratio is 2.1.
The main difference relative to the OECD average comes from those receiving the higher pensions. For example, for the highest decile, the average social security transfer is more than 95% of the average wage in Portugal against 52% in the OECD on average. In some OECD countries social security only consists of flat-rate or means-tested benefits, or pensionable earnings are capped at a relatively low level, all of which compress the overall distribution. Old-age income inequality increased sharply in Portugal as the inter-decile ratio was 2.6 “only” in 2004.
Source: OECD calculations based on OECD income distribution database.
3.4. The current general earnings-related pension scheme
3.4.1. Accrual phase in the general scheme
Reference wage
Since 2002, the reference wage used to determine the pension has gradually been calculated over the best 40 years of the career.10 Past wages are uprated using 75% of the consumer price inflation (excluding housing) and 25% of earnings growth (more specifically, earnings declared to social security). In addition, the rate at which past earnings are uprated cannot exceed inflation plus 0.5 percentage points.
Portugal is not the only country that does not uprate with wage growth. Belgium, Estonia, Finland, France, Greece and Spain all uprate with a combination of wages and prices or prices only. In the long term, wage growth is typically higher than price inflation due to productivity gains, which leads to positive real wage growth – even though in the context of the economic crisis wages have not outgrown prices in many countries, including Portugal. Yet, over time, a mix of price and wage uprating tends to lower pensions compared with the usual wage uprating. For example, based on the economic assumptions used in the OECD pension model of 1.25% for long-term real-wage growth, assuming that the other parameters are unchanged, the uprating formula used in Portugal leads to a pension which is about 16% lower for a career of 40 years or more compared with wage uprating.
Compared with wage uprating, a less favourable uprating mechanism is one way to generate savings and improve financial sustainability. For example, a shift to price uprating is generally more accepted and politically easier than a lower accrual rate that would generate the same net saving because it is less well understood by citizens. However, on top of the induced lack of transparency, it has a serious downside. While pension revenues evolve in line with wages, uprating based at least partly (75% in Portugal) on prices make spending less responsive to real-wage growth.
This makes the financial balances of the pension system highly dependent on real-wage growth, i.e. on productivity gains, which is a parameter that is typically difficult to influence for policy makers.11 When real-wage growth is stronger than expected, pension replacement rates decrease, thereby improving finances. Conversely, when real-wage growth is lower than expected, net savings are lower than planned. The fact that pension replacement rates and pension finances become sensitive to productivity developments is an undesirable property of the schemes which do not uprate past earnings with wage growth.
With the same objective in terms of financial balances, it is therefore preferable to shift to wage uprating and lower accrual rates accordingly. For example, to keep the future replacement rate constant, shifting to wage uprating should be accompanied by a 16%-reduction in accrual rates, from about 2.22% today for a 40-year career (see below) to 1.86%, using the assumptions of the OECD pension model.
Accrual
The level of pension benefits is determined by the product of the reference wage and total accruals. For those with 15 to 20 years of earnings, the accrual rate is 2% per year of contributions. This means that the total pension is:
in which w is the reference wage and N is the number of years of contributions.
For more than 20 years of contributions the calculation becomes a bit more complicated. Depending on the level of the reference wage, the annual accrual rate varies between 2% and 2.3%. The thresholds for the different accrual rates are linked to the so-called social support index or indexante dos apoios sociais (IAS, Chapter 2). For an average-wage worker with a 40-year career the average accrual rate is equal to 2.22% (Figure 3.11, Panel A). Accruals stop after 40 years of contributions with bonuses for working longer only applied to working past the retirement age.
Someone entering the labour market at age 20 in 2018 will need to work for 47 years and two months to retire without penalty (see below). Since accrual stops after 40 years of contributions, this means that average accrual rates for longer than 40-year careers are lower than the accrual rates for the first 40 years. For example, over a the full career (47 years and two months), the average accrual rate for an average-wage worker is equal to 2.22% * 40/(47+2/12) = 1.88%.
At the end of someone’s career, the average accrual rate depends on the reference wage in order to ensure that those with lower wages have higher replacement rates for the same career length. That is, the average accrual rate decreases slightly with the reference wage. For example, someone who earns half the average wage over a 40-year career has an average accrual rate of 2.26% compared to 2.08% for those earning three times the average wage (Panel B). This 0.18 percentage-point difference (2.26% - 2.08%) between these cases implies a 7.2 percentage-point difference in the total accrual rates (90.4% for low-wage earners versus 83.2% for high-wage earners).

Source: OECD calculations based on information from Ministry of Labour, Solidarity and Social Security.
Accrual rate comparisons across countries should be carried out with some limitations in mind. Accrual rates capture only one of the elements influencing the pension replacement rates. First, they are expressed as a percentage of the earnings that are “covered” by the pension system, which may differ across countries in particular due to various earning thresholds. Second, they do not account for measures such as the uprating of past wages and sustainability factors, which might affect effective accrual rates. Yet, overall, annual accrual rates around 2% are record high among OECD countries (Figure 3.12).
Portugal has one of the higher accrual rates in the OECD at 1.88% on average over the full career. Only Turkey and Spain have average accrual rates of 2% and over. Austria, Luxembourg and the Netherlands also have high annual accrual rates of about 1.8%. Several countries have much lower rates, such as Estonia, Germany, Norway and Sweden, closer to 1%, with Canada, Japan and the United States having the lowest rates in line with low contribution rates.
High contribution rates help finance high accrual rates. Yet, taking into account the contribution rate of 22.65% and the parameters built into the pension system in Portugal, the estimated annual real rate of return for a full-career worker is around 1.9%. Given the progressive features embedded in the system, the rate of return for less favourable careers is higher, except for early retirement which is heavily penalised. However, the internal rate of return of a financially sustainable pay-as-you-go scheme is the growth rate of the wage bill. Given the expected fall in the size of the labour force (Chapter 1), this internal rate of return is therefore lower than the long-term wage growth rate, which is assumed to equal 1.25% per year in real terms in the OECD pension model. That is, due to high accrual rates while accounting for contribution rate levels, the rates of return promised by current rules are significantly higher than the internal rate of return the pension system finances by itself.
Note: Accrual rates vary by earnings in the Czech Republic, Portugal, Sweden, Turkey and the United States. Accrual rates vary by years of service in Greece, Hungary, Luxembourg and Spain. A full career is from age 20 (in 2018) to the normal retirement age.
Source: (OECD, 2017[4]).
3.4.2. Retirement phase
Eligibility
Eligibility for an old-age pension requires contributions during at least 15 calendar years. From 1994, a calendar year is considered to be at least 120 working days with recorded earnings and contributions. Years with less than 120 days of earnings registration may be aggregated to complete a calendar year. The number of days that exceeds 120 days (either from combined years or single years) are not taken into account for the count of another calendar year.12
Retirement age
The statutory retirement age at which someone is eligible for a full old-age pension was 66 years in 2014. From 2015 onwards, two-thirds of life expectancy gains at age 65 (with a lag of two years) are passed onto increases in the retirement age:
in which m is the number of months to increase compared to 2014 and LE65 is life expectancy at age 65 expressed in years.
For instance, in 2018, the legal retirement age was set at 66 years and 4 months, considering two-thirds of the gains in life expectancy between 2015 and 2016. The increase in the retirement age is rounded to the nearest full month.
However, from age 65, the retirement age without penalty can be reduced (from the legal retirement age) by four months for each year of contributions exceeding 40.13 Thus, for someone with a full career, the pass-through from life expectancy gains to changes in the normal retirement age is actually one-half ( = 2/3 divided by (1+1/3) as the reduction of four months per year amounts to one-third).
Plotting the retirement age over time, using life-expectancy projections to estimate future retirement ages based on current rules, the statutory retirement age will reach 69.5 in 2066 (Figure 3.13). However, taking into account the reduction for contributory careers over 40 years, this means that those entering the labour market at age 20 in 2018 could retire with a full pension after a full career at age 67 and two months in 2066. This is the future normal retirement age in the OECD simulations in this section. Someone who entered the labour market at age 20 can still retire at age 65 in 2022 after a full career.14

Note: The normal retirement age is defined as the age at which someone who entered the labour market at 20 can retire after a full career without any reduction to the pension.
Source: OECD calculations based on information from Ministry of Labour, Solidarity and Social Security.
Indexation
Indexation of pensions in payment used to be discretionary in Portugal. Pensions were indexed according to salaries, prices and other politically relevant macro-economic figures, but it was up to policy makers to determine the exact amount of indexation. This type of indexation allowed for extensive political discretion in pensions adjustment, including extraordinary increases.
In 2007, detailed rules for indexing pensions, taking into account the evolution of prices and GDP growth, were adopted for the first time (see below) but then suspended for several years due to the financial crisis and the deterioration of public finances. Between 2011 and 2015, only low pensions were indexed.15 In addition, there was also an extraordinary increase of up to EUR 10 in monthly pensions (from the general regime and CGA) lower than 1.5 times IAS in 2017 and 2018. The increase was limited to EUR 6 for pensions that had been increased between 2011 and 2015.
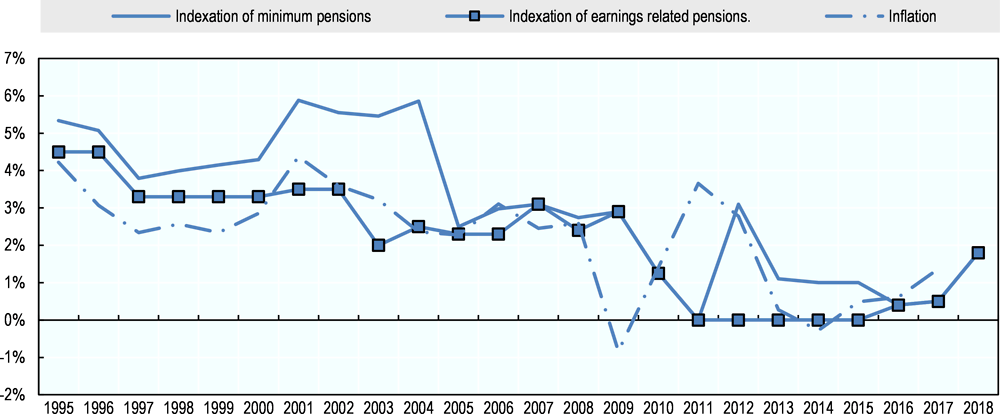
Indexation of minimum pensions has been almost consistently larger than price inflation since 1990 with the exception of a few years since the financial crisis (Figure 3.14).16 Indexation of earnings-related pensions, on the other hand, was below inflation on several occasions, most notably when indexation was suspended. On average since 2000, minimum pensions were indexed by inflation plus 0.7 percentage point while earnings-related pensions were indexed by inflation minus 0.4 percentage point.
Source: Ministry of Labour, Solidarity and Social Security and OECD statistics.
The automatic indexation rule was reinstated in 2016 and slightly adjusted in 2017 by raising the threshold of the lowest pension bracket (Table 3.2). There are different rules depending on the levels of pensions, with the lowest pensions being indexed with the same formula used for the social support index (IAS), from inflation to inflation plus 20% of real GDP growth depending on the level of growth. The lower the pensions, the more favourable the indexation formula, with an order of magnitude of the yearly difference of about 0.5-0.7 percentage points (Figure 3.15).
This means that as people age during retirement, the differences between low and high pensions are gradually compressed. If, for instance, annual real-GDP growth is less than 2%, someone with an initial pension of 2.5 times the average wage (more than six times the IAS) will experience a real drop of 7.1% over a period of ten years to 2.1 times the average wage based on OECD assumptions used in pension modelling.17 During the same period, someone with a pension up to two-thirds of the average wage (two times the IAS) will not experience a real drop in pension benefits ending up at 59% of the average wage. Hence after ten years, the relative pension in these cases falls from by 7% from 3.75 to about 3.5.

Source: OECD calculations based on information from Ministry of Labour, Solidarity and Social Security.
The medium pension bracket (Table 3.2) starts at 2 IAS, which is roughly equal to two-thirds of the average wage. These pensions are indexed below inflation if real GDP growth stays subdued. Sub-inflation indexation should as much as possible be limited to high pensions. Also, the jump in the indexation pattern as a function of GDP growth is not ideal and could be smoothed as argued in Chapter 2.
Between 1995 and 2017 real GDP grew on average by 1.4% per year, exceeding 2% between 1995-2000, in 2007 and in 2017 only. If the current indexation rules had been applied in the past, low pensions would have outperformed prices, growing slightly less than wages (Figure 3.16). Median pensions would have largely followed prices except for the period since the start of the financial crisis in 2007. Finally, higher pensions would have risen with prices until 2001 but fallen behind rapidly afterwards.

Source: OECD calculations based on information from Ministry of Labour, Solidarity and Social Security.
Gross replacement rates
Phased in changes in the benefit formula of the Portuguese pension system will have a profound impact on pensions. The European Commission estimates that the replacement rate of a full-career average-wage worker entering at age 25 and retiring at the earliest age possible without penalty in 2056 will be 8.6 percentage points lower than someone retiring in 2016, implying a lower pensions of 11% (European Commission, 2018[5]). This is one of the largest drops in replacement rates in Europe.
Nevertheless, replacement rates will still be relatively high in international comparison. For the OECD base case scenario – someone entering the labour market at age 20 in 2018 and retiring at the normal retirement age after an uninterrupted career – the gross replacement rate for an average-wage worker will be 74.5% compared to an OECD average of 52.9% (Figure 3.17).18 Only Austria, Denmark, Italy, Luxembourg and the Netherlands have a higher future replacement rate.
Low earners (half the average wage) with a full career get a similar replacement rate (76.1%) as average-wage workers in Portugal. This is because accrual rates are only mildly progressive as shown above. By contrast, for the OECD average the replacement rate for low-wage earners is about 12 percentage points higher than for the average-wage case. The reason for higher replacement rates for low earners in some countries is because of more progressive mandatory pension systems. The most extreme case is New Zealand where everyone gets the same flat-rate benefit, the basic pension, regardless of earnings. However, at 64.6% the OECD average replacement rate of low earners is still much lower than in Portugal.

Note: Entry at age 20 in 2016 (2018 for Portugal), retirement at the normal retirement age at the average or half the average wage throughout an entire uninterrupted career. Normal retirement age in brackets.
Source: OECD pension model.
Beyond accrual rates, one reason for the relatively high replacement rate in Portugal is the comparatively high normal retirement age. Based on current legislation, it will increase from 65 in 2016 to 67 years and two months in the future, against 64.3 and 65.8 on average in the OECD. Given Portugal’s pension rules, retiring at the future OECD average normal retirement age of 66 years would generate a replacement rate of 48.3% for the average-wage worker - compared with 52.9% in the OECD – sharply below 74.5% at age 67 years and two months. Among this reduction of 26.2 percentage points, only three points come from lost accrual, the rest stemming from the penalty on early retirement (see below).
Moreover, the full-career assumption is a best-case scenario. In 2016, the average contribution period was equal to 26.5 years for women and 31.3 years for men (Chapter 2). Someone who works only 31 years until the future official retirement age (70 in 2068) will have a pension that is about 20% lower than in the full-career case. Chapter 5 provides greater details about the impact of incomplete careers on pensions. In addition, the impact of early and late retirement on pension benefits are discussed below. Overall, as shown in the preceding section, the current average pension from the general scheme is relatively low at 36% of the average wage, reflecting low wages and employment in the past.
Net replacement rates
Pensioners usually pay a lower average income tax rate than workers since pensions are typically lower than labour earnings and tax systems are progressive. They also pay a lower contribution rate as for example no unemployment and pension contributions are levied on pension benefits. In addition, in several OECD countries, pensions are less taxed than labour income at the same income level. More than half OECD countries have a higher tax-free allowance and some countries like Turkey do not tax pensions at all. In Portugal, pensions are liable for tax purposes in the same way as labour income.19 Pensions are exempt from social security contributions.20
The net replacement rate (individual net pension entitlement divided by net pre-retirement earnings) matters more to individuals than the gross replacement rate, as it reflects their disposable income in retirement in comparison to when working. For Portugal, the future net replacement rate for the full-career average-wage worker is 89.9% compared to a gross replacement rate of 74.5% (Figure 3.18). On average in the OECD, the net replacement rate is 62.9%, well below Portugal’s replacement rate, which is the fifth highest in the OECD.

Note: Normal retirement age in brackets.
Source: OECD pension model.
3.4.3. Early and late retirement
Rules for early retirement
Retirement before the normal pension age is possible for every insured person aged at least 60 who have completed a contribution period of 40 calendar years with registered earnings. In case of long-term unemployment (having exhausted access to unemployment benefits) an early pension is possible from age 62, provided that the unemployed person was 57 or older when she became unemployed and completed the minimum qualifying period (15 years) (Chapter 5). For those aged 52 or over when becoming unemployed with contributions for 22 years, an early pension is also possible from the age of 57.
In all of these cases pension benefits are reduced. First a general reduction, based on the sustainability factor (which is still in place for early retirement), is applied regardless of the number of months of early retirement. The sustainability factor for the year of retirement is calculated as life expectancy at age 65 in 2000 divided by life expectancy at age 65 in the year before retirement:
This reduction – one minus the sustainability factor - is equal to 14.5% in 2018 and if consistently applied it is expected to rise to 31.0% in 2065.
On top of that, a reduction of 0.5% is applied for each month of early retirement preceding the normal retirement age. For example, in 2018 the official retirement age is 66 and four months. Retiring one year earlier for someone with 40 years of contributions would lower benefits by 6% on top of the sustainability factor.
Early retirement because of long-term unemployment results in a lower penalty. Only the sustainability factor is applied in the case of retiring because of long-term unemployment after the age of 62. Someone retiring between ages 57 and 62 because of long-term unemployment will only have a reduction of 0.5% for each month of retirement before age 62 on top of the sustainability factor.
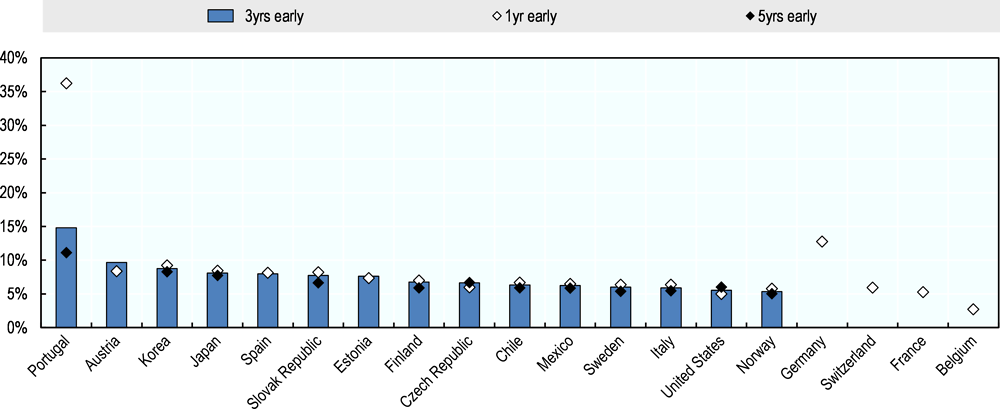
Portugal stands out among other OECD countries in terms of penalties for early retirement. Retiring one year earlier than the normal retirement age in Portugal will lead to a permanent benefit reduction of 36.2% (Figure 3.19).21 The largest part of the penalty in Portugal comes from the sustainability factor, which now applies to early retirement only. On top of the sustainability factor the benefits are reduced by 0.5% per month of early retirement. The country with the second highest penalty for one year of early retirement is Germany with a 12.8% penalty.
Since the sustainability factor is applied for early retirement regardless of the distance to the retirement age, the average penalty per year of early retirement goes down with the number of anticipation years. With more months of early retirement, the direct monthly penalty gains in importance. Overall, three years of early retirement will reduce the pension with 14.8% per year of early retirement (or 44.5% in total). On average for other countries where such early retirement is possible (the 14 countries which appear with Portugal on the left of Figure 3.19), the average impact of retiring three years earlier on benefits will be a loss of 7% per year of anticipation, less than half the penalty in Portugal. In these countries, this allows older workers to choose the retirement age more flexibly several years before the normal retirement age, with adjustments of benefits which lower or neutralise the financial cost without overly penalising early retirees. In Portugal, future penalties are prohibitively large. Early retirement without additional penalty beyond the sustainability is possible from age 62 through unemployment (Chapter 5).
Given longer life expectancy, the age of 60 for the eligibility to standard early retirement is too low. This age reference contributes to shaping social norms and influencing behaviours by both employees and employers about working at older ages; it is not consistent with other efforts to enhance the labour supply of older workers. Moreover, as it is associated in Portugal with very detrimental penalties, maintaining such a low age threshold could induce people to make bad choices. This is difficult to justify by the saving of public money generated.
Source: OECD calculations.
The share of people taking early retirement has gone up since 2006 among women. In 2006, 9.4% of men and 4.0% of women aged 55-69 received early-retirement benefits (either standard early-retirement benefits or because of long-term unemployment) (Figure 3.20). By 2016, these numbers rose to 9.7% and 6.3%, respectively.22 Only the incidence of normal early-retirement for men was lower, but this decline was more than offset by the increase in early retirement because of long-term unemployment. One potential reason for the divergent directions of the two early-retirement schemes is the heavy penalty associated with standard early retirement compared to the reduced penalty for early retirement because of long-term unemployment. For women both forms of early retirement have risen.
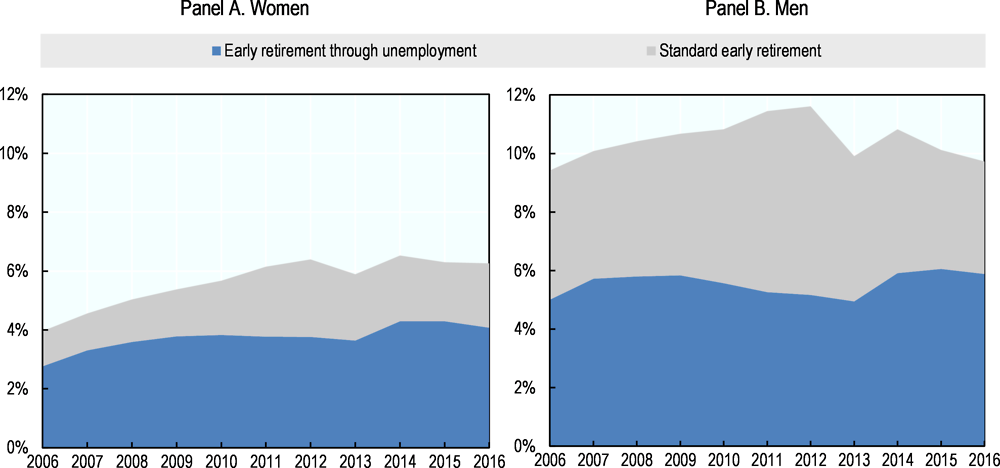
Source: OECD calculations based on Portuguese social security data.
Rules for late retirement
It is also possible to defer retirement and remain in the labour market beyond the legal retirement age.23 In Portugal 6.8% of the 55-69 year olds even combine working and receiving a pension, slightly more than in the EU on average (6.2%) (OECD, 2017[4]). When deferring retirement, the old-age pension is increased by a bonus per month of deferral (Table 3.3), which rate varies between 0.33% and 1% according to career length. The 1% bonus seems large, but as discussed above, pension entitlements before any bonus applies stop accruing after 40 years of contributions. Moreover, pension benefits including bonus cannot exceed 92% of the reference wage.
The combination of this bonus structure and the 92% cap blurs the picture of the actual incentives to work longer after the retirement age. Depending on the career length, given the bonus rules, the 92% cap is reached in some cases after a short extension only (Figure 3.21). For example after a career of 27 years, given the annual accrual rate of 2.22% (Figure 3.11 above), the ceiling is reached after five years (60 months) of deferral. Someone with a 40-year (or longer) career is eligible for the maximum deferral rate (1% bonus per month of deferral), but the ceiling applied to total accruals is already reached after deferring for 0.3 years (four months). After that accruals stop.
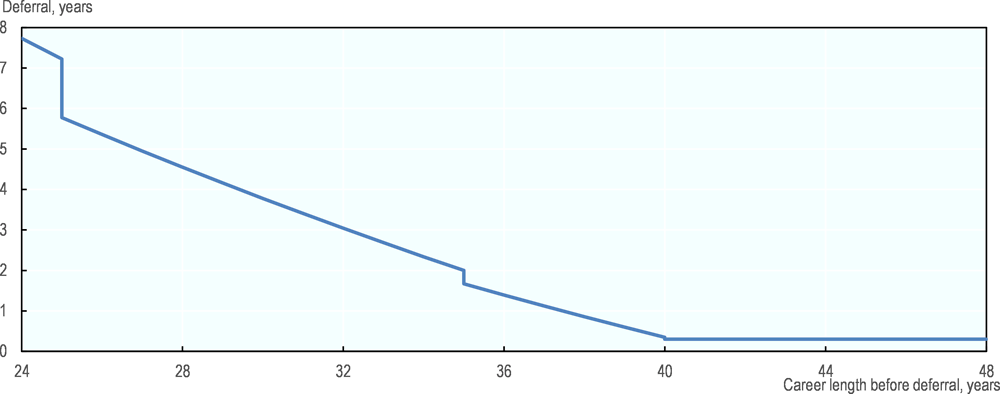
Reading note: The 92% cap is reached by postponing retirement by five years after a 27-year career. After a career of 27 years, the annual accrual rate for an average-wage worker is 2.22% (Figure 3.11, Panel A), leading to 59.9% total accruals. Postponing retirement for five years (60 months) would lead to a bonus of 5*12*0.5% = 30% and 5*2.22%=11.1% additional accrual, implying that the maximum accrual of 92% is exceeded (92% < (59.9%+11.1%)*130%=92.4%).
Source: OECD calculations.
Deferring a pension beyond the retirement age increases benefit levels in many countries significantly (OECD, 2017[4]). Figure 3.22 shows the impact of deferring pensions and continuing to work for a full-career worker on annual benefits summed over all pension schemes. Across OECD countries, the combined overall increase – from the deferral rate, additional entitlements and benefit indexation - averages about 7.5% per year of deferral, and the yearly average bonus depends only slightly on the length of the deferral. Four countries record a large impact of working longer on pensions, with bonuses much larger than implied by actuarial neutrality (OECD, 2017[4]): Estonia, Iceland, Japan and Korea.
In Portugal, given high accrual rates and the 92% cap, delaying retirement increases benefits only slightly as the uprating of past wages is slightly more favourable than indexation of pensions in payment. This means that for the first year of continuing to work and deferring pensions an average-wage worker receives 5.4% extra, less than in most other countries. For someone at half the average wage the bonus is even lower as accrual rates are higher at lower wages, which makes the 92% ceiling more quickly binding.
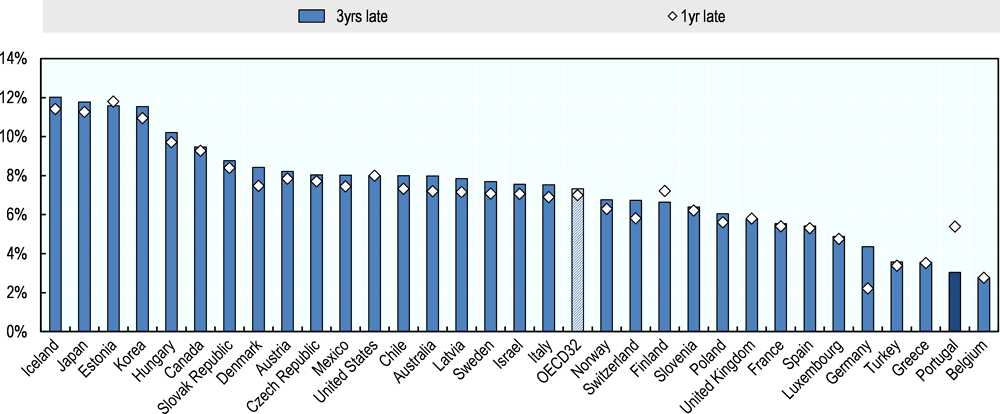
Note: Figures for three years late have been annualised, so a 6% increase shown in the chart means a total of 18% for three years. It is not possible to defer the basic pensions in Ireland, the Netherlands or New Zealand so they are not included in the chart. In France, the one-year bonus applied to the occupational pension, between 10 and 30% depending on the length of deferral, has been spread across the entire retirement period based on the annuity factor.
Source: OECD pension models.
3.5. Other pension schemes
3.5.1. Survivor pensions
Women’s employment rates have historically lagged behind men’s and female pensioners are typically more reliant on first-tier pensions, their partner’s pensions or survivor pensions. As a result, poverty levels are higher among older women than among older men in all OECD countries, with the over-75s more at risk of poverty than the 66-to-75 year-olds due to cohort effects and indexation (OECD, 2017[6]).
The average gender pension gap, measuring how much lower pensions are for women compared to men, was 31% in Portugal in 2016, above the OECD26 average of 25%. Austria, Germany, Luxembourg and the Netherlands record a gender gap that is larger than 40% (Figure 3.23). However, with growing female employment women’s entitlements to earnings-related pensions have been increasing which will contribute to narrowing the gap in many countries.
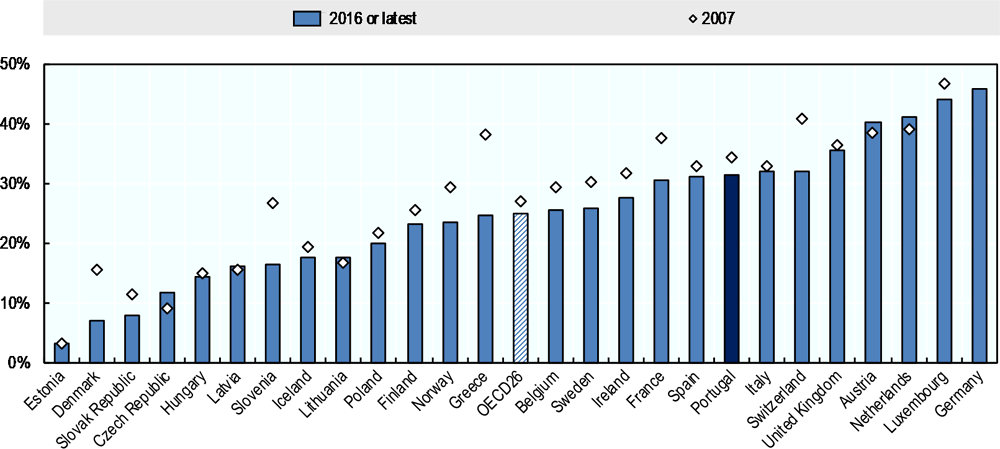
Note: The gender gap in pensions is defined as: (1-(women’s average pension / men's average pension))*100. “Pensions” include public pensions, private pensions, survivor’s benefits and disability benefits. The gender gap in pensions is calculated for people aged 65 and older only.
Source: OECD calculations based on EU-SILC 2017 data for all countries except Germany; European Commission calculations based on EU-SILC for Germany.
Survivor pensions, like old-age pension in general, have historically pursued two main goals. First, they protect widows or widowers from poverty risks when the pension income of a spouse is no longer available. Survivor pensions prevent disposable income from falling to low absolute levels. Second, they contribute to consumption smoothing, insuring against the decrease in standards of living relative to the situation before the death of a spouse.
Survivor benefits, in particular, play an important role in reducing gender pension gaps as almost 90% of recipients of survivor pensions in the OECD are women (OECD, 2018[7]). This is because women accrue less own pension entitlements, live longer and are generally the younger partner in couples. On average across OECD countries, there is one recipient of survivor pensions for each 4.5 recipients of old-age pensions (Figure 3.24). While there are few recipients of survivor benefits in Australia and Northern Europe, there is close to one recipient for each two old-age pension recipients in Spain and one in three in Portugal where 82% are women.
Note: See (OECD, 2018[7]).
Source: (OECD, 2018[7]).
Spending on survivor pensions is a substantial category of social expenditure in Portugal, amounting to 1.9% of GDP against 1.0% on average in the OECD. Only Denmark, Greece, Italy and Spain spend substantially more (Figure 3.25).

Note: Data on survivor pensions in mandatory private schemes in Australia, Denmark (ATP), Estonia, Israel, Mexico, Norway, the Slovak Republic and Sweden are not available.
Source: (OECD, 2018[7]).
In Portugal, in case of death of a spouse, the surviving spouse, ex-spouses, civil partner and descendants are entitled to a survivor pension.24 In order to receive survivor benefits, the deceased should have contributed for at least three years. Spouses should have been married for at least one year at the time of death, ex-spouses should receive alimony at the time of death and civil partners of the deceased should have been a legal partner for two years at least. Remarriage or a new civil partnership leads to the termination of survivor benefits.
Consistent with the OECD average (OECD, 2018, p. 228[7]), survivor benefits are equal to 60% of the deceased’s pension in Portugal, but with no means-testing. However, if the deceased had ex-partners they receive 70% jointly, which is equally split.25 Survivor pensions are received for a period of five years if the surviving (ex-) partner is under the age of 35. If the surviving (ex-) partner is 35 or older, the survivor pension is paid until death.26
Ten OECD countries provide no lower age limits to access survivor pensions for spouses.27 Among the 19 OECD countries which do so, only Austria and Portugal grant survivor pensions to widowed persons younger than 40 years (OECD, 2018, p. 227[7]). Survivor pensions received at such young ages provide disincentives to work and incur costs for public finances. For widowed persons, who have not reached the retirement age, benefits should be temporary – rather than a life-long pension – to help adjust to the new financial situation.
Survivors cannot benefit from economies of scale in the cost of living which couples enjoy. Indeed, living costs do not drop by half upon the partner’s death, even when downsizing accommodation. In Portugal, a spouse who never worked would thus experience a drop of about 15% in standards of living, compared to a 24% average drop among OECD countries (OECD, 2018[7]). This calculation accounts for first-tier benefits and means-testing of survivor pensions in many countries.28
In the Portuguese survivors’ scheme, similar to many other countries, total entitlements of individuals living in a couple including survivor pensions, are larger than those of single individuals with the same contribution history. Hence, singles partly finance survivor benefits without benefiting from it, and such a redistribution from singles to couples might have unintended consequences affecting both equity and total employment (OECD, 2018[7]). This feature can be eliminated by requiring couples to finance survivor pensions. For example, ensuring self-financing of survivor pensions at the 60% replacement rate would correspond to an about 10% reduction of the initial pension level of a person in a couple compared to the pension of a single individual with the same contribution history (OECD, 2018[7]).29 The internalisation of the cost of survivor pensions within couples in a budget-neutral way would thus lead to higher pensions for singles and lower pensions for couples.
3.5.2. Civil servants
Pensions for civil servants are governed by a special regime, the Caixa Geral de Aposentações (CGA). Before 1993, a civil servant in Portugal could retire with a full pension at 60 with 36 years of service (versus 65 and 40 years of service for the general social security regime). The minimum years of service to receive a pension was five years (versus ten years in the general regime in 1993). Early retirement was possible from the age of 55 with 30 years of contributions until 1985 and afterwards with 36 years of contributions regardless of age. The benefit calculation was also more generous with higher earnings-related pensions and a higher minimum pension than in the general regime. Benefits were calculated based on the last wage rather than the best ten years of the last 15. The accrual rate was 2.5% of the wage (net of social security contributions) versus 2% in the private sector.
In 1993, it was decided that the CGA and the general regime would converge and that the civil service scheme would be closed for new entrants by 2006. For new retirees among civil servants the retirement age would gradually converge by 2015, the minimum years of service and the career length, after which maximum accrual is reached, would be equalised, and the benefit calculations would follow the rules of the private sector. Pensions of civil servants who entered before 1993 would still be governed under the old rules.
The 2006 reform sped up the convergence and the new rules also apply to civil servants who entered before 1993. From 2006, all accruals have been calculated following private-sector rules, while past entitlements were not touched. The full-career length reached 40 years in 2013. However, for certain civil-service professions the convergence is slower. The retirement age for nurses and primary school and kindergarten teachers will only reach 65 by 2019 and 2022, respectively, and will remain at that age, not following the general increase in the retirement age with life expectancy. From age 70 retirement is mandatory for all civil servants.30
To summarise, civil servants who retired before 2006 were the ones not affected by the reform. The rules have converged to the general regime over time and, even for civil servants who entered service before 2006, rules have been fully aligned to those in the general regime. Only the administration of pensions differs.
Although the transition to fully phase out the civil-servant scheme takes time and past entitlements cannot be adjusted, the consolidation of CGA with the private-sector scheme is assured under current legislation. Assuming that no one entered public service younger than 18 in 2006, it is expected that the last civil servant retiring at the official retirement age under the old regime will retire in 2057 on a pension in line with the general regime. Yet, this means that CGA will operate for the most part of the 21st century, generating administrative duplication and costs. Overall, the average pension in the civil-servant scheme is still (at EUR 1 074 in 2016) more than double the average pension in the general scheme.
With the gradual closing down of the civil servant scheme Portugal has moved in the direction of most OECD countries. Countries who recently integrated the civil servant scheme to the private-sector scheme include Italy, Japan, Greece, New Zealand, Spain and Turkey. Currently, only Belgium, France, Germany and Korea have entirely separate schemes for civil servants. Ten OECD countries have integrated schemes, offering a top up for civil servants, which is large in some countries, including the United Kingdom and the United States (OECD, 2016[8]).
3.5.3. Special regimes
Old-age pensions are available without additional penalty (but with the sustainability factor applied) between age 45 and 60 for some professions considered arduous, such as seafarers and sea-fishermen (age 55), underground miners (50), air traffic controllers (58), professional dancers (classical ballet and contemporary – 45) and embroiderers from the island of Madeira (60).
3.6. Policy options
Portugal has profoundly reformed its pension system over the past decades, thereby enhancing its financial sustainability. Major reforms include: increasing the period to calculate the reference wage; aligning the retirement age between women and men; linking the retirement age to life expectancy; and gradually integrating the scheme for civil servants with the general regime. Moreover, the introduction of minimum pensions was an important step to provide adequate pensions while and indexation rules were formalised which will stabilise benefits in real terms.
However, the current pension system can still be improved. First, the current practice in the benefit calculation of uprating past wages with a combination of prices and wages instead of the standard wage uprating generates savings and improves finances. However, it has a serious downside. While pension revenues evolve in line with wages, uprating based mostly on prices makes spending (and pension benefits) less responsive to real-wage growth. This makes the financial balances of the pension system and pension replacement rates highly dependent on real-wage growth, i.e. on long-term productivity gains. This dependence is an undesirable property, because productivity developments are difficult to predict and difficult to influence by policies. With the same objective in terms of financial balances and pension levels, it is preferable to shift to wage uprating and lower accrual rates accordingly – which are currently very high.
As for pensions in payment, medium pension levels (between two and three times the IAS) should be price-indexed instead of price minus 0.5 percentage points currently (when real GDP does not grow faster than 2%). An indexation of less than prices erodes standards of living during retirement and jeopardises pension adequacy. Since pensions between two and three times the IAS are not high, this should be avoided. Here also, lower accrual rates in the contribution phase can help increase indexation in a budget neutral way. In addition, the current design of indexation rules based on real-GDP growth creates unnecessary steps in the level of indexation, and could be smoothed to eliminate abrupt changes to mildly differing real-GDP growth rates.
The link between the retirement age and life expectancy now plays a key role and should be implemented as planned, and extended to the minimum age of early retirement, which at 60 years is currently too low. Special retirement ages for certain professions should be abolished. Instead, life-long learning should facilitate late career switches from arduous jobs to jobs suitable to be maintained at an older age. Moreover, early retirement through unemployment should be abolished (Chapter 5).
Abolishing the sustainability factor only for retirement at or after the normal retirement age in 2014 created very large differences in pension benefit levels for those retiring before the normal retirement age. Moreover, these differences will grow with life expectancy gains which are built into the sustainability factor. Generating financial savings now crucially depends on the increase in the retirement age, the heavy penalty for early retirement and the indexation of pension in payments. Indeed, as it currently stands, early retirement is legally possible, but with extremely high future penalties. This can lead to fiscal savings when people make short-sighted decisions and end up with very low pension entitlements. Instead, early retirement should be discouraged by raising the current 0.5% penalty per month of early retirement while the sustainability factor, properly recalibrated, should be used to adjust all pensions across the board as an ultimate instrument to ensure financial sustainability.
The vesting period of 15 years to be eligible to a pension excludes individuals with very short careers, whether they made high or low contributions. As discussed in Chapter 2 about the recommendation to remove the vesting period for minimum pensions, each year of contribution should generate pension rights from the earnings-related scheme.
Since new pension entitlements for civil servants who remained in the CGA scheme are in all but name the same as pension entitlements of the general scheme, the administration of both schemes should be merged. There is no reason to separate pensions in payment and contributions of both schemes. The merger would create a more accurate picture of pension finances and facilitate the management of the system in a more transparent way while reducing administrative costs.
Survivor pensions should more clearly focus on smoothing survivors’ standards of living (OECD, 2018[7]). In particular, recipients should not be eligible to a permanent survivor pension before the retirement age while surviving partners or ex-partners older than 35 are eligible to survivor pensions until death in Portugal. At these younger ages, a temporary benefit only would be more suitable following the partner’s death to help adapt to the new situation. When the survivor reaches the retirement age, the full survivor pensions can kick in.
Key recommendations
-
Duly implement the link between increases in the retirement age and life expectancy gains.
-
Link the minimum age of early retirement to life expectancy gains. Abolish special retirement ages for specific professions.
-
Modify the way the sustainability factor is applied as its current use overly penalises early retirement. Instead, use the sustainability factor to adjust pension benefits across the board as an ultimate instrument to ensure financial sustainability given the other pension parameters. Once implemented, increase penalties per month of early retirement
-
In the benefit calculation, uprate past wages with wage growth rather than a combination of price inflation and wage growth while lowering accrual rates.
-
Index intermediate pensions (e.g. between 2 and 3 IAS) at least with prices and use lower accrual rates to finance this more generous indexation.
-
Merge the administration of the CGA with the general scheme covering private-sector workers.
-
Raise the eligibility age to a permanent survivor pension to the retirement age.
References
[2] Chuliá, E. and M. Asensio (2006), “Portugal: in search of a stable framework”, in Immergut, Ellen M.; Anderson, Karen M.; Schulze, I. (ed.), The handbook of West European pension politics, https://scholar.google.fr/scholar?hl=en&as_sdt=0%2C5&q=Portugal%3A+in+search+of+a+stable+framework&btnG= (accessed on 20 December 2018).
[1] European Commission (2018), Country Report Portugal 2018 Including an In-Depth Review on the prevention and correction of macroeconomic imbalances, European Commission, https://ec.europa.eu/info/sites/info/files/2018-european-semester-country-report-portugal-en.pdf (accessed on 7 October 2018).
[3] European Commission (2018), “The 2018 Ageing Report: Economic and Budgetary Projections for the EU Member States (2016-2070)”, European Economy Institutional Papers, https://ec.europa.eu/info/sites/info/files/economy-finance/ip079_en.pdf (accessed on 19 June 2018).
[5] European Commission (2018), The 2018 Pension Adequacy Report, Publications Office of the European Union, Luxembourg.
[9] OECD (2019), Independent Fiscal Institutions Review OECD Review of the Portuguese Public Finance Council (CFP), OECD Publishing, Paris.
[7] OECD (2018), Pension Outlook 2018, OECD Publishing, Paris.
[4] OECD (2017), Pensions at a Glance 2017: OECD and G20 Indicators, OECD Publishing, Paris, https://doi.org/10.1787/pension_glance-2017-en.
[6] OECD (2017), Preventing Ageing Unequally, OECD Publishing, Paris, https://doi.org/10.1787/9789264279087-en.
[8] OECD (2016), OECD Pensions Outlook 2016, OECD Publishing, Paris, https://doi.org/10.1787/pens_outlook-2016-en.
Notes
← 1. Healthy life years are estimated on the basis of self-reported health. The reported figures should therefore be interpreted with caution.
← 2. This review includes reforms up to and including 2018. Later reforms were not taken into account in this section, nor in the simulations in this review.
← 3. The adjustment programme was implemented under the supervision of the Troika (European Commission, the European Central Bank and the International Monetary Fund).
← 4. The Portuguese pension system does not have a cap on pension levels.
← 5. For pensions between EUR 600 the thirteenth and fourteenth month were partially suspended.
← 6. After the cut-off date for reforms to be taken into account for this review, the rules concerning the sustainability factor changed. From January 2019 the sustainability factor will not be applied for workers aged 63 or more with a contribution record of at least 40 years at age 60. From October 2019 this measure will be extended to workers aged 60 or more with a contribution record of at least 40 years at age 60. The normal penalty for early retirement, of 0.5% per month of early retirement, will still be applied.
← 7. This is the same rate at which voluntary contributions can be made to the social security pension system by the self-employed.
← 8. With the numbers shown here, the gender pension gap is equal to about 43%. Based on EU-SILC data, which allow for a cross-country comparison, the 2016 gender gap is lower in Portugal at about 31%, but still much higher than the unweighted OECD 26 average of 25% (Section 3.5.1).
← 9. These numbers are based on data underlying Figure 3.7.
← 10. Reference wages before 2002 were determined by the best ten years of the last 15 years of earnings. Reference wages of those who started work before 2002 will gradually be determined the full-carrer wage from a weighted average between the best ten out of the last 15 years and the full career.
← 11. Moreover, uprating past wages mostly with prices essentially gives lower weights to wages earlier in someone’s career, creating path dependence.
← 12. This means that if two people contributed for 110 days in year one and that in year two the first one contributed for ten days while the second one had a full year, both will then record one single year.
← 13. This lower bound of 65 will become less and less relevant as the official retirement age keeps increasing.
← 14. At age 65 the official retirement age can be reduced by 20 months because of an excess of five years over a 40-year career. This means that the projected official retirement age of 66 and four months can be reduced to 65.
← 15. Lowest pensions were typically the lowest level of minimum pension (Chapter 2) and just above.
← 16. Technically this was not indexation for most of the period since the increases were discretionary before 2007 but it served the same purpose as indexation, even if it lacked a transparent rule.
← 17. Assumptions are 2% for annual inflation rate and 1.25% for real wage growth.
← 18. Other assumptions are: price inflation at 2% per year, real earnings growth at 1.25% per year (nominal wage growth of 3.275%). Individual earnings are assumed to grow in line with the economy-wide average.
← 19. The amount of taxes withheld from pension income is lower than from labour income, but the difference has to be paid by May of the next year.
← 20. Moreover, workers aged over 65 with 40 years or more contributions (and their employer) pay a reduced social security contribution rate: 16.4% for the employer and 7.5% for the employee against the usual 11% employee and 23.75% employer contribution.
← 21. This is based on baseline case in which someone enters the labour market at age 20 in 2018 and retires one year before the normal retirement age (i.e. the age at which there would be no pension reduction). The normal age in 2065 is 67 years and two months. The full reduction of the pension compared to someone working until the normal age is 36.2%, which comes from (1-0.690*0.94*0.983) ≈ 36.2%. First, the sustainability factor is applied (0.690) then pension benefits are reduced by 6% because of twelve months of early retirement (0.94) and finally pension indexation is less generous than wage growth, which lowers pensions compared to additional entitlements from people who keep working (0.983).
The 2019 reform discussed in endnote 6 significantly lowers the estimates of the penalties for someone entering the labour market at age 20 and retiring early. However, the penalties presented in this section apply for anyone entering the labour market after age 20 since they do not fulfil the 40 years of contributions requirement at age 60.
← 22. Labour force participation of this age group rose by 0.7 and 1.4 percentage point for men and women, respectively.
← 23. A partial retirement scheme (with partial pension and/or reducing working hours) is currently under discussion. Details on special conditions for partial pensions have not yet been presented.
← 24. In case none of these relatives exist an ascendant can also receive survivor pensions if they were dependent on the deceased.
← 25. Moreover, a survivor pension cannot exceed the amount of alimony payments received at the time of death.
← 26. Those surviving a (safety-net) social-pension recipient are also eligible to 60% of the partner’s social pension on top of their own social pension in case they do not receive any type of earnings-related pension themselves and receive no income other than social pension higher than 40% of the IAS. A single child receives 20%, two children receive 30% jointly (equally split) and three children or more receive 40% jointly. In case there is no surviving partner or ex-partner the children receive the double amount. Children receive survivor benefits until they are 18 or up to 27 if they attend higher education. In case of being granted a disability status the survivor benefits continue to be paid. For ascendants the following shares hold: 20%, 50% or 80% for one, two and three or more ascendants respectively.
← 27. Chile, Ireland, Italy, Korea, Luxembourg, Mexico, the Netherland, Norway Spain and Turkey provide no lower age limits for survivor pensions.
← 28. Portugal is among the few countries where a survivor in a dual-earner couple of two average earners can expect an increase in the standards of living upon the death of the partner (OECD, 2018[7]).
← 29. The exact estimate for the same-age couple retiring at age 66 in Portugal is an 11.4% lower pension relative to a single individual. Calculation is based on the 2015-20 mortality rates, UN (2017).
← 30. Mandatory retirement is the practice of requiring workers to retire at a statutory age. As a result, employers can re-employ them only if they have retired and on a new contract. From 2019 it is possible for civil servants in Portugal to be reemployed after mandatory retirement at age 70 on six-month renewable contracts for a maximum of five years total.