
copy the linklink copied!1. Towards a circular economy in Umeå, Sweden
This chapter provides an overview of the circular economy in cities and focuses on the rationale for the circular economy transition in the city of Umeå, Sweden, by looking at main drivers leading to a shift from a linear to a circular economy, and socioeconomic and environmental data and trends.
copy the linklink copied!Introduction: The circular economy in cities and regions
The transition to a circular economy is underway and cities and regions are at the centre of it. By 2050, the global population will reach 9 billion people, 70% of which will be living in cities (UN, 2018[1]). The pressure on natural resources will increase, while new infrastructure, services and housing will be needed. Already, cities represent almost two-thirds of global energy demand (IEA, 2016[2]) and produce up to 80% of greenhouse gas emissions (World Bank, 2010[3]). By 2050, urban dwellers will still be the most exposed to high concentrations of air pollutants1 (OCDE, 2012[4]). Cities produce 50% of global waste (UNEP, 2013[5]). It is estimated that globally, by 2050, the levels of municipal solid waste will double (IEA, 2016[2]; UNEP/IWSA, 2015[6]). A total of 80% of food is consumed in cities and compared to today’s levels, 60% more food will be required in the coming decades to feed the population (Ellen MacArthur Foundation, 2019[7]). At the same time, water stress and water consumption will increase by 55% by 2050 (OCDE, 2012[4]). Cities and regions have core responsibilities for local public services such as transport, solid waste, water and energy. As such they are at the centre of key decisions having a strong impact on citizens’ well-being, environmental quality and economic growth.
There is no unique definition for circular economy, which is now facing a validity challenge period. Although there are many definitions of the circular economy, they all include as a basic assumption the recognition of waste as a resource (Box 1.1). The circular economy is about preventing wasted resources through reusing materials, improving design to increase the durability of goods and products, and transforming waste. In cities and regions, the circular economy should ensure that: services (e.g. from water to waste and energy) are provided whilst preventing waste generation, making efficient use of natural resources as primary materials, optimising their reuse and allowing synergies across sectors; economic activities are planned and carried out in a way to close, slow and narrow loops across value chains and infrastructure is designed and built to avoid linear locks-in, which use resources intensively and inefficiently.
The circular economy is not an end per se, but a means to an end: it provides an opportunity to do more with less, to better use available natural resources and to transform waste into new resources, while promoting new jobs opportunities and tackling inequalities (e.g. access to sharing services and commodities, form mobility to agro-food, to buildings). As such, while the environmental narrative, whereby less use of materials implies reduced greenhouse gas (GHG) emissions has been so far predominant in promoting the shift to a circular economy, cities and regions are increasingly paying attention to the social and the economic aspects, as drivers for this transition. According to Blomsma and Brennan (2017[8]), the circular economy is now facing its “validity challenge period” on its way to becoming a robust and consolidated concept, implying a radical shift in consumer behaviour.
“The circular economy is where the value of products, materials and resources is maintained in the economy for as long as possible, and the generation of waste minimised.” (EC, 2015[9])
“The circular economy is restorative and regenerative by design. Relying on system-wide innovation, it aims to redefine products and services to design waste out while minimising negative impacts. A circular economy is then an alternative to a traditional linear economy (make, use, dispose).” (Ellen MacArthur Foundation, 2018[10])
“An economic system that replaces the end-of-life concept, with reducing, alternatively using, recycling and recovering materials in production/distribution and consumption processes. It operates at the micro level (products companies, consumers), meso level (eco-industrial parks) and macro level (city, region, nation and beyond), with the aim of accomplishing sustainable development, thus simultaneously creating environmental quality, economic prosperity and social equity, to the benefit of current and future generations. It is enabled by novel business models and responsible consumers.” (Kirchherr, Reike and Hekkert, 2017[11])
“The circular economy is one that has low environmental impacts and that makes good use of natural resources, through high resource efficiency and waste prevention, especially in the manufacturing sector, and minimal end-of-life disposal of materials.” Ekins et al. (2019[12])
“There are three different layers of circularity, with increasingly broad coverage: i) closing resource loops; ii) slowing resource loops; and iii) narrowing resource loops. All these explicitly or implicitly aim at addressing the market failures associated with materials use, the failure to address local environmental consequences associated with extraction; or the failure to include the environmental externalities associated with waste generation. Furthermore, there are economic inefficiencies associated with the inefficient use of scarce resources.” (OECD, 2019[13]).
Source: EC (2015[9]), Closing the Loop – An EU Action Plan for the Circular Economy, https://eur-lex.europa.eu/legal-content/EN/TXT/HTML/?uri=CELEX:52015DC0614&from=EN (accessed on 21 February 2020); Ellen McArthur Foundation (2018[10]), What is a Circular Economy?, https://www.ellenmacarthurfoundation.org/circular-economy/concept (accessed on 21 February 2020); Kirchherr, J., D. Reike and M. Hekkert (2017[11]), “Conceptualizing the circular economy: An analysis of 114 definitions”, https://doi.org/10.1016/j.resconrec.2017.09.005; Ekins et al. (2019[12]), “The Circular Economy: What, Why, How and Where”, Background paper for an OECD/EC Workshop on 5 July 2019 within the workshop series “Managing environmental and energy transitions for regions and cities”, Paris; OECD (2019[13]), Global Material Resources Outlook to 2060: Economic Drivers and Environmental Consequences, https://doi.org/10.1787/9789264307452-en.
The circular economy in cities and regions is expected to generate a positive impact on economic growth, the creation of new jobs and the reduction of negative impacts on the environment. By 2030, shifting from a linear approach of “take, make and dispose” to a circular system is estimated to hold a potential of USD 4.5 trillion for economic growth (Accenture, 2015[14]). Projections show that, by 2030, resource productivity in Europe can improve by 3% and generate a gross domestic product (GDP) increase of up to 7% (McKinsey Centre for Business and Environment, 2016[15]). Projections at the city level show that for example, applying a circular economy approach to the construction chain in the city of Amsterdam (Netherlands) would decrease GHG emissions by half a million tonnes of CO2 per year. In London (United Kingdom), the benefits from circular approaches applied to the built environment, food, textiles, electricals and plastics are estimated at GBP 7 billion every year by 2036.2 About 50 000 jobs related to the circular economy are estimated to be created in the Île-de-France region.3 Environmental benefits consist of: decreased pollution; increased share of renewable or recyclable resources; and reduced consumption of raw materials, water, land and energy (EEA, 20016[16]). Yet, the transition should be “just” by taking into account people’ social well-being, quality of life and equity.
The potential of the circular economy still needs to be unlocked. Today, less than 10% of the global economy is circular (Circle Economy, 2020[17]). Unlocking the potential of the circular economy in cities and regions implies going beyond solely technical aspects and putting the necessary governance in place to create incentives (legal, financial), stimulate innovation (social, institutional) and generate information (data, knowledge, capacities). It would also mean looking at the barriers for businesses to “close the loops”, by re-thinking business models (e.g. leasing and sharing) and analysing the economic instruments that could support the transition in several sectors, including waste, food, built-up environment and water. The circular economy implies governance models based on multi-stakeholder and multi-sectoral approaches. For the circular economy to happen, policies need to be aligned, stakeholders informed and engaged, legal and regulatory frameworks updated and in support of innovation.
copy the linklink copied!The drivers for the circular transition in Umeå, Sweden
The circular economy in Umeå, Sweden, is perceived as a new socioeconomic paradigm leading to new ways of conceiving business, products (design) and consumption (sharing). Figure 1.1 indicates the words that the city through the OECD Survey on the Circular Economy in Cities and Regions most associates with the circular economy concept (the bigger the word in the figure, the higher the importance) (OECD, 2019[18]). These words are: “business model”, “design” and “sharing”. In the fastest-growing urban centre in Northern Sweden, where a number of bottom-up initiatives to increase resource efficiency are flourishing, the circular economy represents a represent a new socioeconomic paradigm through which to stimulate businesses, while achieving the environmental goal of carbon neutrality by 2040.
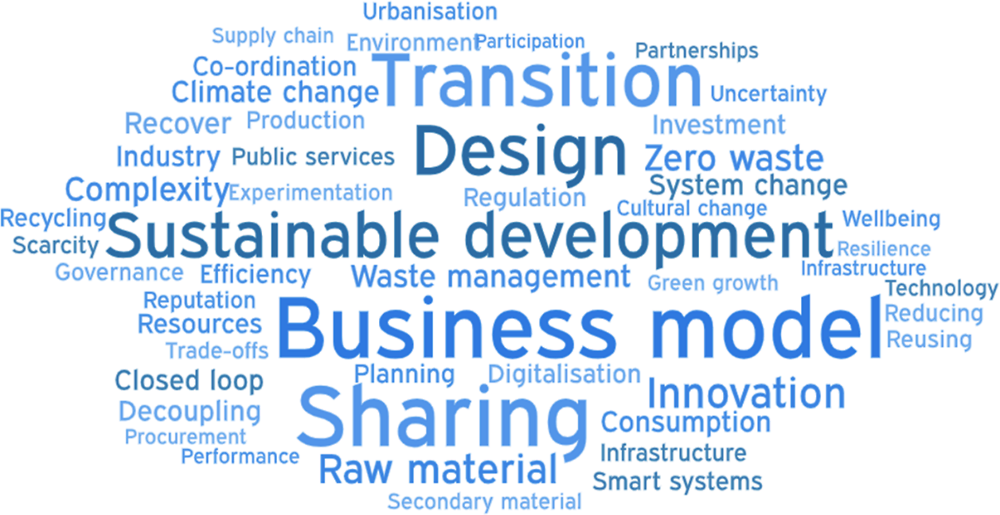
Note: The respondent had to choose the top 5 words most often associated with the circular economy. The answer is based on the following question: “Please indicate the top 5 words from the list suggested below you most often associate with the circular economy in your context, ranking from 1 (most important) to 5 (less important)”.
Source: Own elaboration based on the city of Umeå’s answers to the OECD (2019[18]) OECD Survey on the Circular Economy in Cities and Regions.
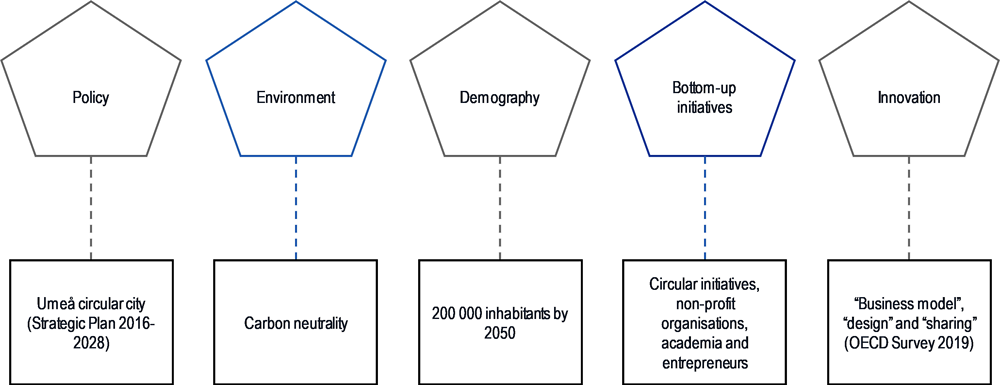
The city of Umeå made the circular economy a priority in its Strategic Plan 2016-28. Umeå is the capital of Västerbotten County located in the North of Sweden (Figure 1.2). Västerbotten County encompasses the province of Västerbotten and part of the Lapland and Ångermanland provinces (Box 1.2). It shares borders with the Finnish Vaasa region and Norway. The Strategic Plan 2016-28 Plan states that Umeå should be a role model in the circular economy (Municipality of Umeå, 2016[19]). While the municipality is working on how to concretise this goal, it can build on its long experience in the integrated treatment of the waste, energy and water. Figure 1.3 shows the main drivers for the circular economy transition in Umeå presented in this chapter.
Sweden is composed of 20 counties and 290 municipalities. Municipalities are responsible for several facilities and services such as housing, roads, water supply and wastewater processing, schools, public welfare, elderly care and childcare. The municipalities are entitled to levy income taxes on individuals, and they charge for various services. The county council is responsible for health, regional development and public transport. The County Administrative Board is a governmental authority representing a link between citizens and levels of government. It is responsible for infrastructure planning, sustainable community planning and housing, energy and climate and cultural environment, amongst others.
Since 2008, the Västerbotten County Council and the county’s 15 municipalities constitute Västerbotten Region, a co-operative body that is responsible for regional development in Västerbotten County. Västerbotten Region has responsibilities in five key areas of work: healthcare, social welfare, public transport, regional development and culture, and research, innovation and education.
Source: Swedish Institute (2019[20]), The Swedish System of Government, https://sweden.se/society/the-swedish-system-of-government/; Västerbotten Region (2019[21]), This is What the Region Does, www.regionvasterbotten.se/det-har-gor-regionen (accessed on 23 January 2020).
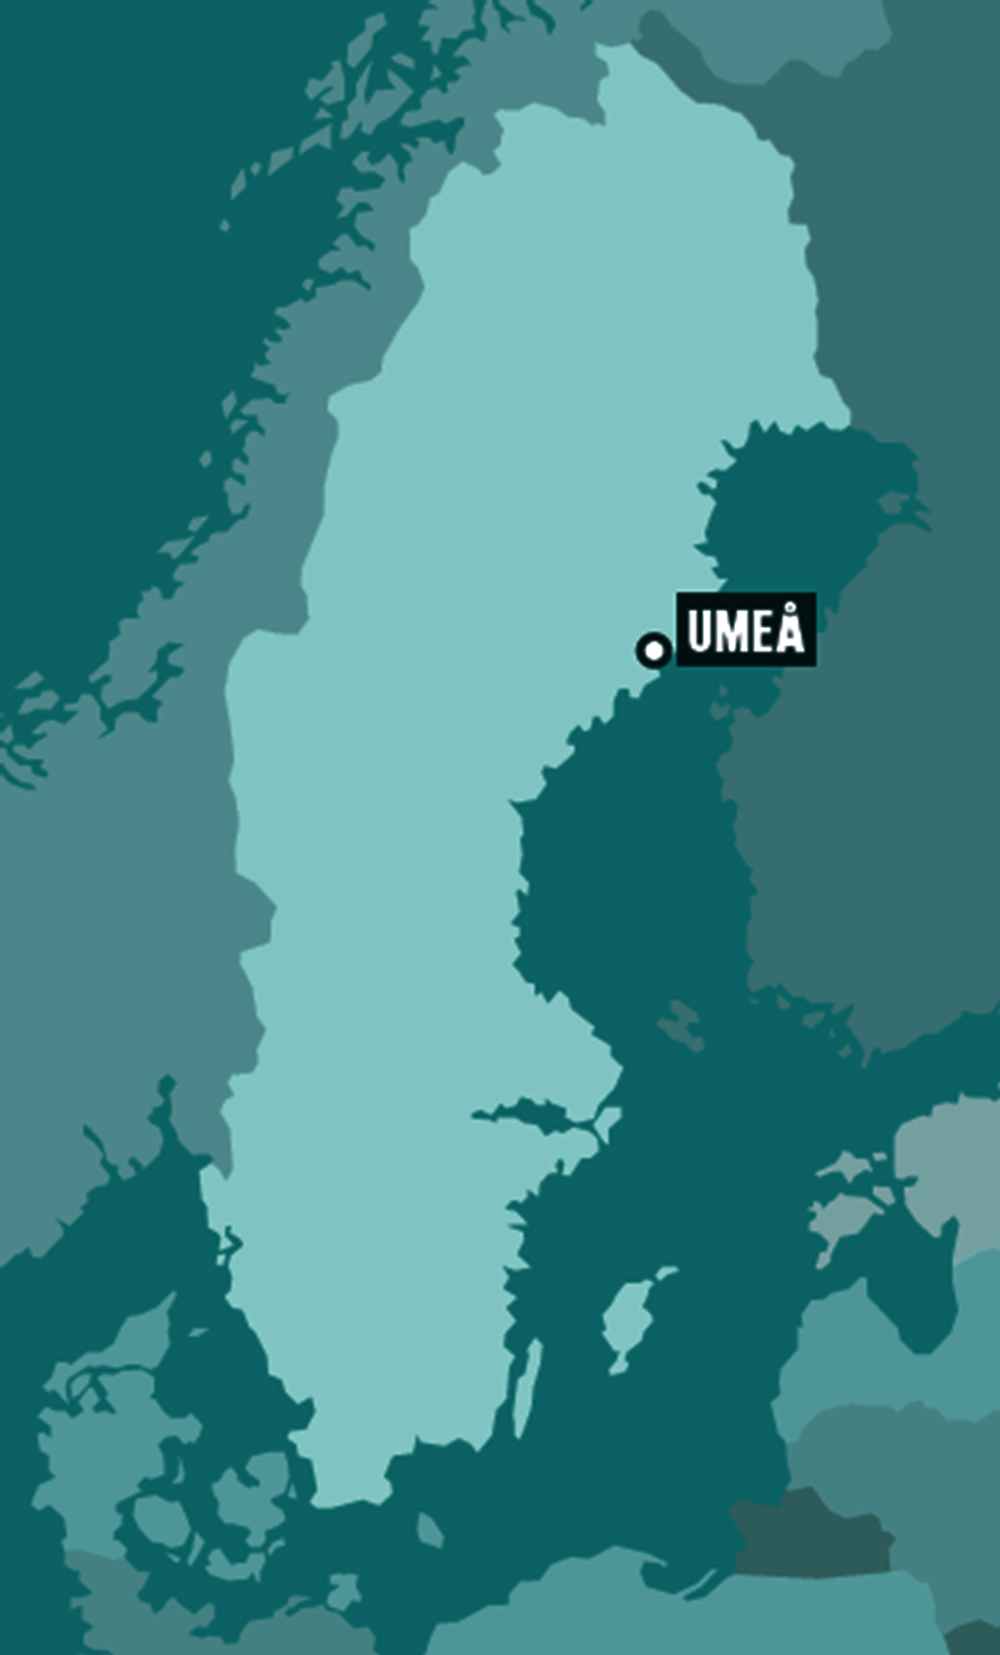
Source: The Municipality of Umeå (2020[22]) Umeå's location in Sweden's Map.
The circular economy represents a means to achieve Umeå’s environmental goals for 2040. The New Comprehensive Plan for Umeå Municipality (Box 1.3) set the goal for the city to be fossil-free by 2045. However, in February 2020, the city council approved the new environmental goals for the City of Umeå, anticipating the target by 5 years to 2040. As a matter of fact, Some goals included in the aforementioned plan and scheduled to be reached by 2020, have already been successfully achieved (e.g. climate neutrality in the energy system by 2018 and fossil-fuel-free public transport by 2020) and are now under revision for updates. The city is planning a fossil fuel private vehicle fleet by 2030. The goal will be achieved thanks to the pro-environmental attitude of citizens, ranked in 2014 as Europe ́s most environmentally aware citizens by Vienna University of Technology European as part of the “Smart city Ranking of European medium-sized cities” (Municipality of Umeå, 2018[23]).
The New Comprehensive Plan (2011) foresees five sustainable growth strategies:
Promoting city growth in a five-kilometre radius from the city centre: Umeå aims to grow in an organic way in order to make sustainable mobility easy and effective. This will stimulate citizens to use public transport, aiming to accomplish a shift from car dependency towards sustainable transport modes (e.g. bicycle).
Developing high-density new city districts: high density will make it possible to support new areas with sustainable services and sharing solutions.
Planning population growth along public transport corridors.
Investing in public parks to provide citizens with a healthy environment, through fostering access to recreation and promoting a sustainable lifestyle.
Offering citizens an open, transparent and democratic process encouraging participation in the planning process, through co-creation and citizen engagement processes.
The New Comprehensive Plan for the Municipality of Umeå aims to accomplish the following by 2050: develop “the knowledge city of Umeå” with education and lifelong learning systems; retain Umeå’s position as international city of culture and promote culture as an investment and inspiration for a sustainable society and growth. Moreover, by 2020, the plan aims to achieve the best public healthcare system in Sweden and halve child poverty. Social issues are high on the city’s political agenda. Since 2000, the municipality has implemented different measures to foster gender equality in the city, from improving gender representation in cultural events to enhancing safety in the streets. In 2014, the Observatory of the European Charter defined Umeå as a “model town for gender equality”.
Source: Municipality of Umeå (2018[24]), Comprehensive Plan for Umeå Municipality, http://www.umea.se/oversiktsplan (accessed on 14 November 2019); Municipality of Umeå (2018[23]), EGCA 2018, Umeå, Sweden City Introduction and Context-involvement, Investment and Innovation; Observatory of the European Charter (2014[25]), Umeå – A Model Town for Gender Equality, https://www.charter-equality.eu/exemple-de-bonnes-pratiques/umea-a-model-town-for-gender-equality.html (accessed on 14 November 2019).
copy the linklink copied!Socioeconomic data and trends
The city of Umeå is the most populated city in the Norrland region and the fastest-growing urban centre in Northern Sweden. The city counted 127 000 inhabitants in 2018, corresponding to 50% of Västerbotten County’s population (Regionfakta, 2019[26]; North Sweden Cleantech, 2019[27]) (Figure 1.4). Umeå is the 11th largest city in Sweden and the largest city across the northern counties of Jämtland-Härjedalen, Norrbotten and Västerbotten, which are considered sparsely populated areas. Most of the population in Northern Sweden is concentrated in larger cities along the east coast, where Umeå is located. The city has doubled its population in the last 50 years: since 2001, Umeå’s population has grown by almost 22% (Figure 1.4). Moreover, projections show that, by 2050, Västerbotten County, driven by Umeå, will continue to grow (+3.2% compared to 2016), while the population in the neighbouring counties of Jämtland and Norrbotten will shrink (OECD, 2019[28]).
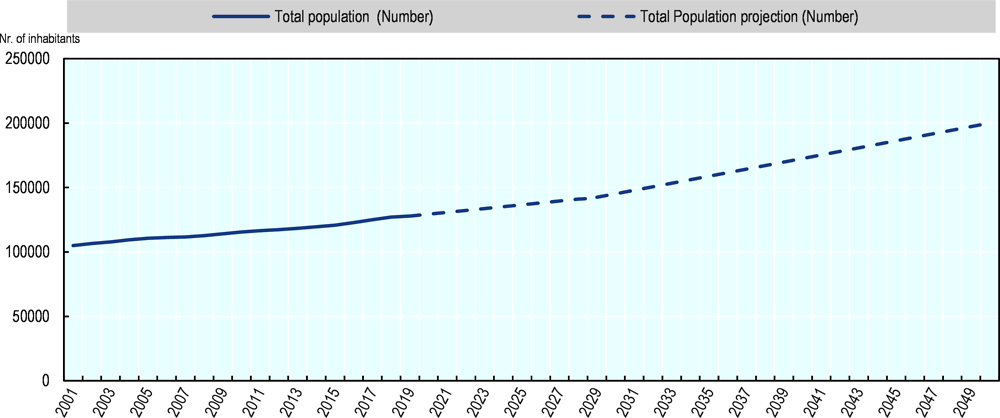
Source: Own elaboration based on data from the Municipality of Umeå (2019).
The city aims to reach a population of 200 000 inhabitants by 2050, with consequences on the use of natural resources and infrastructure needs. The expected population growth (22% higher than the current population) (Municipality of Umeå, 2018[24]) is likely to demand an expansion of infrastructure, including the housing stock, schools, roads and green areas. The city government foresees an increase of 60 000 houses by 2050 in order to meet the growing population goal. The housing stock in Umeå doubled in the last 30 years. Since 2011, a total of 800 new apartments have been built each year (Municipality of Umeå, 2019[29]). More people will mean greater demand for housing, transport and services, while likely to produce more waste. As such, the circular economy can guide decisions towards sustainable use of resources and alignment across policies (e.g. housing, transport, land use, waste management and logistics). A higher population density is expected to favour further development of sharing economy initiatives, especially in the transport sector.
Umeå is a knowledge hub for the region and hosts a young and highly educated community. Umeå is the main education centre in northern Sweden. The city hosts two renowned universities and eight colleges (e.g. technology, architecture, design and fine arts). The Umeå Institute of Design ranked first worldwide in 2019 (Umeå University, 2020[30]). In 2018, the city hosted 34 000 students, corresponding to 25% of the population (Municipality of Umeå, 2018[23]). The average age in Umeå is 38.4 years old, below the national average (41) and the other counties in Northern Sweden (43.2 in Jämtland-Härjedalen and 43.7 in Norrbotten) (OECD, 2019[28]). The city figures in the top ten list among the 290 municipalities in Sweden for the level of education of its population. (North Sweden Cleantech, 2019[27]). A total of 37% of individuals have at least 3 years of post-secondary education, including at postgraduate level (North Sweden Cleantech, 2019[27]).
The business and innovation scene is dynamic and environmentally friendly. Since the 1950s, forestry, energy and mineral exploitation characterised Northern Sweden’s economy. These sectors are still relevant in the provincial economies of Jämtland-Härjedalen, Norrbotten and Västerbotten, representing a quarter of the regional GDP in 2017, behind the services sector (57%) and the goods production sector (32%) (Statistics Sweden, 2016[31]). In 2016, Umeå’s GDP per inhabitant (SEK 416 000) was 5% lower than the Swedish national average (SEK 441 000) and 9% higher than Västerbotten County’s level (SEK 372 000) (Regionfakta, 2019[26]). A total of 12 300 small- and medium-sized enterprises (SMEs) and 650 start-ups are currently based in Umeå. There are five incubators (Uminova Innovation, eXpression Umeå, Umeå Biotech, BIC Factory and Coompanion) involving start-ups, universities, the municipality and public companies. The manufacturing, building and construction sectors, trade, ICT and life science account for 7 000 firms in Umeå. In 2017, employment rate levels have been higher in Västerbotten County and in the neighbouring County of Jämtland than in the rest of the country (68.6% and 68.7% respectively compared to 67.8% at the national level) (Figure 1.5). In 2017, in Västerbotten County, the unemployment rate was 5.3%, below Sweden’s average (6.7%) (OECD, 2019[28]). Regarding environmental aspects, municipal companies apply innovative cleantech solutions, consisting of using alternative clean energy, reducing water consumption, sustainable construction, green chemistry and/or sustainable transport solutions (North Sweden Cleantech, 2019[27]).
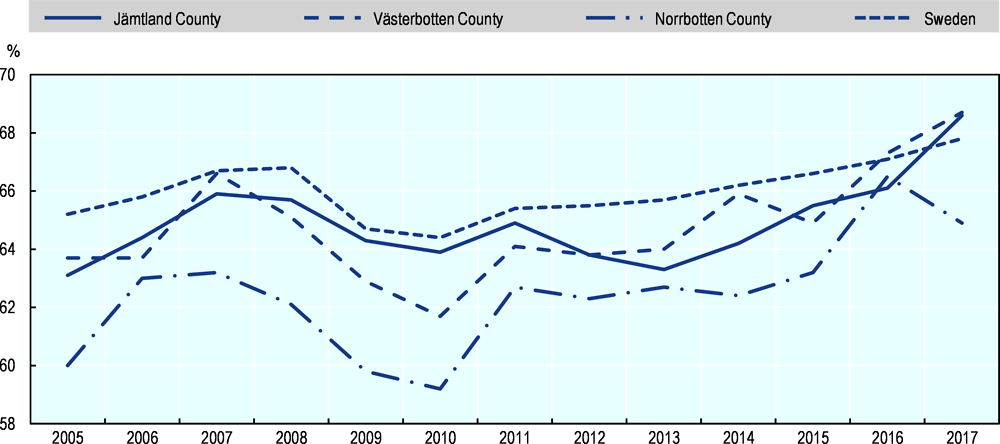
Source: OECD (2019[28]), Linking the Indigenous Sami People with Regional Development in Sweden, https://dx.doi.org/10.1787/9789264310544-en; Statistics Sweden (2020[32]), Labour Market Statistics, http://www.statistikdatabasen.scb.se/pxweb/sv/ssd/ (accessed on 6 February 2020).
copy the linklink copied!Overview of environmental data and trends
Umeå’s CO2 emissions have been historically lower than the national level and the city expects to achieve net-zero emissions by 2050. Total CO2 emissions from fossil fuels (tonnes/capita) have sharply decreased since 1990 (from 6.0 tonnes/capita to 4.5 tonnes/capita) and have remained below the national average, which is approximately 4.7 tonnes of CO2/capita (Municipality of Umeå, 2018[33]). The city expects to achieve net-zero emissions by 2050 following national emission reduction objectives (Municipality of Umeå, 2018[33]).
The transport sector represents the main source of CO2 emissions in Umeå. The greatest challenge for residents is the extensive use of fossil fuels in transport, which in 2013 accounted for more than 50% of total emissions (300 000 tonnes of CO2) (Figure 1.6). However, transport emissions have experienced a slight reduction (4%) between 1990 and 2013 (from 2.6 tonnes/capita in 1990 to 2.5 tonnes/capita in 2013). According to the survey on consumption-based emissions in Umeå (Box 1.4), transport is the sector causing most of the atmospheric emissions (Municipality of Umeå, 2018[33]). The Strategy for Liveable Cities set by the Swedish government encourages cities to take sustainable transport measures (Ministry of the Environment and Energy, 2018[34]). In particular, it sets two interim targets: By 2025, the proportion of passenger transport in Sweden using public transport, cycling and walking (expressed in passenger kilometres) must be at least 25%, with the aim of doubling the proportion of walking, cycling and public transport over time. By 2020, municipalities must have access to a refined method for making use of and integrating urban green spaces and ecosystem services in the planning, building and managing of cities.
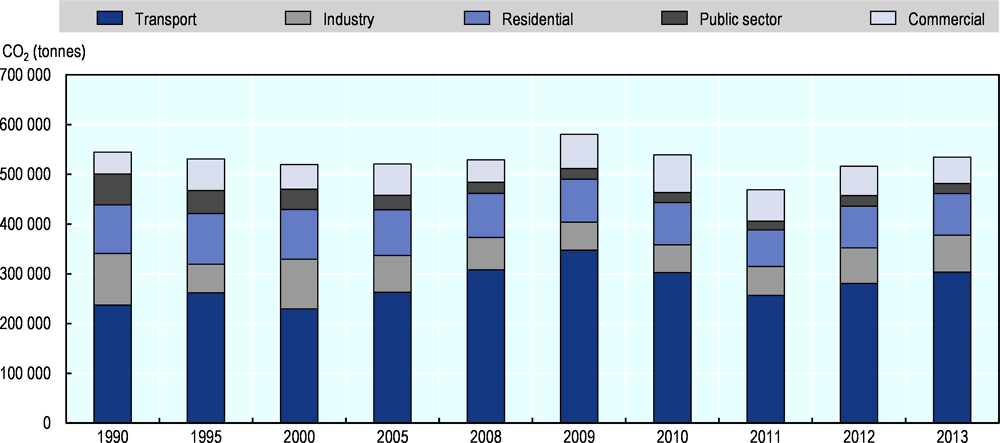
Note: Most recent available information dates from 2014.
Source: Municipality of Umeå (2018[33]), EGCA 2018, Umeå, Sweden. Climate Change: Mitigation and Adaption.
In 2018, the municipality of Umeå launched a survey on consumption-based emissions to analyse environmental impacts due to citizens’ consumption. The survey, based on the IVL Swedish Environmental Research Institute´s climate account, received 1 475 responses (from a total of 4 004). Results, combined with national data, revealed that the average emissions from consumption in Umeå (11.7 tonnes of CO2 per year/person)4 remained above the national average (9 tonnes of CO2 per year/person).5 These levels of emissions stand above those set by the Paris Agreement under the United Nations Framework Convention on Climate Change, which states that emissions per person and year should be on average 1 tonne by 2050 (Naturvårdsverket, 2019[35]).
Consumption-based emissions include emissions that occur at all stages before a product is consumed, regardless of where these emissions occur. The fact that most of the products consumed in Umeå are not locally produced increased their impacts. Based on the results of the survey, transport is the sector producing higher number of emissions in Umeå (32%), followed by private investment (21%), food (17%), public consumption and investment (13%), clothes and gadgets (9%), housing (6%) and others (2%) (Figure 1.7).
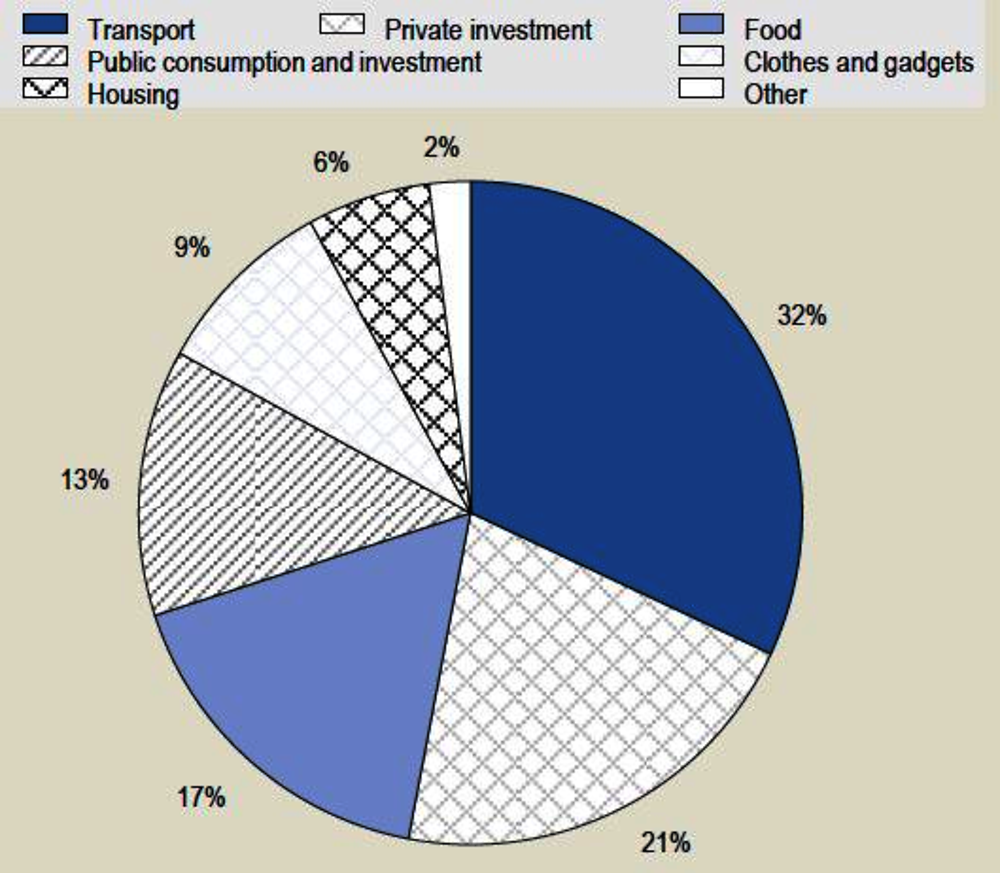
Source: Naturvårdsverket (2019[35]), Consumption-based Emissions of Greenhouse Gases, http://www.naturvardsverket.se/Sa-mar-miljon/Klimat-och-luft/Klimat/Tre-satt-att-berakna-klimatpaverkande-utslapp/Konsumtionsbaserade-utslapp-av-vaxthusgaser/ (accessed on 29 January 2020).
Key findings from the survey highlight actions needed to substantially reduce atmospheric emissions:
reduction in air travel and car use
reduction in meat and dairy consumption and a reduction in food waste
reduction in domestic energy consumption
reduction in consumption and increase in the reuse of furniture and clothing.
Source: Stockholm Environment Institute (2018[36]), Consumption-based Emissions in the Municipality of Umeå, http://www.sei.org (accessed on 25 January 2020); Naturvårdsverket (2019[35]), Consumption-based Emissions of Greenhouse Gases, http://www.naturvardsverket.se/Sa-mar-miljon/Klimat-och-luft/Klimat/Tre-satt-att-berakna-klimatpaverkande-utslapp/Konsumtionsbaserade-utslapp-av-vaxthusgaser/ (accessed on 29 January 2020).
District heating increased steadily since 2008. As a consequence of the investments the municipality made in district heating infrastructure since the 1960s, almost 99.8% of all municipal buildings are connected to district heating or rely on renewable energy sources. In 2014, a total of 80% of the district heating system energy derived from renewable resources, including wind, hydropower, biofuels and waste incineration (Figure 1.8).
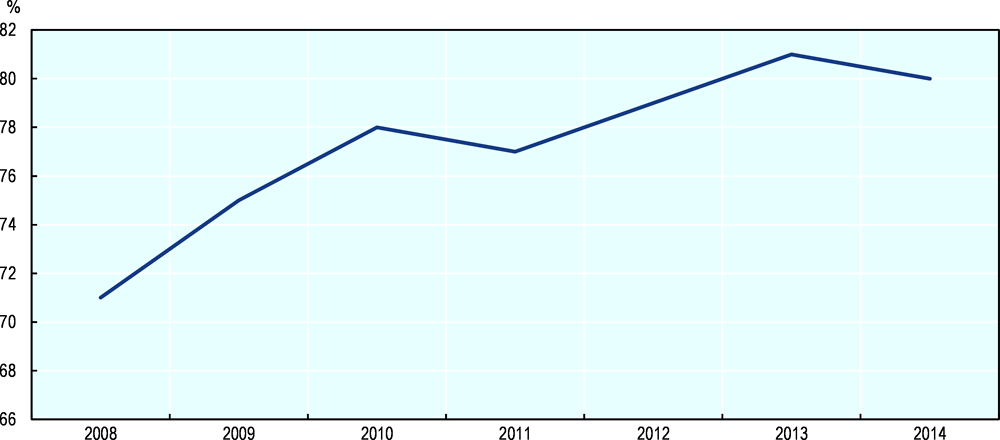
Note: The graph is built upon the most recent available information, until 2014.
Source: Municipality of Umeå (2018[33]), EGCA 2018, Umeå, Sweden. Climate Change: Mitigation and Adaption.
The per capita waste generated in Umeå has increased by almost 5% between 2008 and 2018 (Municipality of Umeå, 2018[37]). Umeå’s households generated around 450 kg per year/inhabitant in 2018, which is similar to the Swedish national average, 466 kg per year/inhabitant in 2018. Nonetheless, waste production per inhabitant has been increasing in Umeå between 2008 and 2017. In 2017, incineration concerned a total of 33% of Umeå’s household waste (150 kg/year/inhabitant). Figure 1.9 shows that the share of biologically treated food waste has more than doubled since 2010 (standing at 39% in 2018), while Figure 1.10 reveals that the household waste material collected for recycling has been falling since 2014, reaching in 2018 the same level than in 2011 (since 2014 it has decreased by 5% reaching 27% in 2018). In Sweden, 50% of household waste is used for energy recovery, compared to 30% in the European Union (EU) (Avfall Sverige, 2018[38]). According to the Swedish national survey on the circular economy (2018), there are some difficulties in obtaining differentiated data on the industrial and household waste managed by different companies. At the same time, the survey pointed out that the municipalities should have a clear role in preventing waste production. In 2019, in order to promote separate waste collection, the national government strengthened the Environmental Code towards Packaging and Newspaper Collection Service (FTI) responsible for collecting packaging waste.
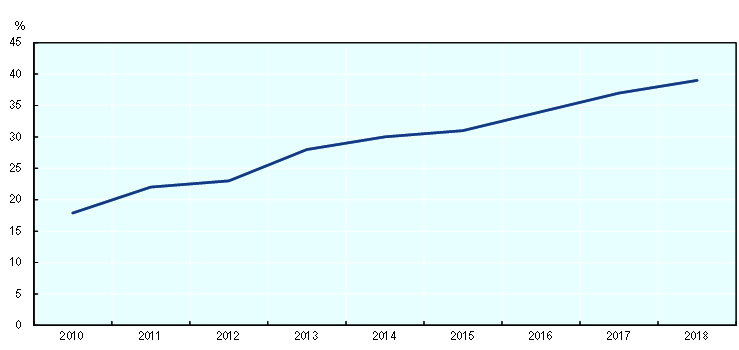
Source: Own elaboration based on data from Vakin (2019[39]). Biologically treated food waste in Umeå, Sweden.
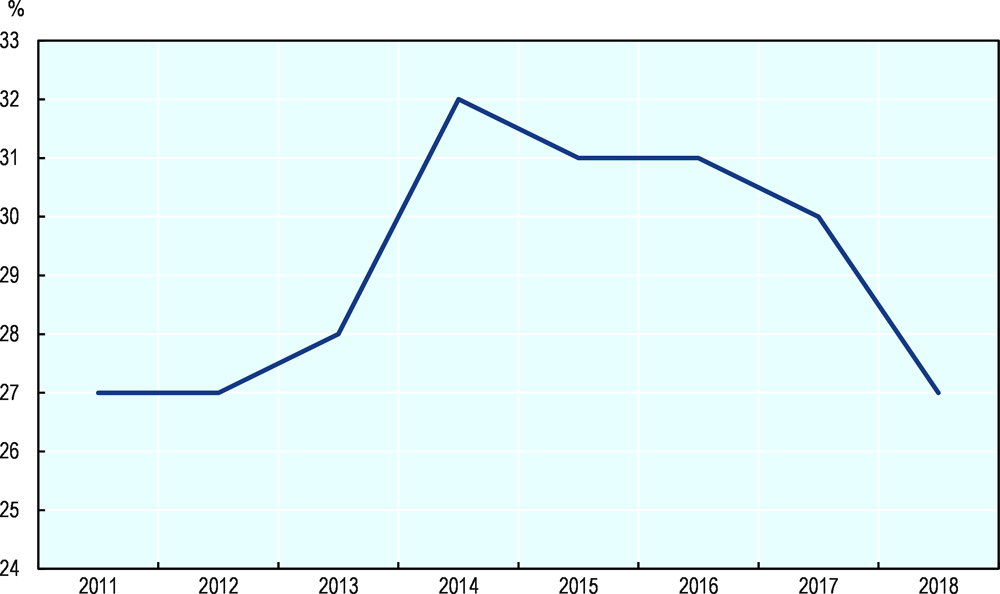
Source: Own elaboration based on data from Vakin (2019[40]). Household waste collected for recycling in Umeå, Sweden.
References
[14] Accenture (2015), “The circular economy could unlock $4.5 trillion of economic growth”, https://newsroom.accenture.com/news/the-circular-economy-could-unlock-4-5-trillion-of-economic-growth-finds-new-book-by-accenture.htm (accessed on 21 February 2020).
[38] Avfall Sverige (2018), Swedish Waste Management 2018.
[8] Blomsma, F. and G. Brennan (2017), “The emergence of circular economy: A new framing around prolonging resource productivity”, Journal of Industrial Ecology, Vol. 21/3, pp. 603-614, https://doi.org/10.1111/jiec.12603.
[45] Blomsma, F. and G. Brennan (2017), “The emergence of circular economy: A new framing around prolonging resource productivity”, Journal of Industrial Ecology, Vol. 21/3, pp. 603-614, https://doi.org/10.1111/jiec.12603.
[17] Circle Economy (2020), The Circularity Gap report, https://docs.wixstatic.com/ugd/ad6e59_733a71635ad946bc9902dbdc52217018.pdf.
[46] Commission, E. (2016), Circular Economy Package: Four legislative proposals on waste.
[9] EC (2015), Closing the loop – An EU action plan for the circular economy, https://eur-lex.europa.eu/legal-content/EN/TXT/HTML/?uri=CELEX:52015DC0614&from=EN (accessed on 21 February 2020).
[16] EEA (20016), Environmental Indicator Report 2016 - In Support to the Monitoring of the 7th Environment Action Programme, European Environment Agency, https://www.eea.europa.eu//publications/environmental-indicator-report-2016 (accessed on 21 February 2020).
[12] Ekins, P., Domenech, T., Drummond, P., Bleischwitz, R., Hughes, N. and Lotti, L. (2019), “The Circular Economy: What, Why, How and Where”, Background paper for an OECD/EC Workshop on 5 July 2019 within the workshop series “Managing environmental and energy transitions for regions and cities”, Paris.
[7] Ellen MacArthur Foundation (2019), Cities and Circular Economy for Food, https://www.ellenmacarthurfoundation.org/assets/downloads/Cities-and-Circular-Economy-for-Food_280119.pdf (accessed on 6 November 2019).
[10] Ellen MacArthur Foundation (2018), What is a Circular Economy?, https://www.ellenmacarthurfoundation.org/circular-economy/concept (accessed on 21 February 2020).
[2] IEA (2016), “Cities are in the frontline for cutting carbon emissions”, https://www.iea.org/news/cities-are-in-the-frontline-for-cutting-carbon-emissions-new-iea-report-finds (accessed on 21 February 2020).
[11] Kirchherr, J., D. Reike and M. Hekkert (2017), Conceptualizing the circular economy: An analysis of 114 definitions, Elsevier B.V., https://doi.org/10.1016/j.resconrec.2017.09.005.
[41] McCarthy, A., R. Dellink and R. Bibas (2018), “The Macroeconomics of the Circular Economy Transition: A Critical Review of Modelling Approaches”, OECD Environment Working Papers, No. 130, OECD Publishing, Paris, https://dx.doi.org/10.1787/af983f9a-en.
[44] McCarthy, A., R. Dellink and R. Bibas (2018), “The Macroeconomics of the Circular Economy Transition: A Critical Review of Modelling Approaches”, OECD Environment Working Papers, No. 130, OECD Publishing, Paris, https://dx.doi.org/10.1787/af983f9a-en.
[15] McKinsey Centre for Business and Environment (2016), Growth Within: A Circular Economy Vision for a Competitive Europe.
[34] Ministry of the Environment and Energy (2018), Strategy for Liveable cities, https://www.government.se/49f4b6/contentassets/093aaf895dbd44119d5ee023138c0f94/strategy-for-livable-cities---short-version (accessed on 5 March 2020).
[22] Municipality of Umeå (2020), Umeå’s location in Sweden’s Map.
[29] Municipality of Umeå (2019), The Portal for Umeå Municipality, University and Business, https://www.umea.se/2.bbd1b101a585d70480003.html (accessed on 23 January 2020).
[24] Municipality of Umeå (2018), Comprehensive Plan for Umeå Municipality, http://www.umea.se/oversiktsplan (accessed on 14 November 2019).
[37] Municipality of Umeå (2018), EGCA 2018, Umeå, Sweden 7. Waste Production and Management.
[23] Municipality of Umeå (2018), EGCA 2018, Umeå, Sweden City Introduction and Context-involvement, Investment and Innovation.
[33] Municipality of Umeå (2018), EGCA 2018, Umeå, Sweden. Climate Change: Mitigation and Adaption.
[19] Municipality of Umeå (2016), Strategic Plan 2016-2028, https://www.umea.se/download/18.25332a9916cb14274219795/1567417715728/UK_Oversiktsplan_2018-SVE_low_resolution.pdf (accessed on 14 November 2019).
[35] Naturvårdsverket (2019), Consumption-based Emissions of Greenhouse Gases, http://www.naturvardsverket.se/Sa-mar-miljon/Klimat-och-luft/Klimat/Tre-satt-att-berakna-klimatpaverkande-utslapp/Konsumtionsbaserade-utslapp-av-vaxthusgaser/ (accessed on 29 January 2020).
[27] North Sweden Cleantech (2019), North Sweden Cleantech - Umeå, https://www.northswedencleantech.se/en/trade-and-invest/the-region/umea/ (accessed on 23 January 2020).
[25] Observatory of the European Charter (2014), Umeå – A Model Town for Gender Equality, https://www.charter-equality.eu/exemple-de-bonnes-pratiques/umea-a-model-town-for-gender-equality.html (accessed on 14 November 2019).
[4] OCDE (2012), OECD Environmental Outlook to 2050: The Consequences of Inaction, OECD Publishing, Paris, https://doi.org/10.1787/9789264122246-en.
[47] OECD (2019), Global Material Resources Outlook to 2060 Economic drivers and environmental consequences HIGHLIGHTS, https://doi.org/10.1787/9789264307452-en (accessed on 8 November 2019).
[13] OECD (2019), Global Material Resources Outlook to 2060: Economic Drivers and Environmental Consequences, OECD Publishing, Paris, https://dx.doi.org/10.1787/9789264307452-en.
[28] OECD (2019), Linking the Indigenous Sami People with Regional Development in Sweden, OECD Rural Policy Reviews, OECD Publishing, Paris, https://dx.doi.org/10.1787/9789264310544-en.
[18] OECD (2019), OECD Survey on the Circular Economy in Cities and Regions, OECD, Paris.
[26] Regionfakta (2019), Statistics from Counties and Regions in Sweden, http://www.regionfakta.com/vasterbottens-lan/befolkning-och-hushall/befolkning/folkmangd-31-december-alder/ (accessed on 31 January 2020).
[32] Statistics Sweden (2020), Labour Market Statistics, http://www.statistikdatabasen.scb.se/pxweb/sv/ssd/ (accessed on 6 February 2020).
[42] Statistics Sweden (2019), Environmental Accounts, http://www.scb.se/hitta-statistik/statistik-efter-amne/miljo/miljoekonomi-och-hallbar-utveckling/miljorakenskaper/ (accessed on 29 January 2020).
[31] Statistics Sweden (2016), Gainfully Employed 16+ Years by Region of Work (RAMS) by Industrial.
[36] Stockholm Environment Institute (2018), Consumption-based Emissions in the Municipality of Umeå, http://www.sei.org (accessed on 25 January 2020).
[20] Swedish Institute (2019), The Swedish System of Government, https://sweden.se/society/the-swedish-system-of-government/ (accessed on 23 January 2020).
[30] Umeå University (2020), Rankings and Recognition, https://www.umu.se/en/about-umea-university/facts-and-figures/rankings/ (accessed on 23 January 2020).
[43] UN (2018), “68% of the world population projected to live in urban areas by 2050”, United Nations, http://www.un.org/development/desa/en/news/population/2018-revision-of-world-urbanization-prospects.html (accessed on 6 November 2019).
[1] UN (2018), “68% of the world population projected to live in urban areas by 2050”, United Nations, http://www.un.org/development/desa/en/news/population/2018-revision-of-world-urbanization-prospects.html (accessed on 6 November 2019).
[5] UNEP (2013), UNEP-DTIE Sustainable Consumption and Production Branch.
[6] UNEP/IWSA (2015), Global Waste Management Outlook.
[39] Vakin (2019), Biologically treated food waste in Umeå, Sweden. Percentage of total food waste, 2011-18.
[40] Vakin (2019), Household waste collected for recycling in Umeå, Sweden. Percentage of total household waste, 2010-18.
[21] Västerbotten Region (2019), This Is What the Region Does, https://www.regionvasterbotten.se/det-har-gor-regionen (accessed on 23 January 2020).
[3] World Bank (2010), World Development Report 2010, World Bank, https://doi.org/10.1596/978-0-8213-7987-5.
Notes
← 1. Air pollutant concentrations refer in particular to Particulate Matter (PM10).
← 2. Amec Foster Wheeler: see focus area profiles in this document (pp. 20-30) (2015), https://www.lwarb.gov.uk/wp-content/uploads/2015/12/LWARB-circular-economy-report_web_09.12.15.pdf.
← 3. For more information, see: https://www.paris.fr/economiecirculaire.
← 4. Most of the activities analysed in the research are based on input/output (I/O) methodology while a few others are calculated through the life cycle analysis (LCA) (Stockholm Environment Institute, 2018[36]). Data was collected through the survey and complemented with national statistics from the environmental accounts.
← 5. The methodology is based on environmentally expanded input-output analysis. The used data was obtained from the environmental accounts of the Swedish Central Bureau of Statistics (Statistiska centralbyrån) (Statistics Sweden, 2019[43]; Naturvårdsverket, 2019[35]).
