
3. Measuring the share of the private sector related to the SDGs
This chapter presents a novel methodology to measure the share of the private sector engaged in the production of goods or services that are related to the Sustainable Development Goals (SDGs). It relies on a mapping between sectoral and product classifications at a granular level and the 17 SDGs, based on a natural language processing/machine learning algorithm. This chapter also provides a complete view of the SDGs which can be linked to firms’ activities, either to their core business or non-core business activities.
Using a machine-learning (ML) algorithm to measure the share of the private sector whose core business is SDG-related yields that:
A significant share of value added can be linked to SDG 9-Industry, Innovation and Infrastructure and, to a lesser extent, to SDG 2-Zero Hunger, SDG 3-Good Health and Well-Being, SDG 8-Decent Work and Economic Growth, SDG 11-Sustainable Cities and Communities and SDG 12-Responsible Consumption and Production. A non-negligible share of exported goods also relate to SDG 7-Affordable and Clean Energy.
There is significant heterogeneity across countries in terms of domestic SDG-related activities. This unveils strengths and gaps at the national level, but also highlights the potential for mutually beneficial trade at the international level.
SDG-related activities rely on a network of upstream suppliers, whose value added can account for up to 80% of that of SDG-related activities. This highlights the importance of upstream sectors in the attainment of the SDGs and the need for a whole-of-value-chain approach.
Firms mainly prioritise, or have an impact on, SDGs 2, 3, 5, 7, 8, 9, 11, 12 and 13. The relationship between these SDGs and business activities are, however, heterogeneous. In particular, SDG 2-Zero Hunger, SDG 3-Good Health and Well-Being, SDG 7-Affordable and Clean Energy, SDG 8-Decent Work and Economic Growth, SDG 9-Industry, Innovation and Infrastructure, SDG 11-Sustainable Cities and Communities, SDG 12-Responsible Consumption and Production and SDG 13-Climate Action can be directly linked to the core business of firms. In addition, some SDGs are pervasive in non-core business activities (SDGs 3, 5-Gender Equality, 8, 9, 12 and 13).
This chapter presents a new methodology to measure the share of the private sector engaged in the production of goods or services that are related to the SDGs, and outlines the results of applying this methodology to a small sample of countries. The objective is to provide cross-country proxies of the extent to which the business sector is geared towards SDG-related goods and services. At an aggregate level, it measures the potential contribution of the private sector to SDGs through their core business (section “How firms tackle SDGs in practice” in Chapter 2).
To this end, this report develops a mapping between sectoral classifications at a granular level and the 17 SDGs, combining algorithmic and qualitative approaches. This mapping is then applied to detailed production and trade data to uncover the share of economic activity likely to be directly linked to SDGs across countries.
Beyond the cross-country comparison of sectoral SDG orientations, this chapter also participates in a better understanding of the firms’ contribution to SDGs. In particular, the algorithmic approach to identify SDGs could be extended to be applied to sustainability reports1 and to build a firm-level measure of SDG orientation. Further projects could explore this possibility to build more precise cross-country measures of firms’ involvement in SDGs.
This mapping is the result of three steps:
Building an algorithm that automatically identifies the SDGs in a short text (Sustainable Development Goals Business Actions Identifier [SDG-BAI] algorithm).
Applying the algorithm to a detailed description of sector or product classifications.
Incorporating external information to improve on the automatic classification.
Sustainable Development Goals Business Actions Identifier
This project built an algorithm that automatically identifies the SDGs in a short text (SDG-BAI algorithm). Leveraging on previous OECD work aimed at the recognition of SDGs in Official Development Assistance documents (Pincet, Okabe and Pawelczyk, 2019[1]), the algorithm used in this report is tailored to identify business contributions to the SDGs. SDG-BAI is made of 17 sub-algorithms, each one providing a binary prediction of whether the short text is linked to a specific SDG.
ML is used to train these 17 classifiers. According to OECD (2018[2]), “ML normally refers to the branch of artificial intelligence focused on developing systems that learn from data. Rather than being explicitly told how to solve a problem, ML algorithms can create solutions by learning from examples (referred to as ‘training’ the ML algorithm)”. This differs from other approaches that take a deterministic angle to this classification problem. For instance, Siris Academic2 is using a controlled vocabulary to classify science, technology and innovation documents (e.g. patents and scientific publications) according to the 17 SDGs. For each SDG, they rely on a list of keywords, built from human expertise, to link documents to the relevant SDGs depending on the number of occurrences or co-occurrences of the keywords (Annex B).
The business actions used to feed the model are taken from UNGC documents, the SDG Compass, Global Reporting Initiative standards and from information available regarding the previous winners of the SDG action awards. The training set includes almost 5 950 original examples, among which around 70% were labelled, the rest having been labelled manually. The examples of firm actions include those in section “How firms tackle SDGs in practice” in Chapter 2 above, and in Annex A. In terms of the SDGs, the sample is close to balance (i.e. around 440 examples per SDG). Most examples are proper descriptions of firms’ actions, but the data also include some general descriptions of possible contributions of the private sector to each SDG. To increase the robustness of the model, the training set is further enriched by the addition of 5 950 augmented copies of the original business action examples. The word augmentation technique used for this purpose draws on contextual word embedding (Annex B).
The chosen ML algorithm is called XGBoost (Extreme Gradient Boosting). This boosted tree algorithm is extremely fast (because it allows for parallelisation of computations) and provides a good performance in terms of accuracy. It rests on an ensemble of estimated decision trees. Using a series of tests on each observation, a decision tree provides a binary classification of whether an example is linked to a given SDG. Using majority voting over the ensemble of decision trees, the algorithm decides whether the example should be classified as linked to this SDG or not. During the estimation process, new trees are added to correct the errors made by the existing ensemble of trees, added sequentially until no further improvements can be made.
Of the examples, 90% are used for training the model, and the rest of the set is used to measure performance and regulate the level of different classification parameters. In the SDG identification problem, and given the structure of the training set, a particular emphasis is put on recall (i.e. the ability of the model to find all relevant cases and minimise the false negatives [see Annex B for a discussion]). The algorithm is able to correctly detect 76% of all the relevant cases in the validation set, while the precision (i.e. the ability of the model to avoid false positives), remains satisfactory (about 69% of the identified SDGs were actually labelled as such [Annex B]).
Using the algorithm to identify the sectors that are relevant for the SDGs
This subsection uses the automatic identification of SDG to measure the size of the SDG economy. The current algorithm is applied to sector descriptions, which correspond to short paragraphs of text describing the activity of a sector. Note that this use of the algorithm is demanding because although the size of the descriptions matches that of the examples in the training set, and although they both relate to firms operations, descriptions of the actions of a firm and the activity of a sector are not identical.
The algorithm is applied to both industrial (ISIC Rev.4) and goods classifications (HS6), in order to map sectors and goods to SDGs.
For instance, the description of the ISIC Rev.4 sector 8522 secondary education is:
technical and vocational secondary education typically emphasising subject-matter specialisation and instruction in both theoretical background and practical skills generally associated with present or prospective employment. The aim of a programme can vary from preparation for a general field of employment to a very specific job. Instruction may be provided in diverse settings such as the unit's or client's training facilities educational institutions the workplace or the home and through correspondence, television, internet or other means. This class includes technical and vocational education below the level of higher education […]; instruction for tourist guides; instruction for chefs, hoteliers and restaurateurs; special education for handicapped students at this level; cosmetology and barber schools; computer repair training; driving schools for occupational drivers e.g. of trucks, buses, coaches.
Given the presence of many words related to schooling, the algorithm correctly links this description to SDG 4-Quality Education. However, it also points to SDG 8-Decent Work and Economic Growth, especially when taking into consideration Target 8.6 “Substantially reduce the proportion of youth not in employment, education or training”. Finally, a more indirect albeit reasonable link is found with SDG 10-Reduced Inequalities, in particular Target 10.2 “Empower and promote the social, economic and political inclusion of all […]”.
The algorithm links a significant number of sectors to SDGs (Figure 3.1). The most common SDGs are SDG 9-Industry, Innovation and Infrastructure and SDG 12-Responsible Consumption and Production with more than 80 sectors each, whereas other SDGs are more rarely encountered (SDG 1-No poverty, SDG 5-Gender Equality and SDG 17-Partnerships for the Goals).

SDG-BAI is useful in drawing out hidden associations between sectors and SDGs. For instance, ISIC Rev.4 Sector “2021 – Manufacture of Pesticides” is obviously related to SDG 9-Industry, Innovation and Infrastructure, but the algorithm is also able to correctly draw a connection with SDG 2-Zero Hunger. Similarly, SDG-BAI links Sector “3 700 – Sewerage” (i.e. the infrastructure that conveys wastewater, including surface rainfall) with both SDG 6-Clean Water and Sanitation and SDG 11-Sustainable Cities and Communities. In other words, it detects the bond with water management (Target 6.5) and with reducing the adverse effect of water-related disasters (Target 11.5).
The picture remains consistent when focusing on a few mega sectors. Restricting the scope to “agriculture, forestry and fishing”, the most frequently identified SDGs are SDG 2-Zero Hunger, SDG 14-Life Under Water and SDG 15-Life on Land (Figure 3.2). For manufacturing, instead, SDG 9-Industry, Innovation and Infrastructure is by far the most frequent (Figure 3.3).


From a different perspective, it is also possible to understand which sectors could help achieve a given SDG. For instance, looking at SDG 15-Life on land, the strongest link is with “agriculture, forestry and fishing”, as anticipated before (Figure 3.4).

Note: The letters relate to ISIC Rev.4 sections (see Table A B.2). The algorithm identifies that nine sectors in agriculture, forestry and fishing, two sectors in manufacturing and one sector in services are related to SDG 15.
Source: OECD calculations based on the SDG-BAI algorithm.
Incorporating external information to supplement the output of the algorithm
A qualitative adjustment to the results of the algorithm is performed using expert judgement, based on the detailed description of the SDG targets and indicators, as well as previous analyses (i.e. material footprints categories, Wiedmann et al. (2013[3])); Tourism Satellite Accounts and its characteristic industries; Structural Business Statistics; Eurostat (2016[4]); and the Sustainability Accounting Standards Board [SASB] linkage map).3 Annex B presents the SDG-ISIC mapping used in the next section.
Caveats
Such a classification, and the resulting metrics, necessarily suffer from severe limitations and should be understood as a first step to stimulate work in this direction. First, extensive discussions with SDG and business experts go beyond the scope of this project, but could at a later stage enrich and improve the classification. Second, this approach identifies relationships between activities and SDGs with a descriptive rather than a normative angle. For instance, the “Manufacture of refined petroleum products” sector (ISIC 1920) is undoubtedly related to the SDG 7-Affordable and Clean Energy, even if deciding whether firms operating in this sector have a beneficial or detrimental impact on the achievement of the SDG 7 targets is out of the scope of this project. Finally, the binary nature of the classification is in itself a simplification as most sectors can, to different extents, be linked to a given SDG.
The mapping of granular-level sectoral classifications with the 17 SDGs, when combined with detailed value added data, allows for the measurement of the size of the “SDG economy”. For each SDG, this demonstrates the value added of sectors that are closely linked to it.
In this report, a small number of countries (Canada, Denmark, Korea, Japan and New Zealand) have been chosen based on the list of countries selected for the policy benchmarking exercise (Chapter 5) as well as on data availability at a disaggregated level. The required granularity of the data prevents the use of cross-country comparable datasets, such as the OECD’s STructural ANalysis Database (STAN). This analysis rather uses detailed value-added data that some countries produce using their own classifications. Therefore, certain adjustments have to be made initially (i.e. aggregation or disaggregation of industries to match the ISIC Rev.4 classification).
A significant share of value added can be linked to the SDGs, especially to SDG 9
Based on detailed value added data and the SDG-ISIC correspondence table developed in this chapter, Figure 3.5 shows the share of value added linked to each SDG on average in the sample of countries. A significant share of economic activities are linked to SDG 9-Industry, Innovation and Infrastructure as well as, to a lesser extent,4 to SDG 3-Good Health and Well-Being, SDG 8-Decent Work and Economic Growth, SDG 11-Sustainable cities and communities and SDG 12-Responsible Consumption and Production. On the contrary, some SDGs are linked to a very small share of total value added (e.g. only around 1% to 2% of value added is linked to SDG 5-Gender Equality, SDG 6-Clean Water and Sanitation and SDG 14-Life Below Water). The detailed results at the SDG and country level are available in Annex C.
Given the caveats described above, the results should be used with caution. In particular, although only a small share of value added is linked to some SDGs, this does not mean that firms are not concerned or involved in the corresponding societal challenge. For example, a very small share of economic activities is directly linked to SDG 5-Gender Equality, but most firms can act to promote gender equality.

Notes: SDG = Sustainable Development Goal. Countries sampled are Canada, Denmark, Japan, Korea and New Zealand. The green bars show the average value added for all countries. The whiskers show the data of the two countries that have the highest/lowest share.
Sources: METI (2014[5]), Extended Input-Output Tables, https://www.meti.go.jp/english/statistics/tyo/entyoio/index.html; Statistics Canada (Statistics Canada, 2021[6]), Symmetric Input-Output Tables, https://www150.statcan.gc.ca/n1/en/catalogue/15-207-X; Bank of Korea (2020[7]), 2018 Updated Input-Output Tables, https://www.bok.or.kr/eng/bbs/E0000634/view.do?nttId=10058883&menuNo=400069; Statistics Denmark (2021[8]), Danish Annual Input-Output Tables, https://www.dst.dk/en/Statistik/emner/nationalregnskab-og-offentlige-finanser/produktivitet-og-input-output/input-output-tabeller?tab=dok; Stats New Zealand (2016[9]), National Accounts Input-Output Tables, https://www.stats.govt.nz/information-releases/national-accounts-input-output-tables-year-ended-march-2013; OECD mapping between economic activities and the SDGs.
There is a significant level of heterogeneity across countries
Beyond the average, the share of economic activities linked to the SDGs displays a significant amount of variation, despite the limited sample of countries. For instance, the share of economic activities linked to SDG 9-Industry, Innovation and Infrastructure ranges from 14% in Japan and Canada to 30% in New Zealand. The rest of this subsection describes selected examples for some SDGs and countries.
For instance, in Korea, the contribution to SDGs is above the average for SDG 4-Quality Education and SDG 9-Industry, Innovation and Infrastructure. For SDG 4, this is due to a higher share of value added in the education services sector, whereas, for SDG 9, it is explained by a higher share of manufacturing activities (in particular, electrical equipment and motor vehicles).
In Denmark, the size of the social work activities contributes to explaining the higher than average share of economic activities linked with SDG 2-Zero Hunger, SDG 5-Gender Equality, SDG 10-Reduced Inequality and SDG 16-Peace, Justice and Strong Institutions. As for Korea, the size of the education services sector explains the high share of economic activities linked to SDG 4-Quality Education. Finally, the size of the water transport sector results in a higher than average share of economic activities linked to SDG 14-Life Below Water.
Japan displays a larger share of activities related to SDG 3-Good Health and Well-Being and SDG 11-Sustainable Cities and Communities, due to larger than average human health, residential care, and real estate sectors.
In New Zealand, the share of economic activities linked to SDG 2-Zero Hunger is higher than average due to the importance of the agricultural and food processing sectors. The size of the food processing sectors also contributes to a high share of the economy linked to SDG 9-Industry, Innovation and Infrastructure, along with financial services (excepting insurance and pension funding).5 As expected, the large size of the electricity, gas, steam and air conditioning supply sector contributes to SDG 7-Affordable and Clean Energy.
The indirect contribution of upstream sectors can amount to close to 80% of SDG-related activities
Figure 3.6 indicates that the share of SDG-related activities is significantly increased when taking into account the value added embodied in SDG-related goods but originating from upstream domestic sectors (indirect contribution). For instance, the main indirect contribution to activities related to SDG 9-Industry, innovation and infrastructure comes from transportation industry, professional, scientific and technical activities, and the agriculture sector, while for SDG 12-Responsible Consumption and Production the main contribution comes from the mining and energy industry (including coal and crude oil extraction), chemical and professional activities.
This indirect contribution usually represents a significant share of value added. For most of the SDGs, it is comparable to the value added directly linked to SDGs. For SDG 2-Zero Hunger and SDG 9-Industry, Innovation and Infrastructure, the indirect contribution represents almost 80% of the direct contribution, because the food processing sector (linked to SDG 2) and the manufacturing sector (linked to SDG 9) rely on a large quantity of inputs from upstream sectors. For SDG 1-No Poverty and SDG 3-Good Health and Well-Being, the indirect contribution represents approximately 40% of the direct contribution, given that the industries (in particular health and social activities) linked to these SDGs are less dependent on other upstream industries. Similarly, for SDG 4-Quality Education and SDG 5-Gender Equality, which are mainly linked to services sector, upstream activities are less important, with an indirect contribution representing less than 30% of the direct contribution.
These results underline the importance of having a vibrant economy in general, beyond SDG-related sectors. When designing industrial policies for the SDGs, governments should take into account these cross-sectoral linkages and ensure that policies include not only the development and the sustainable transition of SDG-related sectors, but also consider upstream sectors. The total (direct and indirect) value added linked to SDGs is above 10% for SDG 2-Zero Hunger, SDG 3-Good Health and Well-Being, SDG 8-Decent Work and Economic Growth, SDG 9-Industry, Innovation and Infrastructure, SDG 11-Sustainable Cities and Communities and SDG 12-Responsible Consumption and Production.

Note: SDG = Sustainable Development Goal. Countries sampled are Canada, Denmark, Japan, Korea and New Zealand.
Sources METI (2014[5]), Extended Input-Output Tables, https://www.meti.go.jp/english/statistics/tyo/entyoio/index.html; Statistics Canada (Statistics Canada, 2021[6]), Symmetric Input-Output Tables, https://www150.statcan.gc.ca/n1/en/catalogue/15-207-X; Bank of Korea (2020[7]), 2018 Updated Input-Output Tables, https://www.bok.or.kr/eng/bbs/E0000634/view.do?nttId=10058883&menuNo=400069; Statistics Denmark (2021[8]), Danish Annual Input-Output Tables, https://www.dst.dk/en/Statistik/emner/nationalregnskab-og-offentlige-finanser/produktivitet-og-input-output/input-output-tabeller?tab=dok; Stats New Zealand (2016[9]), National Accounts Input-Output Tables, https://www.stats.govt.nz/information-releases/national-accounts-input-output-tables-year-ended-march-2013; OECD mapping between economic activities and the SDGs.
This section applies the same algorithm (SDG-BAI) to trade classification (HS6) and detailed trade data. This approach allows not only an expansion of the sample of countries, as detailed trade data are available on a wider basis, but also a better understanding of how the link between SDGs and value added is translated into export specialisation. It also constitutes a robustness check of the previous analysis. However, trade data focus on exchanges on goods and do not include services, whereas the value added approach in the previous section allowed to measure the role of services for the SDG economy.
This section presents the main results of the analysis, whereas Annex C presents the results by country and SDG. The list of countries selected in this section is based on the countries presented in the benchmarking exercise as well as the availability of granular trade data from UN Comtrade (International Trade Statistics Database) (United Nations Statistics Division, 2021[10]). In this section, the analysis is restricted to SDGs 2 to 4 and 6 to 15. The algorithm was able to link these SDGs with goods from the HS6 classification, whereas no correspondence was found with SDG 1-Zero Poverty, SDG 5-Gender Equality, SDG 16-Peace, Justice and Strong Institutions and SDG 17-Partnerships for the Goals. This is consistent with the previous section, according to which these SDGs were mostly related to services sectors.
The main SDGs linked to exports are the same as for value added, with some notable exceptions linked to the role of services. SDG 9-Industry, Innovation and Infrastructure remains the most frequent, and its importance is reinforced due to manufacturing goods, which are linked to SDG 9, representing a very significant share of trade. As for value added, SDG 3-Good Health and Well-Being, SDG 8-Decent Work and Economic Growth, SDG 11-Sustainable cities and communities and SDG 12-Responsible Consumption and Production are also linked to a non-negligible share of exports. Interestingly, SDG 2-Zero Hunger and SDG 7-Affordable and Clean Energy are respectively linked to 7% and 13% of world trade, largely through agricultural products and commodities (including fossil fuels), but are linked to a much lower share of value added.
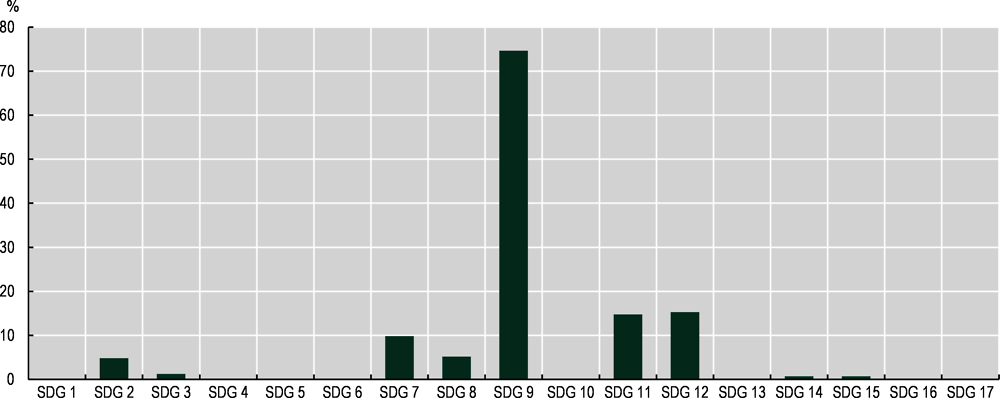
Sources: United Nations Statistics Division (2021[10]), UN Comtrade (International Trade Statistics Database), https://comtrade.un.org; OECD mapping between the Harmonized System classification and the SDGs.
This approach confirms a significant degree of heterogeneity across countries. Annex C presents the revealed comparative advantage6 by country and SDG. Despite significant differences in the underlying data and the scope, the value added and trade approaches display convergent results at the country by SDG level. For almost 80% of the country by SDG included, the results are consistent.7
The evidence gathered in Chapter 2 and in this chapter provides insight on the SDGs that the business sector is contributing to. As this information is scattered, this section lists the relevant SDGs and details their relationship with firms’ businesses.
Chapter 2 shows that SDG 3-Good Health and Well-Being, SDG 5-Gender Equality, SDG 8-Decent Work and Economic Growth, SDG 9-Industry, Innovation and Infrastructure, SDG 12-Responsible Consumption and Production and SDG 13-Climate Action are prioritised by more than 40% of respondents to the 2020 United Nations Global Compact survey. More than 35% of respondents declare that they take actions to advance these SDGs.
This chapter identifies the SDGs that can be linked to firms’ core business activities. SDG 2-Zero Hunger, SDG 3-Good Health and Well-Being, SDG 8-Decent Work and Economic Growth, SDG 9-Industry, Innovation and Infrastructure, SDG 11-Sustainable Cities and Communities and SDG 12-Responsible Consumption and Production are shown to correspond to a significant share of value added. In addition, although linked to smaller share of value added, SDG 7-Affordable and Clean Energy is found to represent a non-negligible share of exports.
This information is summarised in Figure 3.8. Based on the previous results, SDGs are classified according to three criteria:
Based on the results of Chapter 2, SDG 3-Good Health and Well-Being, SDG 5-Gender Equality, SDG 8-Decent Work and Economic Growth, SDG 9-Industry, Innovation and Infrastructure, SDG 12-Responsible Consumption and Production and SDG 13-Climate Action are considered as being a pervasive concern for firms. While survey data used in Chapter 2 do not necessarily refer to core business activities, the novel methodology used in this chapter to identify SDG-related economic activities and exports reveals complementary findings.
Based on the results in this chapter, SDG 2-Zero Hunger, SDG 3-Good Health and Well-Being, SDG 8-Decent Work and Economic Growth, SDG 9-Industry, Innovation and Infrastructure, SDG 11-Sustainable Cities and Communities and SDG 12-Responsible Consumption and Production are shown to have a pervasive link with core business activities, as they are linked to a significant share of value added (direct contribution above 8% or total contribution above 10%).
Finally, SDG 2-Zero Hunger and SDG 7-Affordable and Clean Energy are also shown to be related to core business activities, albeit for a limited number of well-identified sectors, as they can been linked to a significant share of exports. This sectoral angle is also evident for SDG 3-Good Health and Well-Being (health sector), SDG 9-Industry, Innovation and Infrastructure (manufacturing sector) and SDG 13-Climate Action (heavy emitters of greenhouse gases [GHGs]).
Figure 3.8 illustrates that some SDGs belong to several of the aforementioned categories. For instance, SDG 13-Climate Action is directly linked to the core business of (green) electricity production, but GHG emissions are also a concern for a wide range of companies. SDG 9-Industry, Innovation and Infrastructure is directly linked to the core business activity well-identified sectors (manufacturing) but also to a more diffuse set of sectors (e.g. those linked to infrastructure or research and development) and is more broadly a concern for a large number of firms (e.g. through innovation, integration into value chains).

References
[11] Balassa, B. (1965), “Trade liberalisation and ’revealed’ comparative advantage”, The Manchester School, Vol. 33/2, pp. 99-123, https://doi.org/10.1111/j.1467-9957.1965.tb00050.x.
[7] Bank of Korea (2020), 2018 Updated Input-Output Tables, https://www.bok.or.kr/eng/bbs/E0000634/view.do?nttId=10058883&menuNo=400069.
[4] Eurostat (2016), Environmental Goods and Services Sector Accounts - Practical Guide, Publications Office of the European Union, Luxembourg, https://doi.org/10.2785/688181.
[5] METI (2014), Extended Input-Output Tables, Ministry of Economy, Trade and Industry of Japan, https://www.meti.go.jp/english/statistics/tyo/entyoio/index.html.
[2] OECD (2018), “Artificial intelligence and machine learning in science”, in OECD Science, Technology and Innovation Outlook 2018: Adapting to Technological and Societal Disruption, OECD Publishing, Paris, https://doi.org/10.1787/sti_in_outlook-2018-10-en.
[1] Pincet, A., S. Okabe and M. Pawelczyk (2019), “Linking Aid to the Sustainable Development Goals – a machine learning approach”, OECD Development Co-operation Working Papers, No. 52, OECD Publishing, Paris, https://dx.doi.org/10.1787/4bdaeb8c-en.
[6] Statistics Canada (2021), Symmetric Input-Output Tables, https://www150.statcan.gc.ca/n1/en/catalogue/15-207-X.
[8] Statistics Denmark (2021), Danish Annual Input-Output Tables, https://www.dst.dk/en/Statistik/emner/nationalregnskab-og-offentlige-finanser/produktivitet-og-input-output/input-output-tabeller?tab=dok.
[9] Stats New Zealand (2016), National Accounts Input-Output Tables, https://www.stats.govt.nz/information-releases/national-accounts-input-output-tables-year-ended-march-2013.
[10] United Nations Statistics Division (2021), UN Comtrade (International Trade Statistics Database), https://comtrade.un.org/.
[3] Wiedmann, T. et al. (2013), “The material footprint of nations”, Proceedings of the National Academy of Sciences, Vol. 112/20, pp. 6271-6276, https://doi.org/10.1073/pnas.1220362110.
Notes
← 1. See https://unstats.un.org/sdgs/metadata/files/Metadata-12-06-01.pdf for a list of sustainability report repositories.
← 2. https://science4sdgs.sirisacademic.com/.
← 3. The SASB linkage map links 26 sustainability-related business issues with the SASB’ Sustainable Industry Classification System (SICS) that comprises 77 industries.
← 4. These SDGs are linked to more than 8% of value-added.
← 5. Target 9.3 indeed highlights “the access of small-scale industrial and other enterprises, in particular in developing countries, to financial services, including affordable credit, and their integration into value chains and markets”.
← 6. Following Balassa (1965[11]), the revealed comparative advantage of country X for SDG Y is defined as the ratio between the share of exports related to SDG Y in total exports of country X and the share of exports related to SDG Y in total exports of the world.
← 7. For 78% of country X’s SDG pairs, one of the three following conditions is met: 1) the size of the SDG-related activities deviates by less than 10% from the sample average; 2) the size of the SDG-related activities is 10% higher compared to the sample average and the country displays a revealed comparative advantage; or 3) the size of the SDG-related activities is 10% lower compared to the sample average and the country displays a revealed comparative disadvantage.