copy the linklink copied!Health expenditure in relation to GDP
The ratio of spending on health care goods and services compared to total spending in the economy can vary over time due to differences in the growth of health spending compared to overall economic growth. During the 1990s and early 2000s, health spending in OECD countries was generally growing at a faster pace than the rest of the economy, leading to an almost continual rise in the health expenditure to GDP ratio. After a period of volatility during the economic crisis, the average share has remained relatively stable in recent years, as growth in health spending across the OECD has broadly matched overall economic growth.
On average, OECD countries are estimated to have spent 8.8% of GDP on health care in 2018, a figure more or less unchanged since 2013 (Figure 7.3). The United States spent by far the most on health care, equivalent to 16.9% of its GDP – well above Switzerland, the next highest spending country, at 12.2% (Figure 7.3). After the United States and Switzerland, a group of high-income countries, including Germany, France, Sweden and Japan, all spent close to 11% of their GDP on health care. A large group of OECD countries spanning Europe, but also Australia, New Zealand, Chile and Korea, fit within a band of health spending of between 8-10% of GDP. Many of the Central and Eastern European OECD countries, such as Lithuania and Poland, as well as key partner countries, allocated between 6-8% of their GDP to health care. Finally, a few OECD countries spent less than 6% of their GDP on health care, including Mexico, Latvia, Luxembourg, and Turkey at 4.2%. Turkey’s health spending as a share of GDP sits between that of China and India.
Looking in more detail at trends over the last decade, the average share of GDP related to health care jumped sharply in 2009 as overall economic conditions rapidly deteriorated in many countries, but health spending growth was generally maintained (Figure 7.4). Subsequently, growth in health spending also significantly declined – on average, growth fell to around zero between 2009 and 2011 – as a range of different policy measures to rein in public spending on health kicked in. Since 2011, the average rate of health spending growth has tended to closely track growth in the overall economy, largely maintaining the increased ratio of health spending to GDP at its present level of around 8.8%.
On a country-by-country basis there have been differing patterns in the health-to-GDP ratio in recent years. In the United States, after a number of years (2009-14) when the ratio of health spending to GDP remained stable at around 16.4%, this rapidly increased to 17.1% with the onset of a number of coverage changes, before falling to 16.9% in 2018 as overall economic growth in the US economy outpaced the growth in health spending (Figure 7.5). Korea, due to its rapidly increasing wealth and ongoing government policy to increase health coverage for the population, has seen substantial increases in the share of economic resources allocated to health. In 2003, health spending in Korea accounted for only 4.6% of GDP compared with 2018 when the ratio was estimated to have reached 8.1%. Chile has also seen its health spending to GDP ratio increase from 7.3% to 9.0% over the same time, due to an expansion in the coverage of health care for the population.
In Europe, France has seen the health spending to GDP ratio fluctuate – increasing during the financial crisis to reach a peak of 11.6% in 2014 – before a gradual decline to 11.2% by 2018. Health spending in France continued to outpace economic growth until 2016, but then stagnated due to a number of measures to contain costs including for example price negotiations for pharmaceuticals. The Netherlands has seen the proportion of GDP relating to health decrease from a high of 10.6% in 2014 to an estimated 9.9% in 2018, relating to reforms in health and long-term care insurance aimed at limiting spending growth within predefined levels.
See indicator “Health expenditure per capita” for a definition of current expenditure on health.
Gross Domestic Product (GDP) is the sum of final consumption, gross capital formation (investment) and net exports. Final consumption includes goods and services used by households or the community to satisfy their individual needs. It includes final consumption expenditure of households, general government and non-profit institutions serving households.
In countries such as Ireland and Luxembourg, where a significant proportion of GDP refers to repatriated profits and thus not available for national consumption, Gross National Income (GNI) may be a more meaningful measure than GDP. However, for consistency, GDP is maintained as the denominator for all countries.
Note that data for 2018 are based on provisional figures provided by the country or preliminary estimates made by the OECD Secretariat.
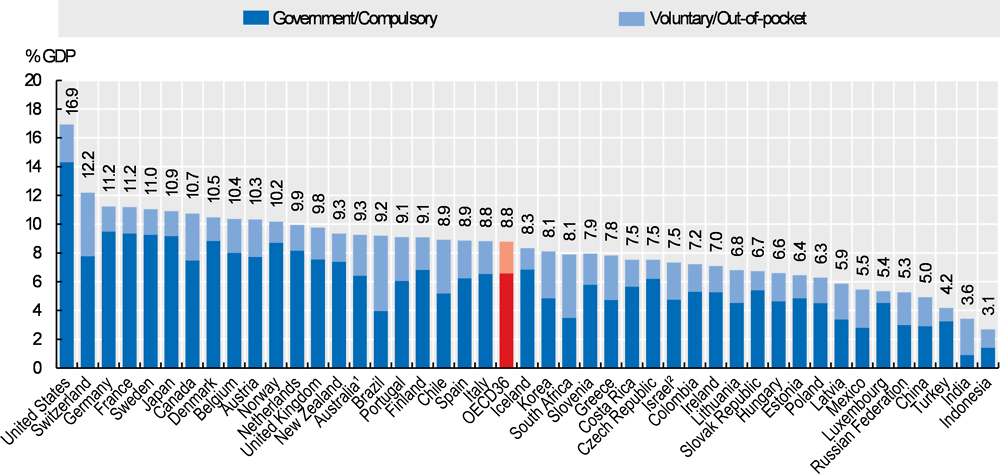
Note: Expenditure excludes investments, unless otherwise stated.
1. Australia expenditure estimates exclude all expenditure for residential aged care facilities in welfare (social) services. 2. Includes investments.
Source: OECD Health Statistics 2019, WHO Global Health Expenditure Database.
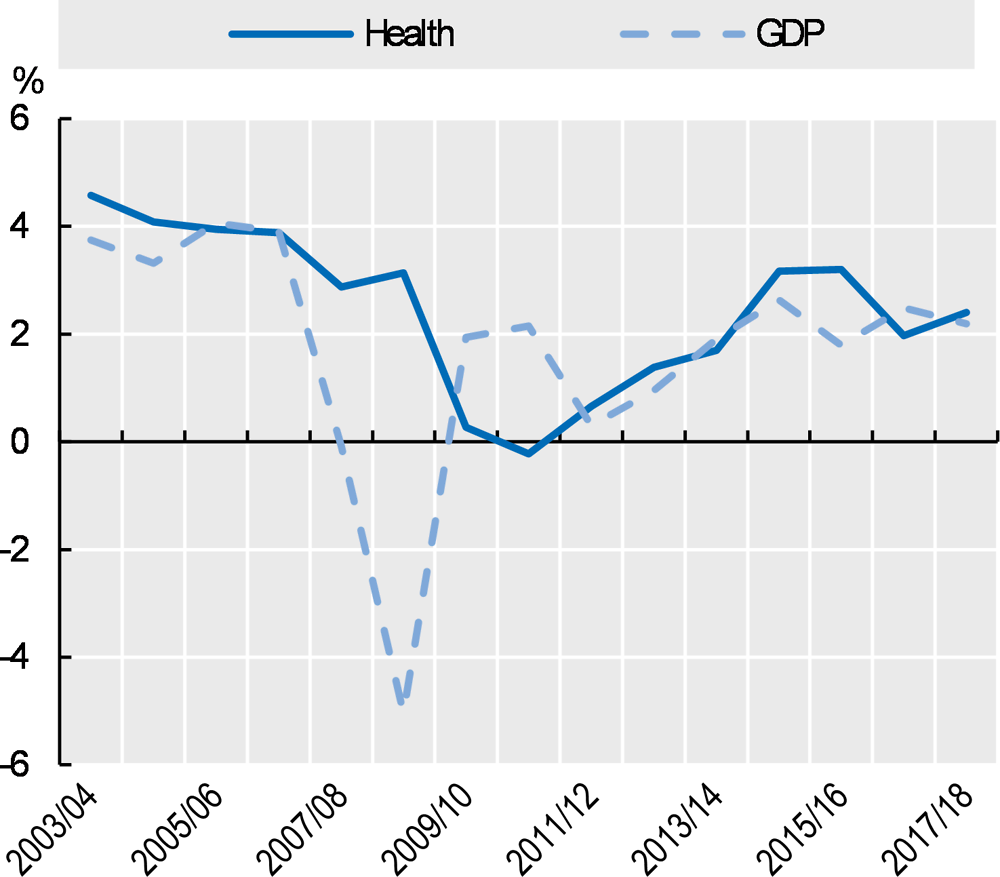
Source: OECD Health Statistics 2019.
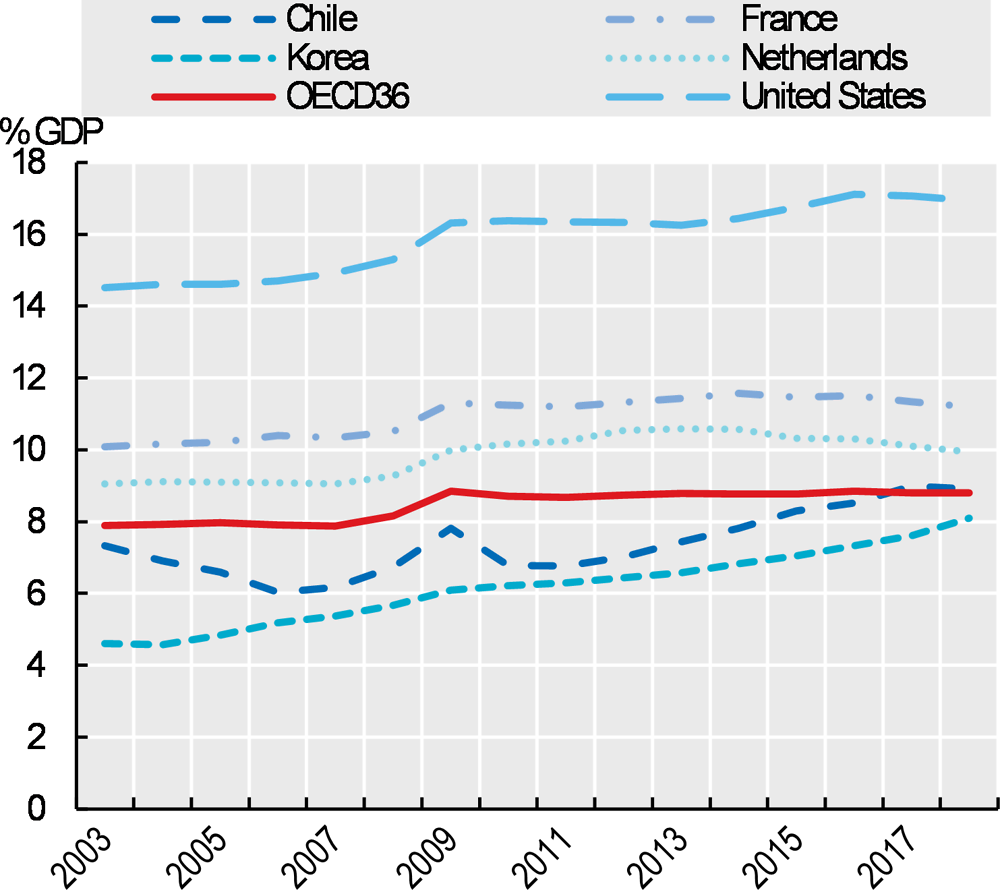
Source: OECD Health Statistics 2019.