copy the linklink copied!Health expenditure per capita
The level of health spending in a country, covering both individual needs and population health as a whole, and how this changes over time is dependent on a wide range of demographic, social and economic factors, as well as the financing and organisational arrangements of the health system.
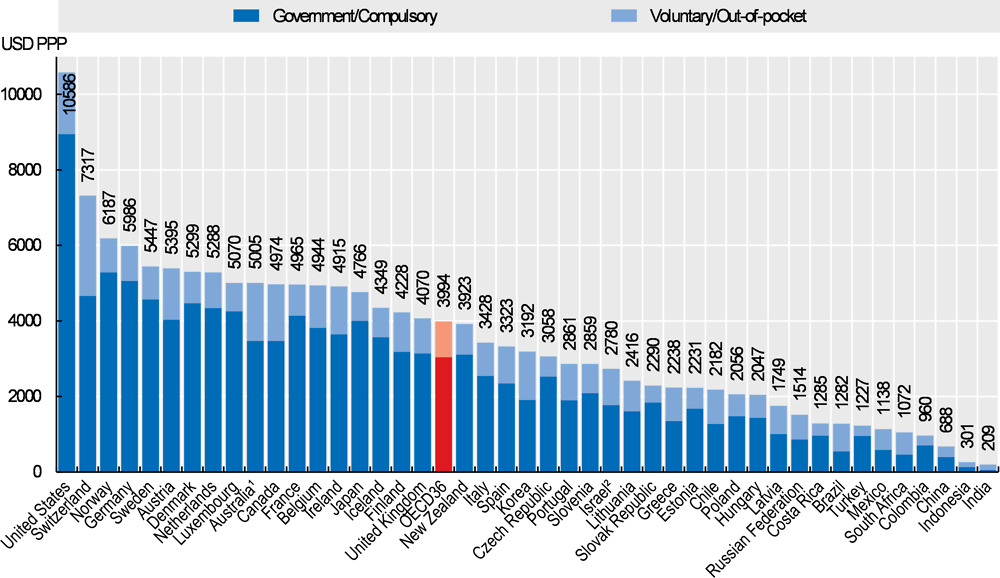
In 2018, overall spending on health care in the United States was estimated to be the equivalent of more than 10 000 dollars for each US resident. This amount of expenditure (when adjusted for different purchasing power in countries) was higher than all other OECD countries by a considerable margin. Switzerland, the next highest spender in the OECD, spent less than 70% of this amount, while the overall average of all OECD countries was less than 40% of the US figure (USD 3 994) (Figure 7.1). Many high-income OECD countries, such as Germany, France, Canada and Japan spend only around a half or less of the US per capita spending on health, while the United Kingdom and Italy were around the OECD average. Lowest per capita spenders on health in the OECD were Mexico and Turkey with health expenditure at around a quarter of the OECD average, and levels similar to the key emerging economies such as the Russian Federation, South Africa and Brazil. Latest available figures show that China spent around 20% of the OECD per capita spending level, while both India and Indonesia spent less than 10%.
Figure 7.1 also shows the split of health spending based on the type of health care coverage, either organised through government health schemes or some kind of compulsory insurance, or through a voluntary arrangement such as private health insurance or direct payments by households (see also indicator “Health expenditure by financing schemes”). Across OECD countries, 76% of all health spending is financed by government schemes or compulsory insurance (with a cross-country range of 51% to 85%). In the United States, since the introduction of the Affordable Care Act in 2014, this share stands at 85%, reflecting the existence of an individual mandate to purchase health insurance. Federal and state programmes such as Medicaid and Medicare continue to play an important role in purchasing health care.
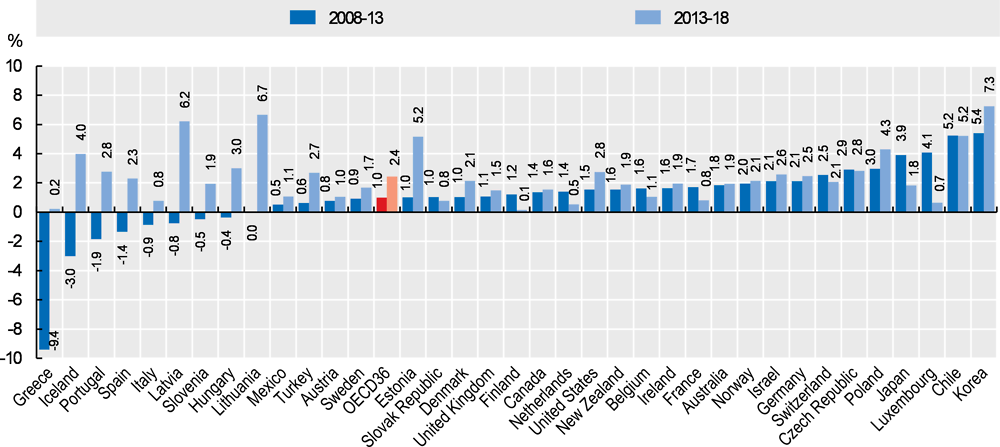
In 2017, OECD per capita spending on health care grew by an average of 2.0% – a marked slowdown from the 3.3% growth observed in 2015 and 2016, and significantly below the growth rates experienced before the onset of the global financial and economic crisis. Preliminary estimates for 2018 point to growth having strengthened in 2018. On average, since 2013, annual per capita health spending growth across the OECD has been 2.4% compared with 1.0% in the five years up to 2013, in the period following the crisis (Figure 7.2).
In a number of European countries, there have been significant turnarounds in health spending. In Greece, the strong annual decreases in growth halted after 2013, even if growth in health spending has been close to zero overall since 2013 (-9.4% in the time period 2008-13 vs. 0.2% in the time period 2013-18), and real per capita spending in 2018 remained almost a third below the 2009 level. A similar if less dramatic picture can also be seen in Iceland (-3.0% vs. 4.0%). In other European countries, such as Germany and Norway, health spending remained relatively stable over the ten-year period, with annual growth of between 2.0-2.5%. Overall, health spending growth has picked up in the majority of European countries in most recent years.
Outside of Europe, Korea and Chile have continued to report annual health spending increases above 5% in real terms since 2008. A provisional estimate for 2018 suggests further strong spending growth of 9.0% in Korea. In the United States, health spending is estimated to have grown by 1.4% in real terms in 2018, which along with similar growth in 2017 shows health spending in the United States growing slower than the overall economy.
Expenditure on health gives a measure of the final consumption of health goods and services (i.e. current health expenditure). This includes spending by all types of financing arrangements (e.g. government-based programmes, social insurance or out-of-pocket spending) on medical services and goods, population health and prevention programmes, as well as administration of the health system. The split of spending combines government and compulsory financing schemes, the latter including private insurance of a mandatory nature (for example in Switzerland and the Netherlands). Due to data limitations, voluntary private insurance in the United States is included with employer-based private insurance, which is currently mandated under the Affordable Care Act.
To compare spending levels between countries, per capita health expenditures are converted to a common currency (US dollar) and adjusted to take account of the different purchasing power of the national currencies, in order to compare spending levels, Actual Individual Consumption (AIC) PPPs are used as the most available and reliable conversion rates. For the calculation of growth rates in real terms, AIC deflators are used for all countries, where available.
Note that data for 2018 are based on provisional figures provided by the country or estimated by the OECD Secretariat.
Note: Expenditure excludes investments, unless otherwise stated.
1. Australia expenditure estimates exclude all expenditure for residential aged care facilities in welfare (social) services. 2. Includes investments.
Source: OECD Health Statistics 2019, WHO Global Health Expenditure Database.
Source: OECD Health Statistics 2019.