copy the linklink copied!Safe primary care – prescribing
Prescribing can be used as an indicator of health care quality, supplementing consumption and expenditure information (see Chapter 10). The overuse, underuse or misuse of prescription medicines can cause significant hazards to health and lead to wasteful expenditure. This is, for example, the case for opioids and antibiotics.
Opioids are often used to treat acute pain and pain associated with cancer, and over the last decade have been increasingly used to treat chronic pain, despite the risk of dependence, dose increase, shortness of breath and death. Opioid use is now causing an alarming and rising epidemic of overdose deaths in some OECD countries, such as the United States and Canada (OECD, 2019[1]) (see indicator on “Opioids use” in Chapter 4).
Figure 6.1 indicates that, across OECD countries, the average volume of opioids prescribed in primary care in 2017 was more than 16 defined daily doses (DDDs) per 1 000 population per day. Iceland and Luxembourg report volumes more than twice the OECD average; Turkey and Korea report the lowest volumes. While these numbers measure prescriptions in primary care, they may reflect conditions on the supply side, as the mean availability of opioids is also low in Turkey (see indicator on “Opioids use” in Chapter 4). On average, more than 2% of the adult population across OECD countries were chronic users of opioids in 2017 (Figure 6.2). Korea and Italy report the lowest and Iceland reports the highest proportion by a large margin. The large variation can be explained in part by differences in clinical practice in pain management, as well as differences in regulation, legal frameworks for opioids, prescribing policies and treatment guidelines.
Antibiotics should be prescribed only where there is a need that is clearly supported by evidence, to reduce the risk of resistant strains of bacteria (OECD, 2018[2]). For example, quinolones and cephalosporins are considered second-line antibiotics in most prescribing guidelines, which should generally be used only when first-line antibiotics are ineffective. Total volume of antibiotics prescribed and second-line antibiotics as a proportion of total volume have been validated as markers of quality in the primary care setting (OECD, 2017[3]), while overall antibiotic consumption and antimicrobial resistance across OECD countries has been increasing (OECD, 2018[2]).
Figure 6.3 shows the volume of all antibiotics prescribed in primary care in 2017, including second-line antibiotics. Total volumes vary more than three-fold across countries, with the United Kingdom, Estonia and Sweden reporting the lowest volumes, and Italy and Greece reporting the highest. Volumes of second-line antibiotics vary more than 24-fold across countries. The Scandinavian countries and the United Kingdom report the lowest volumes of second-line antibiotics, whereas Greece and Korea report the highest. Variation is likely to be explained, on the supply side, by differences in the guidelines and incentives that govern primary care prescribers and, on the demand side, by differences in attitudes and expectations regarding optimal treatment of infectious illness.
Defined daily dose (DDD) is the assumed average maintenance dose per day for a drug used for its main indication in adults. For instance, the DDD for oral aspirin equals 3 grammes, the assumed maintenance daily dose to treat pain in adults. DDDs do not necessarily reflect the average daily dose actually used in a given country. For more detail, see http://www.whocc.no/atcddd.
Data for Austria, Latvia, Estonia, Portugal, Spain and Sweden include data for primary care physicians only. Data for Canada, Finland, Italy, Korea and Norway include outpatient care. Data for the Netherlands include prescriptions by primary care doctors and medical specialists in outpatient clinics. Data for Denmark, Ireland and Slovenia include primary care, outpatient care and nursing homes. Data for Belgium and Turkey include primary care, nursing and residential facilities. Data for Iceland include data for primary care, outpatient care, specialists in private practice and nursing homes. Data relate to reimbursed prescriptions, with the exception of Iceland, Slovenia and the Netherlands (for benzodiazepines only), which include non-reimbursed medicines. Data for Denmark, Canada, Finland, Luxembourg, Portugal, the Netherlands and Sweden relate to medicines dispensed in community pharmacies. Data for Germany are based on prescription data of statutory health insurance for the outpatient area. Data for Australia are sourced from the Pharmaceutical Benefits Scheme dataset. Denominators comprise the population held in the national prescribing database, rather than the general population. Further information on sources and methods is at OECD.Stat. Other data in OECD Health Statistics on antibiotics may differ due to differences in data sources and coverage.
For opioids, “chronic users” is defined as the number of adults in the prescribing database with two or more prescriptions for at least 90 days.
References
[1] OECD (2019), Addressing Problematic Opioid Use in OECD Countries, OECD Health Policy Studies, OECD Publishing, Paris, https://dx.doi.org/10.1787/a18286f0-en.
[2] OECD (2018), Stemming the Superbug Tide: Just A Few Dollars More, OECD Health Policy Studies, OECD Publishing, Paris, https://dx.doi.org/10.1787/9789264307599-en.
[3] OECD (2017), Tackling Wasteful Spending on Health, OECD Publishing, Paris, https://dx.doi.org/10.1787/9789264266414-en.
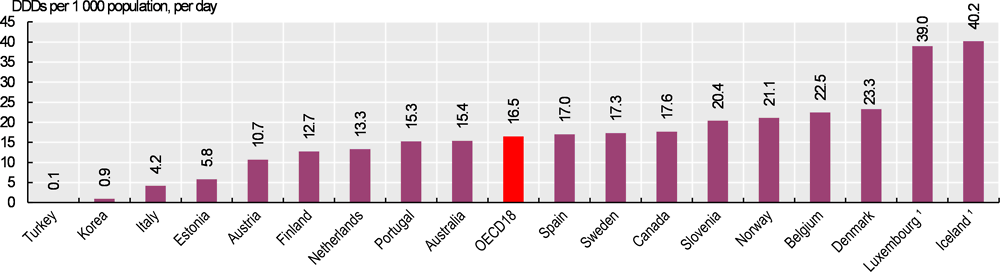
Note: Data exclude products used in the treatment of addiction. 1. Three-year average.
Source: OECD Health Statistics 2019 and Third Australian Atlas of Healthcare Variation 2018.
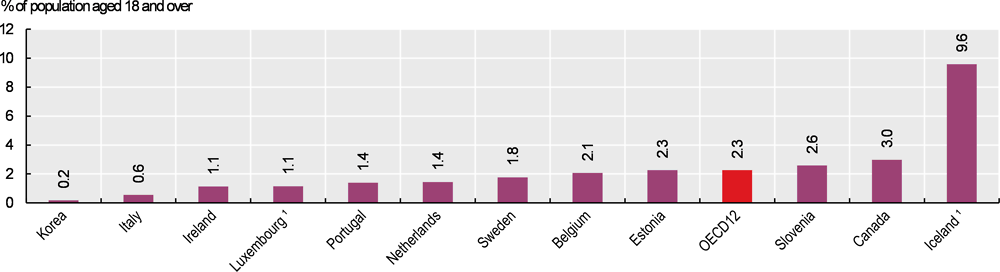
Note: Data exclude products used in the treatment of addiction. 1. Three-year average.
Source: OECD Health Statistics 2019.
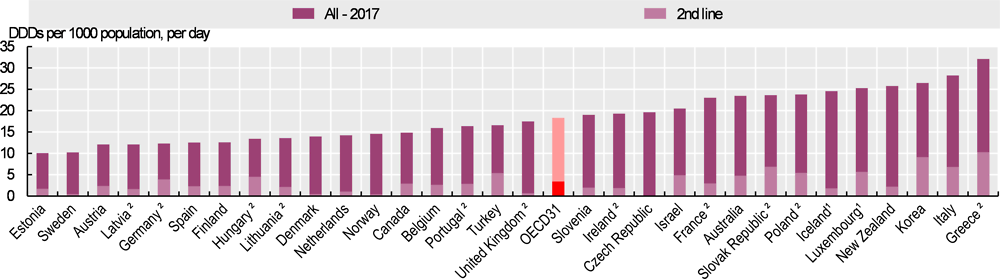
1. Three-year average. 2. Data from European Centre for Disease Prevention and Control as OECD Health Statistics data are not available.
Source: OECD Health Statistics 2019.