Chapter 1. What are the issues?
Kazakhstan’s impressive expansion on the backbone of the extractive industry (oil and metals) relies on high rates of energy use, resulting in significant air pollution. In line with an ambitious aim to become one of the top global economies by 2050, much remains to be done to green the economy and converge towards OECD living standards. Further review of the regulatory framework regulating industrial emissions will be essential.
Building on OECD previous analysis, this chapter analyses the system of environmental regulation and assessment for industrial emissions. It underlines how the design and implementation of the economic instruments (the environmentally related taxes) are primarily focused on raising revenues. This is contrary to the intention of the Polluter-Pays Principle. The chapter then turns to how these instruments impede energy efficiency and pollution abatement with heavy-handed non-compliance responses. Drawing from air pollution regulations and environmentally related taxes in OECD member countries, the final section offers some suggestions for reforms, which are then treated in detail in the following chapters.
1.1. The overall cost of air pollution – the single greatest environmental health risk
Air pollution is “the world’s largest single environmental health risk” (WHO, 2014[1]). It also a major risk factor in several diseases leading to disabilities and deaths (WHO, 2014[2]). As has been established in a series of scientific studies in the present decade, ambient air pollution – counting both ambient particular matter pollution and ambient ozone pollution – imposes a much greater toll in premature deaths than was previously estimated.1
It is therefore urgent to implement policies that reduce emissions of air pollutants and limit the population’s exposure to air pollution. In 2015, outdoor air pollution prematurely killed close to 4.5 million people (Roy and Braathen, 2017[3]). By 2060, this figure could increase by a factor of two to three. The regions most affected will include those that are densely populated and have high concentrations of PM2.5 and ozone, such as the People’s Republic of China and India, as well as those with an ageing population. Global annual welfare costs associated with those premature deaths could increase from USD 5 trillion in 2015 to USD 18-25 trillion by 2060 (OECD, 2016[4]).
Theoretically, air pollution can affect economic output through four channels. First, it can affect the size of the working population (through deaths and migration). Second, it can reduce the amount of hours worked per worker, if they are sick and cannot work (or have to attend to a sick relative). Third, it can reduce workers’ productivity, conditional on being at work. Fourth, it can affect workers’ productivity through the quality of natural capital, which is an input into production; this is particularly the case in the agriculture sector.
Finding the right policy response is an increasing challenge, even more when public awareness is higher and citizens expect governments to act. In the European Union, for example, a recent opinion poll on the environment highlighted that air pollution is the issue of most concern for citizens after climate change (European Commission, 2018[5]). Expectations are thus soaring that effective action will be taken at all levels to reduce air pollution and protect citizens from its harmful effects. Reducing risks to human health from degraded air quality, then, is central for improving people’s lives and well-being (Roy and Braathen, 2017[3]).
1.2. Why is it important to address air pollution in Kazakhstan?
Air pollutants contribute to the increase in the incidence rate of associated illnesses and ailments in Kazakhstan. Consequently, they lead to direct and indirect losses to the national economy, including necessary medical care expenses and productivity losses. According to estimates, air pollution results in up to 6 000 premature deaths per year (Kazakhstan, 2013[6]). In 2015, a study based on the medical examinations of the population around industrial complexes (i.e. Temirtau, Ust-Kamenogorsk, Aktau and Ekibastuz) noted an increase of diseases in circulatory, respiratory and digestive systems (Ibrayeva, Amanbekova and Turgunova, 2015[7]). More than half of Kazakhstani citizens have a low level of satisfaction with air quality as pointed out by focus group results of April 2017. This group was conducted as part of the drafting of Kazakhstan 2025 Strategy National Development Strategy (Ministry of National Economy of Kazakhstan, 2017[8]).
The highest emissions are of SO2, total suspended particles (TSP) and NOx, which are formed in the process of power production and other human activities. They account for about 95% of the total emissions of harmful substances.2 In addition to the main air pollutants of cities and small towns, there are more than 70 kinds of harmful substances, including ozone, formaldehyde, hydrogen fluoride, lead compounds, ammonia, phenol, benzene, carbon disulphide and others. Stationary sources' emission trends as reported by the Ministry of Energy show some fluctuations for acidifying agent (SO2, NO2) but no clear increasing or downward trends (UNECE, 2019[9]). Emissions of non-methane volatile organic compounds doubled over 2011-16, while the hydrocarbon emissions were cut by more than half. SOx emissions per capita in 2014 were almost five times that of OECD Europe (OECD, 2019[10]).
Three sectors in Kazakhstan – the power industry with combustion sources, manufacturing and mining, and transport – account for the vast majority of Kazakhstan’s emissions. In 2016, 40% of SO2 emissions and 60% of NOx emissions from stationary sources in the country were caused by electrical power plants; most (45%) of these plants were powered by low quality coal and high ash content (UNECE, 2019[9]). Almost half of the generating infrastructure is older than 30 years and needs upgrading and modernisation (ADB, 2012[11]). Air pollution is a severe environmental problem in urban areas, especially in the industrial zones developed as production centres and located in industrialised oblasts. Air pollution in Almaty is one of the major environmental concerns. This is linked, among other sources, to the operation of three thermal power plants located in the city.3
Kazakhstan does not have a specific national air quality policy and legislation. Some policy directions for air quality are derived from other strategic documents, such as the 2013 Concept on Transition to Green Economy. Requirements for oblasts to develop and adopt policy documents to reduce air pollution do not exist, including for those with high levels of air pollution. This is contrary to the policy in most local jurisdictions in the OECD. In the latter, air (and water) quality standards are set first, and then emission limit values (ELV), or equivalent, are determined through permitting. This is be done in transitioning to best available techniques (BAT). However, it is also a result of setting environmental quality standards on the basis of levels of emissions that safeguard human and ecological “health”. These standards are drawn from an Air Quality Strategy covering transboundary, national and regional/local levels. An overall strategy can be supported by local plans. These would inform the setting of permit-specific ELV, which are based on BAT-AEL (Associated Emission Levels), but adjusted for local circumstances.
Since 2001, Kazakhstan has been a party to the Convention on Long-Range Transboundary Air Pollution. However, it has not yet ratified any of the Protocols to the Convention. Notwithstanding, Kazakhstan has reported an Informative Inventory Report and submitted emissions data to the Centre on Emission Inventories and Projections in 2017, although not in an electronic version.
The rules for maintaining the state register of pollutant emissions, approved by the Ministry of Energy dated 10 June 2016 No. 241, establishes the list of substances reporting by the Pollutant Release and Transfer Register (PRTR). It contains information on the volume of both actual air emissions of pollutants for 60 substances and water emissions for 62 substances. Kazakhstan has not yet ratified the PRTR Protocol to the Aarhus Convention (the Kyiv Protocol), and is still forming a PRTR system. Therefore, there is no consolidated information in the context of all pollutants and all sectors of the national economy. Kazakhstan has not yet engaged in substantive co-operation with the OECD or considered adhering to the OECD Council Recommendation on PRTR (OECD, 2018[67]). The country does not yet refer to the OECD harmonised list of pollutants for PRTR.
In 2017, 778 nature users of category I provided PRTR reports; the 70th largest polluters have provided PRTR reports for two consecutive years. The PRTR system is a collection of scanned reports of different enterprises. This does not allow for real-time ranking of emissions by type (air, water, soil), by industry, and structurally is quite far from the world’s PRTR systems. Also, the ranking of emissions reports in the PRTR system of Kazakhstan is not available; information is presented only by region. And some enterprises in some regions are not represented in the PRTR system at all. For example, the system does not issue any reports for Pavlodar and Turkestan. The PRTR system is thus not ready to provide full information about country emissions. Moreover, the system is unable to display a transparent picture of emissions. It works in a pilot mode, which allows enterprises to provide information on the emissions of their choice.
There are no specific policy documents, strategies and related action plans on achieving high levels of compliance with environmental requirements and effective methods of assurance. The country has not established strategic goals for compliance assurance. The system focuses on counting activities (fines, revealed violations) rather than obtaining compliance results. The inspectors’ work is still evaluated based on the fines and damage compensation claims imposed, rather than effectiveness of preventive and compliance promotion activities. With some exceptions, compliance promotion and dialogue with industry are not part of inspectors’ work (UNECE, 2019[9]).
1.3. A very much command-and-control environmental regulatory framework
In 2017, OECD analysis highlighted how the structure of Kazakhstan’s system of environmental regulation, permitting and payments impedes faster progress in improving energy efficiency and pollution control. The present report has found the country still has a “top-down” and “command-and-control” approach to regulations. Implementation of environmental requirements is still uncoordinated and discriminatory. And the high volume of complex environmental regulations is still based on unrealistic assumptions. The emphasis on environmental pollution payments as a means of raising revenue rather than on creating incentives to reduce environmental impact efficiently has limited environmental benefit. At the same time, this policy adds to the cost of investing and doing business in Kazakhstan.
More sophisticated drivers in the implementation of environmental regulations than just pollution taxes are quite uncommon in Kazakhstan. The following drivers should be considered:
-
Good corporate governance based on senior management willing and able to maintain constructive multi-level relationships with all direct stakeholders (government, competent authorities, banks, customers and counterparties, co-investors/partners, banks and employees/potential employees) and indirect stakeholders (press, non-governmental organisations, public, third party shareholders/pension funds, compliance sustainability departments, other competent authorities/regulators).
-
Foresight and awareness of the need to achieve social licence4 to operate, as future access to natural resources, in any country, and finance, from equity investors and banks, will continue to depend on current practices and environmental performance.
-
Technology, technical and knowledge-based ambition to select and adopt best available techniques. These would achieve a high general level of protection of the environment as a whole, at a minimum cost.
-
Regulatory and public scrutiny during permitting on the proposed pollution-control technology in approval documentation. This would be coupled with the inability to get approvals for pollution-causing projects.
-
High direct and indirect consequences of pollution incidents, well beyond administrative and criminal penalties. Adverse impacts would generate bad publicity together with serious monetary consequences. These could include suspension of operations for long periods, and/or the withdrawal of equity investments and loans.
-
Pressure from local community stakeholders with the increasing tendency to take action that forces operations to abate pollution. This would use a variety of means, including limiting access to routes and organising protests around the facilities/installations/plants. These actions would be compounded by the intensive use of social media to publicise pollution incidents.
-
Pressure from lenders and foreign investors, who are increasingly adding environmental and social covenants in funding agreements, up to refraining from funding projects and operations with poor environmental governance. Also, there is increasing scrutiny of companies listed on stock exchanges to meet the environmental, social and governance filtering criteria (“best in class”, “best effort” or “norm-based screening”), underpinning environmentally responsible investment strategies.
The basic instrument for pollution control for stationary sources is a system of environmental ambient quality standards (EQS). These are expressed through Maximum allowable concentrations (MAC), which are theoretically the determinant factor in setting ELV in permits for individual installations. Resource-users can legally emit pollutants into the environment as long as they hold such environmental permits. Competent authorities at the national and regional level issue permits depending on the size of the operation. Environmentally related taxes are levied based on emissions within and above the emission limit value. The three types of payments comprise taxes for authorised emissions, non-compliance penalties and monetary pollution damages (which are detailed hereafter). These environmentally related taxes (ERT) are common in Eastern Europe, Caucasus and Central Asia (EECCA) countries. However, they are unknown in most OECD members, except for several countries that were previously part of the Soviet Union.
1.4. Environmentally related taxes for industrial air pollutants: Focusing on raising revenues
1.4.1. ERT are now below OECD comparators
In Kazakhstan, ERT have fallen under the OECD and OECD average. This is mainly due to a sharp decline of taxes of useful minerals of oil sector companies, including penalties/damages. This assessment does include the tax on the production of minerals of the oil and non-oil sector, in line with the OECD approach to establish ERT, as defined by the PINE database (OECD, 2019[12]). This approach might differ from the data provided by the Committee on Statistics on budget revenues and expenditures on environmental measures. These tend to focus on revenues allocated to environmental measures nationally and in the regions.
The share of the tax on production of useful minerals of oil sector companies (including penalties/damages) is above 70%. This is unusually high, although it has been decreasing every year by almost 28%. In OECD Europe, for instance, the main environmental revenues are not linked to pollution charges (emissions into the environment), penalties or damages but are due instead to excise tax on fuel.
1.4.2. However, their design for industrial air pollutants is complex and diverges from OECD/EU acquis
Despite recent reforms brought about by the Environmental Code, environmental, pollution is still managed through regulations that include traditional post-Soviet mechanisms. Kazakhstan rarely uses more modern systems derived from OECD countries’ experiences.
EQS/MAC
Environmental ambient quality standards (EQS) underpin the regulation of pollution. These are expressed through maximum allowable concentration (MAC). MACs are binding limits for all users of a given environmental medium, such as air.
The MAC system is overly ambitious. It theoretically mandates low ambient concentrations of pollutants derived from the concept of zero risk to humans and the environment during the worst possible circumstances (e.g. worst-case meteorological conditions; most vulnerable part of population) (OECD, 2017[15]). However, most MACs were established before 1990 and the lists of ambient quality parameters have not been revised or harmonised with international standards since then. The MAC values are set for 683 pollutants. Every pollutant has a defined hazard class (from 1 to 4, with class 1 the most hazardous). Air quality standards are based on short-term maximum and daily mean values. However, effective monitoring capacity, in both public authorities and industry, falls well short of the ambition that the MAC lists indicate. The number of parameters that is actually monitored is rather small.
The system of EQS/MAC, however ambitious its parameters, is not fully effective and does not provide a realistic evaluation of air quality in the country. The comparison with, for example, EU standards gives a more understandable picture with respect to air pollution levels. Air quality measurement results (measured concentrations of air pollutants in 2010-12) show that, in a number of stations, the annual mean and monthly mean values for PM10 and NO2 are exceeding EU standards by (in some cases) a factor of two to three (World Bank, 2013[16]). There is thus widespread recognition of the need to reform the MAC system.
ELV
Resource users can legally emit pollutants into the environment as long as they hold an environmental permit that sets the ELV. Competent authorities at the national and regional level issue permits depending on the size of the operation. The permits, and the ELV contained within them, aim to ensure the quality of the environment at the surrounding residential area or at the boundary of the “sanitary zone” meets the hygienic requirements for air or water quality. This assessment considers the background pollution level.
Theoretically, ELV are set at levels to ensure the aggregate amount of emissions from all sources of pollution together with the level of pollution do not cause pollution levels in a given location to exceed the MAC. The calculation of ELV for individual enterprises in a given region, or oblast, involves computer-based simulations of pollutants’ dispersion in the space.
In practice, there are a number of problems with the manner in which ELV are determined during the permitting process.
-
The ELV in the permitting process are based on the level of historic pollution and background concentrations rather than emission limits that an industry could achieve when applying BAT.
-
KAZ’s industrial facilities typically obtain ELV based on the highest level of emissions measured during the maximum production output. This might facilitate compliance as enterprises often operate at a lower capacity without investing in processes, technologies and techniques.
-
The ELV should only be set for pollutants for which the establishment of ELV is mandatory. However, many environmental permit applications include ELV for all identified emissions regardless of their quantities and potential hazard. This occurs because of a lack of information about the mandatory list of pollutants for emission limits. This, in turn, results in redundant paperwork both for responsible environmental specialists at industrial facilities and environmental regulators. Moreover, it does not provide environmental/health benefits for industrial facilities and environmental regulators. It also leads to insufficient focus on pollutants that cause most health impacts.
The ELV significantly exceed European benchmarks for the main industrial emitters such as the heat and power industry, which are following Kazakhstan Technical Emission Standards.
-
SO2 ELV (2 000-3 400 mg/m3 for existing plants and 700-1 800 mg/m3 for new plants in KAZ) are also much higher than those in the European Union (150-400 mg/m3 under Directive 2010/75/EU) (European Commission, 2018[17]).
-
Similarly, NOx ELV (500-1 050 mg/m3 for existing plants and 300-640 mg/m3 for new plants) are higher than in the European Union (150-300 mg/m3).
-
The range of PM ELV for coal-fired power plants is 600-1 600 mg/m3 for existing plants and 100-500 mg/m3 for new ones. Both exceed by several times the level established by the European Union of 10-20 mg/m3.
Kazakhstan seems to be setting more stringent ELVs for new facilities, somewhat less stringent ones for existing plants after they have modernised and relaxed ones for existing plants before they modernise. However, existing facilities are not required to modernise to obtain their new permit. Therefore, existing industrial facilities can effectively continue to receive permits while operating with relaxed ELVs.
The Environmental Code also introduced integrated permitting on a pilot basis, following benchmarks established by EU Directive 2010/75/EU. However, as of early 2018, no application had been submitted for an integrated permit, in large part because there are no generally accepted BREF and the list of BAT published by the Ministry of Energy in 2014 is viewed by the operators as out-of-date and insufficient for this purpose.
In 2017, the OECD underlined an urgent need to optimise the permitting and compliance control requirements and to reform the establishment of ELV exclusively anchored in MAC (OECD, 2017[15]).
Environmentally related taxes for air polluting emissions from stationary sources
With respect to industrial air pollution, enterprises are subject to pollution taxes (tax payments for authorised emissions) for emissions below the ELV set in project documents and environmental permits.
The Tax Code specifies the tax rates per kilogram, per tonne or per GigaBecquerel. Pollution tax rates are set as coefficients multiplied by the monthly calculation index (MCI). For example, the rate per tonne of SOx emitted is ten times the MCI. The government establishes the MCI annually to consider inflation and other factors. The MCI is then used to determine taxes, as well as penalties and certain other payments.
Pollution tax rates for emissions within the ELV set in the permit are determined in a two-stage process. The Tax Code fixes the minimum or base tax rates, which apply for each of the 16 regional entities (14 oblasts and the cities of Almaty and Nur-Sultan).
A comprehensive reform of pollution charges in 2008 reduced significantly the number of pollutants subject to emission limits and emission payments. With the introduction of the new Tax Code, the list of air and water pollutants has been significantly reduced. To date, pollution charges are collected for 16 pollutants for emissions from stationary sources, for 13 pollutants for discharges into water bodies, and for eight pollutants from the combustion of associated and (or) natural gas in flares. There are also charges for pollutant emissions into the atmospheric air from mobile sources (gasoline, diesel fuel, gas and for disposal of production and consumption wastes.
Each oblast may then set a higher tax rate that does not exceed twice the base rate. Gas flaring by the oil and gas industry is an exception. Gas flaring was earlier subject to a locally imposed tax rates 20 times the base rate. This multiplier was eliminated in 2016, but tax rates on gas flaring (only) were correspondingly increased by a factor of twenty. Most Oblasts impose the highest possible rate of tax in each case.
Authorities impose administrative penalties when levels of emissions or discharges exceed the ELV set in project documents and environmental permits. Penalties can also be applied for the absence of an environmental permit, as examined in Chapter 3. A judicial system can enforce compensation (monetary damages) for environmental damage caused by emission into air. This is analysed in-depth in Chapter 4.
(OECD, 2017[15]) noted that ERT for air polluting industrial emissions are primarily used to raise revenue by excessively penalising non-compliance. It is also not clear whether environmentally related taxes collected at the local level are used effectively for improving environmental conditions and promoting a green economy. According to information provided by the government, only about 30% of revenues from environmental charges is spent on environmental protection measures (33% in 2016). This relatively low share would not have been questioned if environmental problems had been in check. However, evidence shows that environmental payments are used as a form of subsidy to address other problems, economic or social. Furthermore, no adequate resources are allocated to address pollution or reduce their impacts on human health or ecosystems (UNECE, 2019[9]).
1.4.3. The system is largely discretionary and discriminatory
The tax payments for authorised emissions are based on each enterprise’s ELV, which leaves room for discretion. This is not in line with standard environmental tax principles, which require a charge per unit of emissions except in the face of clear evidence of threshold effects.
As of now, the system involves different treatment for specific industrial operators. Enforcement officials, for example, target locally owned operators more than international operators. The system sets rates for taxes and fines, which are not uniform for all industry sectors. Rates for small and medium-sized enterprises (SMEs), for example, are lower than for large enterprises (OECD, 2017[15]). Utilities and power plants are entitled to a reduction of emission tax rates by applying coefficients of 0.3 for air pollutants, 0.43 for wastewater and 0.05 for ash. There are different rates applied for emissions of pollutants coming from the flaring of associated and/or natural gas. Consequently, the oil and gas industry pay from 20 to 278 times more per unit of emission than the heating and power plant (Table 1.2).
Anecdotal evidence suggests possibilities to negotiate a “better deal” with environmental authorities at the oblast level. Such an arrangement could gain exemptions or other forms of rent seeking instead of designing solutions to prevent and control pollution.
The calculation of penalties for emissions above the established ELV for large businesses is also subject to interpretation and discrimination. There are two types of discrimination at play: by type of business entity (SME/large) and between sectors (oil and non-oil). Foreign investment projects, which are both large, and predominantly in oil and gas, are thus subject at once to multiple discriminatory factors.
Article 243 of the Administrative Offence Code5 establishes how penalties are calculated on the volume over-limit emissions multiplied by a rate. Individuals entail a fine from 5 to 10 times the MCI. Officials, entrepreneurs, legal entities of SMEs are subject to fines from 20 to 50 times the MCI. Large enterprises are subject to a fine “in the amount of one thousand per cent rate for the emission in the environment for the exceeded amount of emissions”. Authorities interpret this to mean that the penalty should be calculated not only by multiplying the rate times ten, but also by multiplying the product by the amount of the relevant emissions.
The method to impose a punishment thus differs by type of business entities. In the case of SMEs, the multiplier is the MCI. For large enterprises, the multiplier is the rate in the Tax Code for the relevant pollutant. Oil and gas also have a different rate for gas flaring. Unsurprisingly, the penalties imposed can vary from thousands of tenge to millions of US dollars for the same amount of pollutants (OECD, 2017[15]). This is not consistent with fair and equal punishment for the same damage or public danger.
Kazakhstan would be well-advised to reform this highly punitive system of Associated Petroleum Gas flaring payments in line with practices with OECD members. This recommendation was made in the OECD Multi-dimensional Country Review of Kazakhstan (OECD, 2017[15]). The issue is discussed in Chapter 3 of this report.
1.4.4. High administrative costs discourage abatement
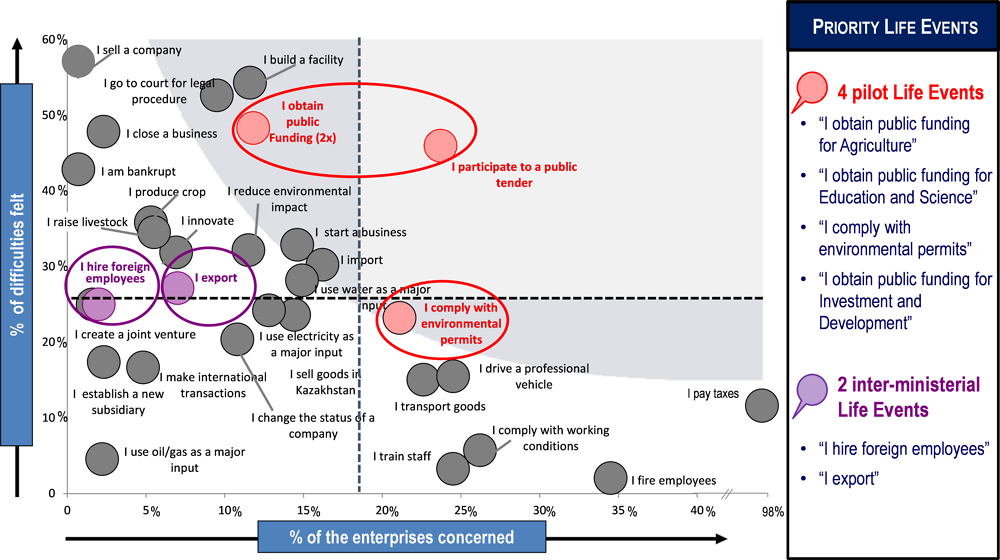
In 2014, the OECD defined life events as specific moments in the life of a typical business during which the business interacts with administration. This could include, for example, creating a business, participating in a public tender, or exporting goods and services. Four pilot ministries were selected for further analysis. Businesses reported “complying with environmental permits” as the most difficult and frequent life event when dealing with the Ministry of Energy (see Figure 1.1).
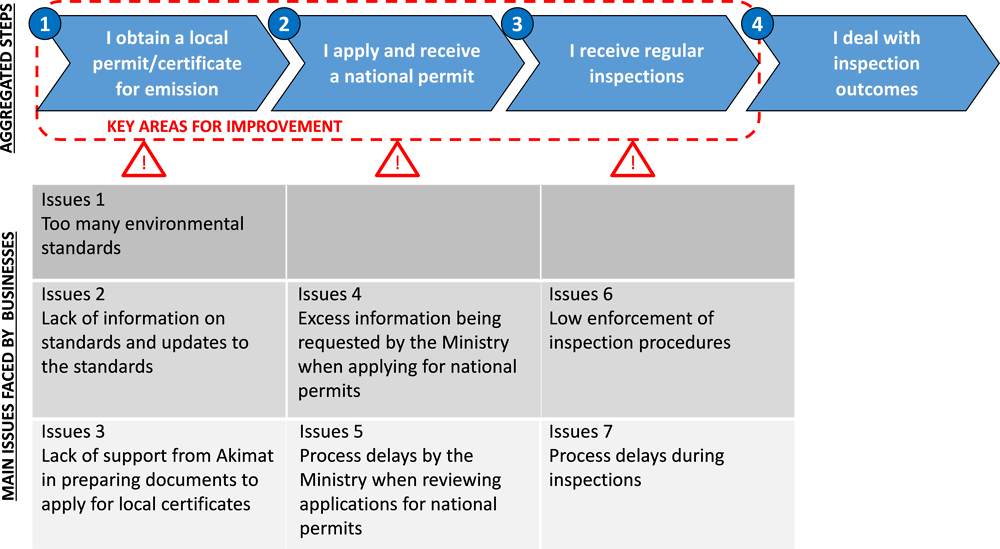
Additional analyses used customer mapping. This tool analyses the process of tracking and describes all of customers’ experiences with a government service. It identified seven issues when dealing with air emissions standards (see Figure 1.2).
Source: (OECD, 2016[18])
Source: (OECD, 2016[18]).
Interviews with environmental managers6 suggested two findings. First, managers did not feel incentivised to implement or diffuse BAT. Second, they were not familiar with “cleaner production” or use of best available equipment or techniques.
Under the Code, a list of BAT for selected processes and industries was developed and approved (Order of the Ministry of Energy No. 155 of 28 November 2014 “On Approving the List of Best Available Techniques”). The Environmental Code (as amended) defined the requirements for the transition to technical specific emission standards. They are based on the introduction of BAT (Article 26)7, which are established in technical regulations and the basis of integrated environmental permits.
However, most environmental activities are still focused on “end-of-pipe” solutions. The present BAT approved in the country are suboptimal. They are not fully consistent with the basic BAT concept, which is aimed at combining pollution prevention and control. The documents merely provided specific technical emission limits and reference methodologies for three industrial processes. These are largely insufficient, considering the variety of processes available in Kazakhstani industrial facilities.
The BAT were established without a fully representative multi-stakeholder platform. They are not linked to the permitting regulations; and industrial facilities are poorly informed about the approved list of BAT. Economic actors still perceive the move towards BAT as a risk. The International Green Technologies and Information Centre organised the first conference on BAT in Astana on 6 December 2018.8 Before this conference, the government had not carried out awareness-raising campaigns on the benefits of the integrated environmental permit system and BAT. Nor had it created adequate incentives to stimulate economic actors to shift to BAT, such as supporting businesses to conduct a baseline assessment.
The OECD Kazakhstan Regulations for Competitiveness Project aimed to enhance the country’s competitiveness through better regulations and institutions. Within the framework of the project, the OECD Eurasia Competitiveness Programme and the government of Kazakhstan established six working groups to enhance public service delivery for the private sector in the country. With contributions from international experts and peer reviewers of selected OECD member countries, the project carried out data collection, analysis and consultations with stakeholders in Kazakhstan. In this way, they identified business priorities for enhancing private sector competitiveness, using the “Life Event Strategy” approach. This project recommended how Kazakhstan could further consolidate implementation of a Life Event Strategy.
The methodology of the survey underpinning the analysis was based on OECD member countries’ good practice, especially that of France. The survey was carried out between November and December 2013. A representative sample of 1 000 foreign and local companies operating in Kazakhstan was chosen to participate in the telephone interview. The sample broadly reflected the general profile of companies in Kazakhstan by sector, size and regional location. The sample coverage included Almaty City, Astana City and all 14 regions (oblasts).
For each life event, the survey asked the following questions: has the user performed administrative procedures related to the life event in the last two to three years? If the user has experienced the life event recently: were the respective administrative procedures very simple, simple, rather complex or very complex? If the respective administrative procedures are stated by the user as rather complex or very complex: what constraints did the user encounter?
Thus, the specific objectives of the survey were to answer the following: which life events are most commonly experienced by enterprises? Which life events presented businesses with the most difficult administrative procedures? Do users’ experiences of the most common life events, or life events that raise most administrative difficulties, vary (e.g. by region, sector or by size of company)?
Four pilot ministries were involved in the project:
-
1. the Ministry of Agriculture, in charge of reforming the life event “I obtain public funding/I participate in a public tender”
-
2. the Ministry of Education and Science, responsible for reforming the life event “I obtain public funding/I participate in a public tender”
-
3. the Ministry of Investments and Development, responsible for reforming the life event “I obtain public funding/I participate in a public tender”
-
4. the Ministry of Energy, responsible for reforming the life event “I comply with environmental permits”.
Source: (OECD, 2016[18]).
Unsurprisingly, advanced abatement techniques are not installed in industrial facilities. Sufficient measures to reduce traffic emissions (e.g. cleaner fuels) are not implemented to achieve better and healthy air quality. State-of-the-art technical measures, such as those described in EU Best Available Techniques Reference Documents, are not prescribed in environmental permits. In practice, the integrated permitting system based on BAT has not yet been widely adopted.
These findings reinforce the need to raise awareness and educate businesses as a key element of introducing reforms for permitting and supervision. The draft of the revised Environmental Code includes provision for a Strategic Environmental Action Plan and Regional Programmes (Art 47). Education and awareness raising should thus be priority objectives in the plan.
Moreover, basic regulation and technical requirements (similar to the EU BREF on environmental monitoring systems) is lacking, making it impossible to design compliant and cost-effective industrial monitoring solutions. In practice, companies must still monitor many more pollutants than the 16 subject to a pollution tax. Kazakhstan still has several lists of pollutants subject for mandatory control, including ones for mandatory setting of emission limits and ambient air quality standards (World Bank, 2013[16]).
Finally, at the level of the competent authority, technical understanding of the context for the issuance of the permit, the project and operations is insufficient. The impact assessment processes are far too focused on pollution payments. More attention is needed on proper detailed investigations to understand the unique setting of the operations and influence design of operations to minimise impacts. Under the system, an environmental action plan is part of the permit application. The formal implementation of its provisions is subject to strict control (e.g. scope of measures, status of implementation, actual financial requirements), with limited flexibility for adaptation. As long as the ELV are not exceeded, companies normally plan relatively small changes in operational and maintenance measures. In addition, there is no motivation for continuing environmental improvements and engaging with the competent authorities.
1.5. Air pollution regulations and environmentally related taxes in the OECD
1.5.1. The challenge of environmental fiscal reform, rationales and factors shaping the design of environmentally related taxes
There is a range of policy approaches to limit outdoor air pollution. In many countries, various economic instruments/market-based instruments complement “command-and-control” approaches using regulatory standards. Table 1.3 summarises selected examples of different policy approaches to address air pollution. In most OECD member countries, air pollution policy interventions have become increasingly integrated over the last 10-15 years, helping to increase cost efficiency. Examples include the US Clean Air Act, the Canada-US Air Quality Agreement, Clean Air for Europe and the National Environment Protection Measure for Ambient Air Quality (Australia). All of these acts of legislation have set standards for air quality, focusing on target-setting for a range of air pollutants from stationary sources. These overall frameworks include legislative programmes that target specific sectors, such as power generation, transport, industry and households. Non-OECD countries have fewer examples of cohesive programmes for controlling air pollution. Much of the focus is on specific policies for controlling emissions from transport, both through standards and economic instruments.
Information on a large number of economic instruments and voluntary approaches for air pollution can be found in the OECD/EEA Database on Instruments used for environmental policy.9
There is no single “right approach” when designing instruments to address air pollution, in particular for stationary sources. Solutions need to be found depending on the specific objectives and consider the economic, political and cultural context. However, several guidelines are considered in OECD member countries:
-
Environmentally related taxes should provide an ongoing incentive to abate, improving the competitiveness of low-emission alternatives, and providing a strong incentive to innovate before raising revenues to use them in a socially productive way.
-
Environmentally related taxes should thus be targeted to the pollutant or polluting behaviour, with few (if any exceptions).
-
The tax base is targeted on the pollutant rather than on products serving as proxies.
-
The scope of environmentally related taxes is ideally as broad as the scope of the environmental damage.
-
The tax must be credible and its rate predictable to motivate environmental improvements.
-
It has to balance desirability from an air pollution prevention and control point of view, and be technically and economically feasibility.
-
Finally, MBI may need to be combined with other instruments to obtain the most efficient and effective policy package to address air pollution, but care should be taken to assess the impact of overlapping instruments.
1.5.2. Choosing between market-based instruments and regulations
In OECD member countries, environmental policy typically has been, and to a high degree still is, dominated by regulations as opposed to market-based instruments (MBIs). These regulatory approaches can be prescriptive and highly targeted. For example, they can ban or limit particular substances or require certain industries to use specific technologies. Over recent decades, interest has grown in MBIs such as taxes and tradable emission permits, in addition to or instead of regulations.
There are a number of reasons for the increasing use of ERTs. Taxes can directly address the market failure that causes markets to ignore environmental costs. A tax on any given item that accurately reflects the cost of its environmental damage obliges businesses and consumers to confront the true cost of their production or consumption choices. In other words, it “internalises” what had been an “externality”. At the same time, it leaves businesses and consumers free to decide how best to adjust those choices. Thus, by drawing on all the relevant dispersed pools of knowledge while respecting individual preferences, it enables a reduction in environmental damage at least cost to society.
Most regulatory approaches involve the government specifying how to reduce emissions or who should do the reduction. Similarly, subsidies and incentives for environmentally preferable goods or practices could involve the government steering the economy in favour of certain environmental solutions over others. Both approaches could involve the government trying to “pick winners” – directing the market in a prescriptive way. This requires significant information about ever-changing conditions and technologies, and carries significant risk of making suboptimal choices. Regulations generally result in higher costs than taxes since they force particular types of abatement, even if cheaper alternatives are available (OECD, 2011[20]).
The higher cost of the polluting activity that results from the environmental tax makes the activity less attractive to consumers and businesses. In contrast to regulations or subsidies, however, a tax leaves consumers and businesses full flexibility to decide how to change their behaviour and reduce the harmful activity. This allows market forces to determine the least costly way to reduce environmental damage (OECD, 2011[20]). That said, market-based instruments work if the market performs as expected, but this is not always the case. A binary choice is thus not necessary; a mix of approaches can be used with state intervention as a backstop to fiscal measures. In some cases, financial instruments can have unintended consequences. For example, if a landfill tax is set too high, fly-tipping is likely to increase. It is good practice to model the sector/market in order to choose the appropriate mix of interventions. This is covered in a later section of the report.
1.5.3. Choosing among MBIs: Taxes/fees/charges, trading or tax incentives
Taxes increase the cost to a polluter of generating pollution, providing incentives for firms to develop new innovations and to adopt existing ones. For example, the increased demand for more fuel-efficient and alternatively powered processes induced by fossil fuel taxes provides an important incentive for machine makers to develop such a machine and for customers to buy them. Under regulation-based approaches, these incentives disappear once firms have complied with the regulated standard. Enhanced innovation lowers the cost to society of addressing environmental challenges in the long run – adapted from (OECD, 2017[21]).
In OECD member countries (OECD, 2017[21]), emissions trading systems are different from taxes where tradable permits are allocated for free instead of auctioned. In those cases, no public revenue is raised. Since public revenue is scarce, auctioning of permits in principle is preferred. In addition, permit allocation rules can affect market entry and exit decisions in ways that slow down the reduction of pollution. This can occur, for example, in cases where incumbent, pollution-intensive firms receive disproportionate allocations of permits. Also, for trading to work well, markets need to be well-designed with a large number of trading parties, a set of conditions that is not straightforward to meet. These potential downsides of trading systems have to be weighed against the practice, and not the theory, of ERTs. It is not unusual for preferential tax rates to blunt the environmental effectiveness of ERTs. For an example, see the discussion in (Smith, 2008[22]).10 In the case of Kazakhstan, the ETS is a first attempt. Given the limited competing parties in several sectors of the economy, it is still too early to decide if this instrument will be well adapted to the local context.
Like other subsidies, tax incentives have a number of important limitations. It is difficult to subsidise all potential environmentally beneficial alternatives to the harmful activity (some of which may not exist yet). Therefore, tax subsidies inevitably involve “picking winners”, which may disadvantage other good alternatives.11 Tax incentives are a form of spending public revenue, in contrast with taxes, which add to public revenue. This tends to favour the use of taxes, as government revenue usually is scarce. These limitations of tax incentives do not imply they should not ever be used. However, they do suggest caution, and should perhaps be used less frequently or designed more strictly.
References
[11] ADB (2012), Country Partnership Strategy: Kazakhstan 2012–2016, Asian Development Bank, Mandaluyong, Philippines, https://www.adb.org/sites/default/files/linked-documents/cps-kaz-2012-2016-ssa-02.pdf.
[5] European Commission (2018), Communication on “A Europe that protects: Clean air for all”, https://eur-lex.europa.eu/legal-content/EN/TXT/PDF/?uri=CELEX:52018DC0330&from=FR.
[17] European Commission (2018), Summary of Directive 2010/75/EU on Industrial Emission, European Commission, Brussels, http://ec.europa.eu/environment/industry/stationary/ied/legislation.htm.
[7] Ibrayeva, L., A. Amanbekova and L. Turgunova (2015), “Influence of ecologic factors on respiratory diseases in urban residents of Kazakhstan”, Meditsina truda i promyshlennaia ekologiia, Vol. 3, pp. 29-33, http://europepmc.org/abstract/med/26036021.
[6] Kazakhstan (2013), Concept for Transition of the Republic of Kazakhstan to Green Economy Approved Decree of the President of the Republic of Kazakhstan on May 30, 2013 #557.
[8] Ministry of National Economy of Kazakhstan (2017), Strategic Plan for Development of Kazakhstan until 2025, Technological Modernisation for Accelerated Growth and Better Quality of Life.
[10] OECD (2019), “Air and GHG emissions”, (indicator), https://dx.doi.org/10.1787/93d10cf7-en (accessed on 29 January 2019).
[12] OECD (2019), Database on Policy Instruments for the Environment, https://pinedatabase.oecd.org/ (accessed on 13 February 2019).
[13] OECD (2019), “Environmentally related tax revenue”, in OECD.stat, https://stats.oecd.org/Index.aspx?DataSetCode=ENV_ENVPOLICY# (accessed on 13 February 2019).
[14] OECD (2018), Kazakhstan Detailed Tax Revenues, (database), http://dotstat.oecd.org/Index.aspx?DataSetCode=REVKAZ (accessed on 13 February 2019).
[21] OECD (2017), Environmental Fiscal Reform: Progress, Prospects and Pitfalls, OECD Report for the G7 Environment Ministers, OECD Publishing, Paris, https://www.oecd.org/tax/tax-policy/environmental-fiscal-reform-G7-environment-ministerial-meeting-june-2017.pdf.
[15] OECD (2017), Multi-dimensional Review of Kazakhstan: Volume 2: In-depth Analysis and Recommendations, OECD Development Pathways, OECD Publishing, Paris, https://doi.org/10.1787/9789264269200-en.
[18] OECD (2016), Peer Review Note: Enhancing Public Service Delivery for the Private Sector in Kazakhstan, OECD Publishing, Paris, https://www.oecd.org/eurasia/competitiveness-programme/central-asia/Peer-Review-Enhancing-Public-Service-Delivery-Private-Sector-Kazakhstan.pdf.
[4] OECD (2016), The Economic Consequences of Outdoor Air Pollution, OECD Publishing, Paris, https://dx.doi.org/10.1787/9789264257474-en.
[19] OECD (2012), OECD Environmental Outlook to 2050: The Consequences of Inaction, OECD Publishing, Paris, https://doi.org/10.1787/9789264122246-en.
[20] OECD (2011), Environmental Taxation - A Guide for Policy Makers, OECD Publishing, Paris, https://www.oecd.org/env/tools-evaluation/48164926.pdf.
[23] Prno, J. and S. Slocombe (2012), “Exploring the origins of ‘social license to operate’ in the mining sector: Perspectives from governance and sustainability theories”, Resources Policy, Vol. 37/3, pp. 346-357, https://doi.org/10.1016/j.resourpol.2012.04.002.
[3] Roy, R. and N. Braathen (2017), “The rising cost of ambient air pollution thus far in the 21st century: Results from the BRIICS and the OECD Countries”, Environment Working Papers, No. 124, OECD Publishing, Paris, https://doi.org/10.1787/d1b2b844-en.
[22] Smith, S. (2008), Environmentally Related Taxes and Tradable Permit Systems in Practice, OECD, Paris, http://www.oecd.org/officialdocuments/publicdisplaydocumentpdf/?doclanguage=en&cote=com/env/epoc/ctpa/cfa(2007)31/final.
[9] UNECE (2019), Environmental Performance Reviews: Kazakhstan, Third Review, Environmental Performance Reviews Series, United Nations Economic Commission for Europe, Geneva.
[1] WHO (2014), “7 million premature deaths annually linked to air pollution”, Press Release, 24 March, http://www.who.int/mediacentre/news/releases/2014/air-pollution/en/.
[2] WHO (2014), Burden of Disease from Household Air Pollution for 2012: Summary of Results, World Health Organization, Geneva, https://www.who.int/phe/health_topics/outdoorair/databases/FINAL_HAP_AAP_BoD_24March2014.pdf.
[16] World Bank (2013), Joint Economic Research Program (JERP), Towards Cleaner Industry and Improved Air Quality Monitoring in Kazakhstan, World Bank, Washington, DC, http://documents.worldbank.org/curated/en/132151468047791898/pdf/839150WP0P133300Box0382116B00OUO090.pdf.
Notes
← 1. See pp. 9-10 (Roy and Braathen, 2017[3]).
← 2. Based on data provided by the Ministry of Energy.
← 3. CHP-1 (145 mW; 203 Gcal/hr); CHP-2 (510 mW; 176 Gcal/hr); CHP-3 (173 mW; 335 Gcal/hr). See Passport of asset: “Almaty electric power plants" https://sk.kz/local/ajax/download.php?id=866128.
← 4. A social licence can be considered to exist when a project is seen as having the ongoing approval and broad acceptance of society to conduct its activities. See Prno and Slocombe (Prno and Slocombe, 2012[23]).
← 5. See http://adilet.zan.kz/eng/docs/K010000155_.
← 6. Mainly conducted by the World Bank (World Bank, 2013[16]), the OECD mining competitiveness project and through discussions with the Kazakhstan Association of Metal and Mining Companies.
← 7. http://adilet.zan.kz/eng/docs/K070000212_.
← 8. See http://lenta.inform.kz/kz/kazakhstan-intends-to-introduce-new-eco-regulation-regime_a3474581).
← 9. See at www.oecd.org/env/policies/database.
← 10. See (OECD, 2017[21]): “Emissions trading systems may perform better than taxes in cases where attaining a particular level of pollution is essential. This is because trading systems first define the level of pollution abatement (or the cap on pollution) and then use the permit-trading mechanism to allow reaching the cap in a cost-effective manner. The permit price will only become known once trading takes place. With taxes, the price of every unit of pollution is known in advance. However, it is uncertain exactly how much abatement will take place, as many factors other than the tax influence that outcome. Nevertheless, knowing the price of pollution helps investors make abatement decisions, so taxes can give stronger abatement incentives than emission-trading systems”.
← 11. See (OECD, 2017[21]), for example. A subsidy for low-emission vehicles does not provide any incentive for commuters to consider alternative forms of transportation, such as public transit or cycling. Also, it has been observed that tax incentives result in higher supply prices. For example, with inelastic labour supply, tax incentives for R&D can result in higher wages for R&D workers instead of, or in addition to, increased adoption of the intended behaviour.