Chapter 2. A declining middle-income class?
This chapter gathers international evidence on whether, where, how, to what extent and why middle-income households have been squeezed in recent decades. It begins by drawing up a definition of the middle-income class applicable to all OECD countries, which it uses to measure the size of the middle-income class over time and make comparisons between countries. It examines the changes in the income, population size and economic influence of the middle-income class. It also focuses is on how the socio-economic and demographic make-up of middle-income households has evolved and for which groups it has become more difficult to make it to middle incomes. Finally, it assesses the effect of taxes and benefits on middle-income households.
The statistical data for Israel are supplied by and under the responsibility of the relevant Israeli authorities. The use of such data by the OECD is without prejudice to the status of the Golan Heights, East Jerusalem and Israeli settlements in the West Bank under the terms of international law.
Introduction and key findings
The decline of the middle class first became an issue in the United States in the 1980s. It then gathered momentum and spread to other OECD countries in the wake of the global financial crisis. Despite considerable public and political debate, however, there is still no clear evidence as to a general decline of the middle-income class.
This chapter seeks to gather international evidence on whether, where, how, to what extent and why middle-income households have been squeezed in recent decades. It begins by drawing up a definition of the middle class applicable to all OECD countries, which it uses to measure the size of the middle-income class over time and make comparisons between countries (Section 2.1). It goes on to examine the changes in the income, size and economic influence of the middle class in recent decades (Section 2.2). Section 2.3 focuses on how the socio-economic and demographic make-up of middle-income households has evolved in recent decades. Section 2.3 assesses the effect of taxes and benefits on middle-income households and Section 2.4 concludes.
From the analysis and evidence in this chapter the following findings emerge:
-
A majority of people in OECD countries (61% on average) live in middle-income households, i.e. those whose incomes are between 75% and 200% of the national median household income. In emerging economies, the middle-income group is smaller, accounting for between one-third and a half of the population, and fewer people identify themselves as middle class (see Chapter 1).
-
Median incomes have grown, in real terms, only slowly since the crisis. Between 2007 and 2016, they rose by an average of 0.3% per year. Between the mid-1980s and mid-1990s, they had grown at more than three times that rate (1%) and between the mid-1990s and mid-2000s, more than five times as fast (at 1.6%).
-
The economic “centre of gravity” is tilting away from the middle. Income growth in the middle has been much weaker than at the top. In the mid-1980s, the combined income of all middle-income households was four times the aggregate income of all upper-income households. Currently, it is less than three.
-
The chances of being middle-income have fallen among families with children and young adults. In contrast to 30 years ago, most single-parent families are today in the lower-income class and young adults are the least likely of all age groups to be in middle-income households. Since the generation of the baby boomers, each new generation has seen its chances of belonging to the middle-income class fall.
-
Middle-income households contribute the most to income tax revenues and receive the bulk of social security monetary benefits. However, they pay slightly more in taxes than they receive in benefits. In the last decade, social benefits contributed as much as market incomes (labour and capital income) to the growth of middle incomes, despite accelerated market-income growth in recent years.
2.1. Who is considered middle-income?
In line with the remainder of the report, this chapter considers the “middle-income class” to be people living in households with incomes ranging between 75% and 200% of the national median. Households with incomes of below 75% are “lower income” and those whose incomes exceed 200% are “upper income”. For some of the analyses, the middle-income class is divided into three income-related groups: lower-middle (75% to 100% of median income); mid-income (100% to 150%); and upper-middle (150% to 200%).
Similarly, among lower-income households, where income is less than 75% of the national equivalised median, those that bring in less than 50% are “poor”.1 As for people who earn less than 75% but above 50%, they are referred to as “non-poor lower-income”.
Analysis here also considers the profiles of income classes by age, household structure, work and income source.
Definitions of the middle-class that use the income metric are particularly suitable for international comparison as income data are widely available, comparable and consistent over time and between countries. (For a detailed discussion of approaches to and methodologies for defining the middle class, see Box 1.1 in Chapter 1.) Furthermore, income usually correlates with other determinants of social class, such as occupation, education, self-identification and consumption.
Income-related definitions of the middle class use a variety of approaches to determine the “middle” (Atkinson and Brandolini, 2013[1]). One such approach takes absolute income thresholds, as illustrated by way in which the World Bank identifies the middle class in the emerging economies of Latin America and the Caribbean. It sets lower and upper thresholds of USD10 and USD50 per day, adjusted for international differences in purchasing power (Ferreira et al., 2012[2]). Indicators based on absolute amounts are intuitive and easily understandable by the public. However, they are more suitable for emerging economies, where analysis of absolute living standards are more widely used.
A second approach defines the middle class as a population group in the income distribution. The Brookings Institution, for example, takes the middle 60% of the income distribution – i.e. the second to fourth quintiles (Reeves and Guyot, 2018[3]). Although this approach makes it relatively easy to compute and interpret indicators, it works on the assumption that the share of households in the middle class is constant. It cannot therefore measure whether the middle class population is rising or falling or compare such changes from country to country. Instead, it captures the size of the middle class by its income share – i.e. the proportion of overall income that is held by the middle 60%.
A third approach uses an income threshold determined by a benchmark indicator. It is the approach used in this chapter and in several national and international studies (Thurow, 1984[4]; Pew Research Center, 2015[5]; Pew Research Center, 2017[6]). Two of its particularly attractive characteristics are consistency with the measurement of relative poverty2 and the ability to measure whether the size of the middle class varies between countries and changes over time.
2.1.1. Most people are in the middle-income class
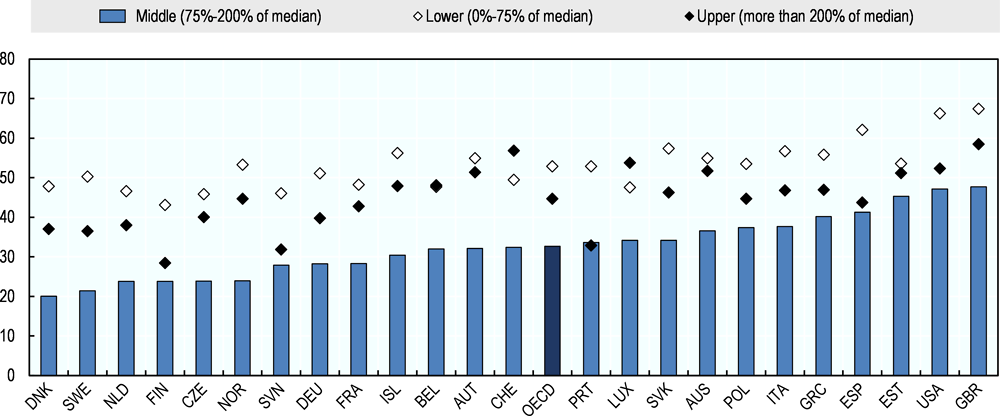
In all OECD countries but Mexico and Chile, most people live in middle-income households, earning between 75% and 200% of the median national income. The middle-income class thus accounts for 61% of the OECD-wide population, ranging from around one-half in Chile, Mexico and the United States to some 70% in Iceland, the Czech Republic, the Netherlands, Norway and Slovak Republic (Figure 2.1). In emerging economies, however, the middle-income class constitutes much smaller shares of populations – from roughly one-third in South Africa to about half in Russia and China.
One in ten people live in upper-income households – with incomes that are over double the national median. In Denmark and Norway, the upper-income group makes up just 4% of the population, while the figure in Chile and Mexico is almost 20%. Shares are also high in most emerging economies. In India and South Africa, for example, upper incomes account for about 25% of the population.
Three out of ten people OECD-wide are lower income. An average of 30% live in households with incomes of less than 75% of the national median. Of those, about one-third are poor (earning less than half the national median income). Only in a handful of countries (Israel, Mexico and the United States), as well as in all emerging economies, are most people with lower incomes poor.

Note: Middle-income classes and median incomes are defined relative to equivalised household disposable income. The middle-income class comprises individuals in households with income between 75% and 200% of the median. The OECD average covers all OECD countries in the graph.
Results refer to the year 2013, with exceptions of Australia (2014), Chile (2015), Germany (2015), Hungary (2015), Israel (2016), Island (2010), Italy (2014), Japan (2009), Korea (2012), Mexico (2012), Poland (2016), Slovenia (2012), Turkey (2014), United States (2016), South Africa (2012), and India (2011).
Source: OECD calculations based on data from LIS Cross-National Data Center, except Japan (Tanaka and Shikata, 2019[7]) - based on data from the National Survey of Family Income and Expenditure (NSFIE); Belgium, France, Ireland, Iceland, Latvia, Lithuania, Portugal and Sweden – European Union Statistics on Income and Living Conditions (EU-SILC); and Turkey (SILC).
2.1.2. Richer countries have larger middle-income classes
In countries with higher median incomes, larger shares of the population are in the middle-income class. There is a significant positive relationship between the level of household median income in purchasing power parities and the size of the middle-income class (Figure 2.2). It is particularly strong in countries whose median annual income is below USD 10 000 in purchasing power parity. It weakens, though still positive, in higher-income countries.
There are two striking exceptions to the positive relationship between absolute median income and the size of the middle-income class:
-
The United States. Although it boasts the fourth-largest median income, it has only the 31st-largest middle-income class of all OECD countries. Related statistics are that its population has the third-largest share of people in poverty and the fourth-largest in the upper-income class (Figure 2.1).
-
The Central European countries of the Czech Republic, the Slovak Republic, Hungary and, to a lesser extent, Poland and Slovenia. In these countries, the shares of the population in the middle-income class exceed what might be expected from their median income levels.3

Note: Middle-income classes and median incomes are defined relative to equivalised household disposable income. The middle-income class comprises individuals in households with incomes that are between 75% and 200% of the median. The OECD average covers all OECD countries in the graph.
Results refer to the year 2013 except Australia (2014), Chile (2015), Germany (2015), Hungary (2015), Israel (2016), Island (2010), Italy (2014), Japan (2009), Korea (2012), Mexico (2012), Poland (2016), Slovenia (2012), Turkey (2014), United States (2016), South Africa (2012), and India (2011).
Source: OECD Secretariat calculations based on data from LIS Cross-National Data Center, except Japan (Tanaka and Shikata, 2019[7]) – based on (NSFIE), Belgium, France, Ireland, Iceland, Latvia, Lithuania, Portugal and Sweden (EU-SILC) and Turkey (SILC).
2.1.3. How much income does a household need to be middle-income?
The income levels that take households into the middle-income class vary from country to country. Median disposable incomes (adjusted for one-person households and international differences in 2010 purchasing power)4 range from USD 5 010 in Mexico to USD 35 310 in Luxembourg. To be middle income, therefore, a person living alone would need an annual income of between USD 3 757 and USD 10 019 in Mexico and between USD 26 482 and USD 70 620 in Luxembourg (Table 2.1).
Nevertheless, income thresholds that define middle-income groups in most OECD countries overlap each other. Thus, despite cross-national differences in income, many income levels would enable middle-income households from one country to qualify as middle income in another. With an income of USD 23 000, for instance, people would be in the middle-income class in 27 of the 35 OECD countries in Table 2.1. Only in Luxembourg, Norway, Switzerland and the United States would the amount be insufficient, while in Greece, Turkey, Chile and Mexico it would put people in the highest income class.
2.2. Middle incomes have stagnated, hollowed out and lost influence
2.2.1. Middle incomes are falling behind
In the wake of the global financial crisis and the weak economic recovery, middle incomes have grown at a slower pace in the last decade than in previous ones. Between 2008 and 2016, real median incomes – an indicator close to middle incomes5 – grew at an annual rate of 0.3%6, compared to 1% between the mid-1980s and mid-1990s, and 1.6% between the mid-1990s and mid-2000s – when income growth was strongest among all income groups (Figure 2.3, Panel A). Middle incomes grew more slowly than those at the top in each of the last three decades. OECD-wide, median incomes grew by one-third less than those at the top 10%.
Among the 19 OECD countries with data available for two or more decades, only Israel and Turkey boasted growth in median incomes that was considerably higher over the last decade than in previous ones (Figure 2.3, Panel B). Elsewhere they either fell or stagnated: in 21 of the 36 OECD countries they dropped or grew by an annual average of less than 1% since 2008. In Greece, Italy, Japan, Mexico, Slovenia and Spain, median incomes in the mid-2010s were considerably lower than in 2008, after accounting for inflation. And in the case of Greece, the decline was equivalent to a fall of almost 6% per year. In only six OECD countries did median income growth exceed an average of 2% per year – Korea and Sweden (around 2%), Hungary, Israel and Poland (about 3%) %), and Chile and Turkey (roughly 4%). Median income also grew quickly in China, at 5% per year, and India, with 4%.
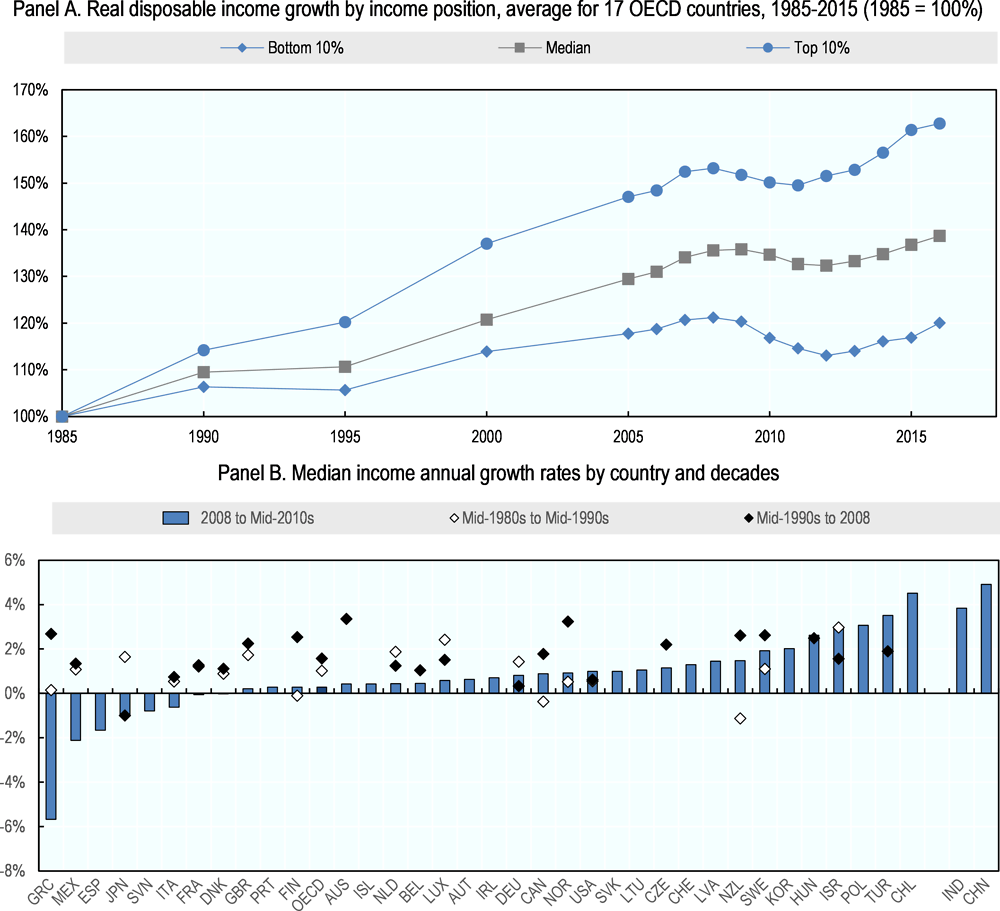
Note: Panel A shows the unweighted average for 19 countries: Belgium, Canada, Germany, Denmark, Finland, France, United Kingdom, Greece, Israel, Italy, Japan, Luxembourg, Mexico, Netherlands, Norway, New Zealand, Sweden, Turkey and United States. In Panel B, “Mid 1980s” refers to 1983 for Sweden, 1984 for France, Italy, Mexico and United States and 1986 for Finland, Greece, Luxembourg and Norway. “2007” relates to 2008 for Australia, Germany, France, Israel, Mexico, New Zealand, Sweden and the United States, and to 2009 for Japan. “Mid 2010s” refers to 2016 for Finland, the United Kingdom, Israel, Latvia, the Netherlands, Sweden and the United States; 2014 for Australia, Hungary, Iceland, Mexico New Zealand; an 2015 for the remaining countries..
Source Calculations from OECD Income Distribution Database (http://oe.cd/idd).
2.2.2. Are middle incomes being hollowed out?
Fewer people are in the middle-income class than three decades ago. The OECD-average share of people in middle-income households fell from 64% to 61% between the mid-1980s and mid-2010s (Figure 2.4, Panel A). The decline was spread evenly across time, roughly 1 percentage point per decade and accompanied by corresponding expansions of the lower- and upper-income classes. Worryingly, the rise at the bottom of the distribution was attributable chiefly to growing poverty.
Albeit generally modest, changes in the size of the middle-income class have been significant in a number OECD countries. Between the mid-1980s and mid-2010s, there was a drop of three percentage points in 9 of the 17 countries with available data (Figure 2.4, Panel B). The fall was particularly steep in Sweden and Finland, where the middle-income classes were very large and are still bigger than the OECD average (Figure 2.1). In Israel, too, the decline was sharp, as it was in Canada, Germany, Luxembourg and the United States. Only in France and Ireland were there sizeable expansions.
Both lower- and upper-income classes expanded in most countries where the middle-income class shrank. Furthermore, they grew to similar degrees in several countries, e.g. Australia, Canada, Finland, Germany, Israel, Luxembourg and Norway. In only a few countries did declines in the middle-income group swell lower-income classes considerably more than the upper-middles (Spain and Sweden) or considerably less (Netherlands and the United States). In the United Kingdom, both the lower- and middle-income classes contracted as the upper-income group grew in size.
The upper-middle-income class expanded in size in many countries where the middle-income class fell. Out of 15 OECD countries where middle-income households are now scarcer than before the global financial crisis, the upper-middles have increased their share.
Only in Australia, the Netherlands, the United Kingdom and the United States have there been significant falls in the upper-middle and middle-income classes. Of the three countries where the middle-income group grew – Denmark, France and Ireland – the upper-middle-income class also grew in Denmark, but shrank in Ireland and, in particular, in France.
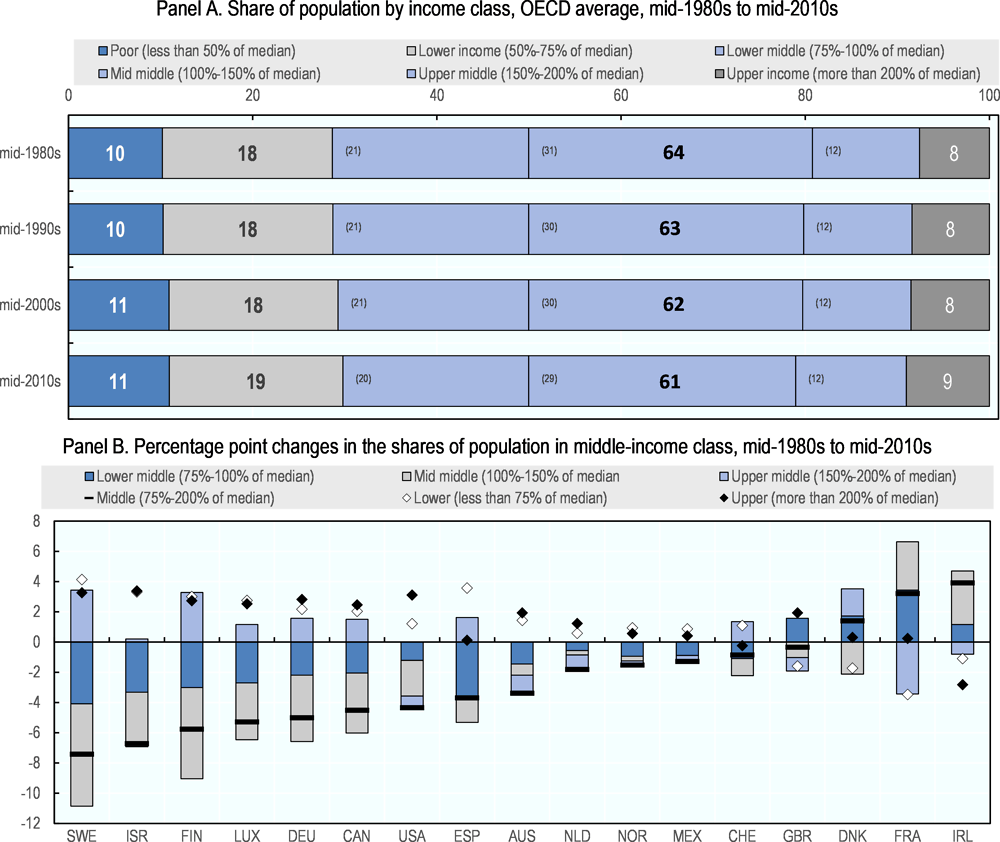
Note: “Middle income” households are defined as those with income between 75% and 200% of the national median. The OECD average comprises available data from Australia, Canada, Denmark, Finland, France, United Kingdom, Ireland, Italy, Luxembourg, Mexico, Netherlands, Norway, Spain, Sweden, and United States.
Source: OECD calculations based on data from LIS Cross-National Data Center, except EU-SILC for France (2014), Ireland (2014), Iceland (2014) and Sweden (2015).
2.2.3. Middle-income households are losing economic influence
The middle-income class exerts strong influence on the economy as it accounts for the bulk of household income. However, that majority income share has fallen fast in recent decades – considerably faster than the middle-income class’s share of the population. Indeed, between the mid-1980s and mid-2010s, its share of income declined by an average of 5 percentage points (from 69% to 64%), while it shrank as a share of population by 3 percentage points (Figure 2.5, Panel A). In all countries but Ireland, Spain and Switzerland did the middle-income group’s share of income fell more steeply than its share of the population – as it did in the United Kingdom and the United States by about 5 percentage points. Changes in middle-income shares of income and the population went in opposite directions in Denmark (income down, population up) and Switzerland (income up, population down).
The upper-income class controls a considerably larger share of income than in the past. Between the mid-1980s and mid-2010s, its share of income increased by an average of 5 percentage points from 18% to 23%, while it grew 1.5 percentage points as a share of the population (Figure 2.5, Panel B). Save in Ireland, Switzerland and France, upper-income shares of total income climbed in all countries with available data, particularly in Israel, Sweden and the United States. And, in most countries, they outstripped its expansion as a share of the population. In the United States, for example, while the upper-income class’s share of the population increased 3 percentage points from 11% to 14%, its share of all income climbed 9 percentage points – from 26% to 35%. This change in shares of income in the United States was described as a shift in the “center of gravity in the economy” (Rose, 2016[8]).

Note: “Middle income” households are defined as those with incomes of between 75% and 200% of the national median. “Upper income” households are defined as those with incomes that are above twice the national median.
The OECD average comprises available data from Australia, Canada, Denmark, Finland, France, United Kingdom, Ireland, Italy, Luxembourg, Mexico, Netherlands, Norway, Spain, Sweden, and United States.
Source: OECD calculations based on data from EU-SILC for Europe, the Survey of Labour and Income Dynamics (SLID) and Canadian Income Survey (CIS) for Canada, the CPS March Supplement for the United States and LIS Cross-National Data Center.
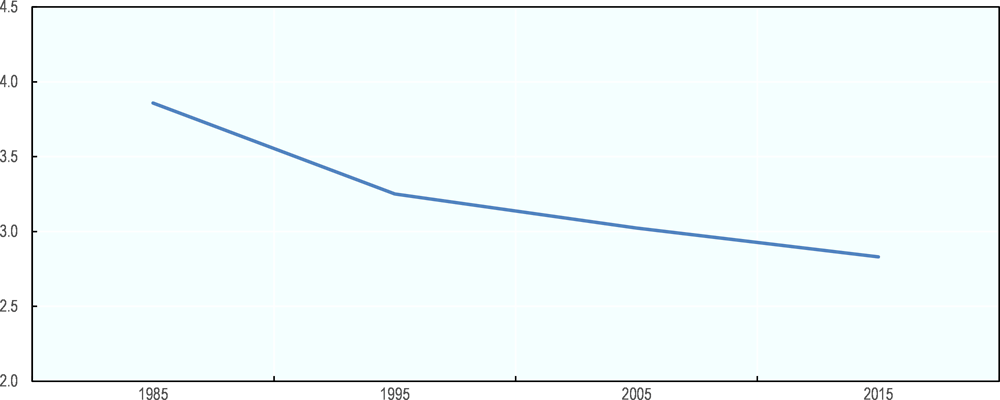
The relative economic influence of the middle-income class has declined considerably compared to that of the upper-income class. As a group, the middle-income class earned an OECD-wide average of four times more income in the mid-1980s than the upper-income class (Figure 2.6). That ratio fell sharply between mid-1980s and mid-1990s and has continued to fall, at a slower pace, since then. By the mid-2010s, middle incomes were making less than three times as much on aggregate as upper incomes.
The middle-income class’s dwindling share of income may also translate into less political influence and voter turn-out. Studies in the United States suggest that the middle class’s ability to influence public policy has diminished as policy makers become more responsive to the opinions of affluent constituents, whose preferences may differ considerably from those of the majority (Bartels, 2009[9]; Page, Bartels and Seawright, 2013[10]). Electoral surveys in European countries point not only to the fact that higher-income households participate more actively in politics, but also that they have increasingly done so in recent decades (Gallego, 2007[11]; Armingeon and Schädel, 2014[12]).
Note: “Middle income” households are defined as those with incomes between 75% and 200% of the national median. “Upper income” households are defined as those with incomes above twice the national median.
The OECD average comprises available data from Australia, Canada, Switzerland, Czech Republic, Denmark, Finland, France, Germany, United Kingdom, Hungary, Ireland, Italy, Luxembourg, Netherlands, Norway, Spain, Sweden, and United States.
Source: OECD calculations based on data from EU-SILC (Europe), SLID and CIS (Canada), CPS March Supplement (United States) and LIS Cross-National Data Center.
2.2.4. Middle incomes have been more stable than lower and upper incomes and more resilient to poverty since the crisis
During the crisis and subsequent recovery, incomes in middle-income households were less volatile than those in other income classes. Between 2007 and 2015, one-in-three middle-income individuals experienced income shocks – rises or falls of 20% or more over the previous year (Figure 2.7). In contrast, one in two individuals in lower- and upper-income households experienced such shocks. Nevertheless, income volatility among middle-income households was particularly acute in Estonia, the United Kingdom and the United States, where almost one in two were affected. Middle incomes were most stable in Denmark and Sweden, where only one in five households underwent income shocks.
Note: For the United States, data are available only for even years, i.e. 2006-2008, 2008-2010, 2010-2012 and 2012-2014.
Source: Secretariat calculations based on EU-SILC and Cross-National Equivalent File (CNEF).
Middle-income households are almost as immune as upper-income households from falling into relative poverty, i.e. below 50% of the national median. Between 2007 and 2015, the share of middle-income households that did slip into poverty from one year to the next was 2.1% on average, ranging from less than 1% in Denmark, the Netherlands and Slovenia to 4% in Australia, Greece and Latvia (Figure 2.8, Panel A). Lower middle-income households are considerably more exposed to the risk of poverty (3.5% on average) than those in the middle- and upper-middle income classes, where levels of risk are similar to those experienced by upper incomes – around 1.5%.
The risks of middle-income households falling into relative poverty from one year to the next were not affected by the economic cycle. Comparison between the Great Recession and the recovery period points to little change OECD-wide in the likelihood of middle-income households finding themselves in poverty from one year to the next (Figure 2.8, Panel B). In Estonia, Greece, Latvia and Luxembourg, the risk of middle-income households becoming poor in the next year has increased about 1 percentage point during the recovery, while has fallen almost 2 percentage points in the United Kingdom.7
Changes were more significant among lower-income households. The poverty risk rose by at least 4 points in the Estonia, Greece, Latvia, Luxembourg and Slovak Republic, while fell by 2 points or more in Australia, Austria, France, Hungary, Switzerland, Portugal, Slovenia and the United Kingdom.
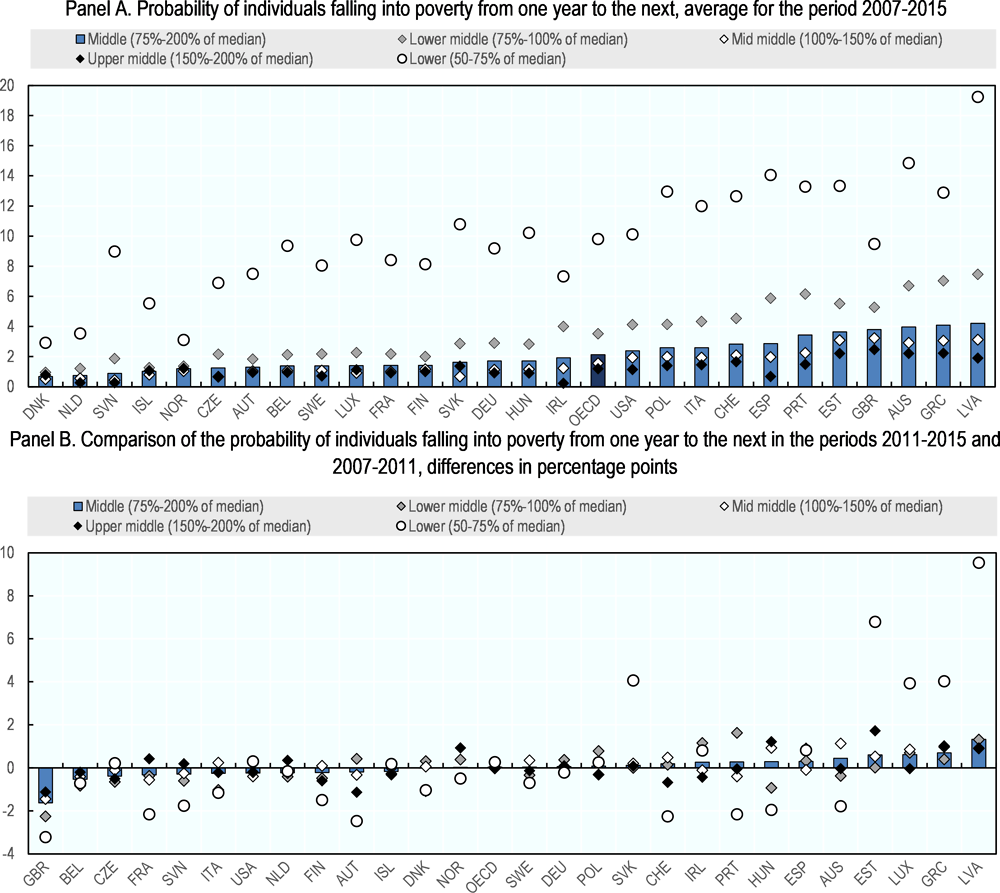
Note: Poverty defined as falling below 50% of median income.
Source: CNEF survey for Australia, Switzerland, Germany, United Kingdom and United States and EU-SILC for all other countries.
While they seldom fall into relative poverty after one year, middle-income households are still very much at risk of sliding into the low-income class over longer time spans. One-in-ten middle-income households and one in seven of the lower middle-income households slip into the low-income class (below 75% median) over a four-year period, on average between 2007 and 2015 (Figure 2.9). This risk is highest in Latvia, Estonia, the United States, Portugal, Spain and Greece where it concerned more than 20% of lower middle-income households and lowest in Germany, United Kingdom and the Netherlands (below 10%).
Recent OECD work has shown that such risk has risen in the past two decades, particularly among households which earn little more than low incomes and that lie in the bottom 40% of the income distribution. At the same time, the more affluent middle-income households now seem somewhat less prone to slide into the low-income class. These different patterns indicate a possible fracturing of the middle-income class (OECD, 2018[13]).

Note: “Middle income” defined as incomes between 75% and 200% of the national median. “Lower middle income” defined as 75% to 100% of the median. “Low income” defined as below 75% of the median.
Source: Secretariat calculations based on EU-SILC and Cross-National Equivalent File (CNEF).
2.2.5. Middle-income households are no longer what they used to be
Over the past three decades, populations have changed considerably: they have aged, fewer households have children, and more working-age people are in work. The composition of middle-income households is therefore bound to change, too. However, it may not necessarily change in line with the shifting make-up of the population. For example, although the proportion of old people has grown, it is not clear whether the middle-income class has aged at the same pace as the overall population. Hence, this section seeks to analyse how likely certain population groups are to belong to the middle-income class in comparison to overall population trends.
Evidence below shows that making it to the middle class has become easier for the older generation and more difficult for younger generations. This is because older generations are often better protected from changes in the labour market and from low-income risks than the newer generations. More secure jobs, stable careers and generous pension systems (in most cases based on define benefits) provided higher chances of being middle-income to baby boomers than to previous and subsequent generations (Figure 2.10).
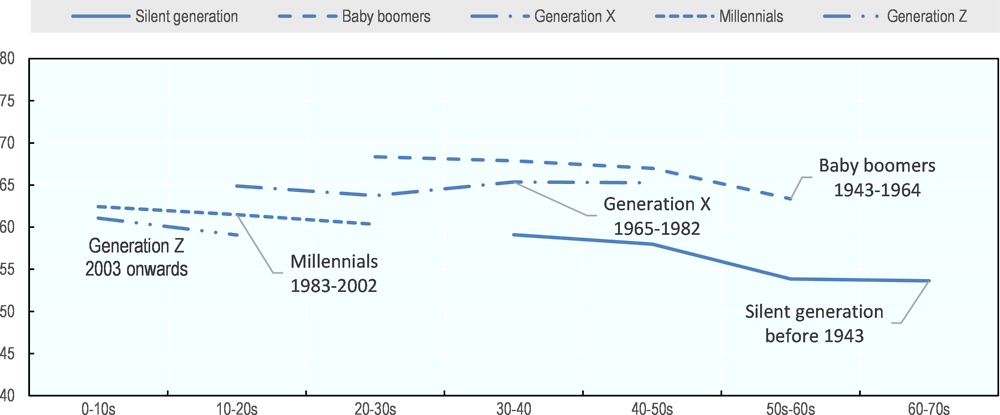
Note: Silent generation: born before 1943, Baby boomers: born 1943-64, Generation X: born 1965-82, Millennials: born 1983-2002; Generation Z: born since 2003.
The middle-income class comprises individuals in households with income between 75% and 200% of the median. OECD average based on data from OECD average comprises available data from Australia, Canada, Denmark, Finland, France, United Kingdom, Iceland, Ireland, Italy, Luxembourg, Mexico, Netherlands, Norway, Spain, Sweden, and United States.
Source: OECD calculations based on data from LIS Data Center, expect EU-SILC for France (2014), Ireland (2014), Iceland (2014) and Sweden (2015).
2.2.6. Income classes converge across age groups
The middle-income class is ageing faster than the overall population, as the chances of belonging to it converge in all age groups. Between the mid-1980s and mid-2010s, the population has aged as the proportion of over-64s increased from 12% to 16%, while the under-30s fell from 44% to 38% (Figure 2.11, numbers in brackets). At the same time, the chance of being in the middle-income converged across age groups, as it increased for the elderly and decreased for younger age groups.
In the mid-1980s, generally speaking, those most likely to join the middle-income class were prime-age adults– between 30 and 64 years old – and those least likely were the elderly, children and young adults. While still broadly valid, in recent decades considerable changes in the likelihood of being middle income took place in all age groups leading to a convergence in the distribution of income classes across age groups (Figure 2.11).
Starting from a relatively disadvantaged position, the proportion of the elderly achieving middle-income status rose considerably. In the mid-1980s, almost half were lower income. By the mid-2010s that share had fallen to almost one-third. At the same time, the likelihood of their being middle income rose by up to 12 percentage points to 58%. Despite such remarkable improvements, however, they still stood a greater chance of being lower income than other age groups. The greatest rises in the chances of elderly people being in the middle class came about in Denmark, France, the Netherlands, Norway and the United Kingdom (Table 2.2).
By the mid-2010s, the elderly were more likely not only to be middle-income, but upper-income, too, in all countries save Mexico. The improvement in their income standing reflect new retirees’ better pension provisions and a growing number of people working past retirement age.
Fewer working-age adults and children are middle-income than three decades ago. The fall was sharpest among young people (18-to-29-year-olds) and children (the under-18s). It was also steep among young working-age adults, aged 30 to 44. It was, however, less marked among older working-age adults (the 45-64-year-olds), the only age group under 65 whose chances of climbing into the upper-income class has increased more than of dropping into the lower-income class.
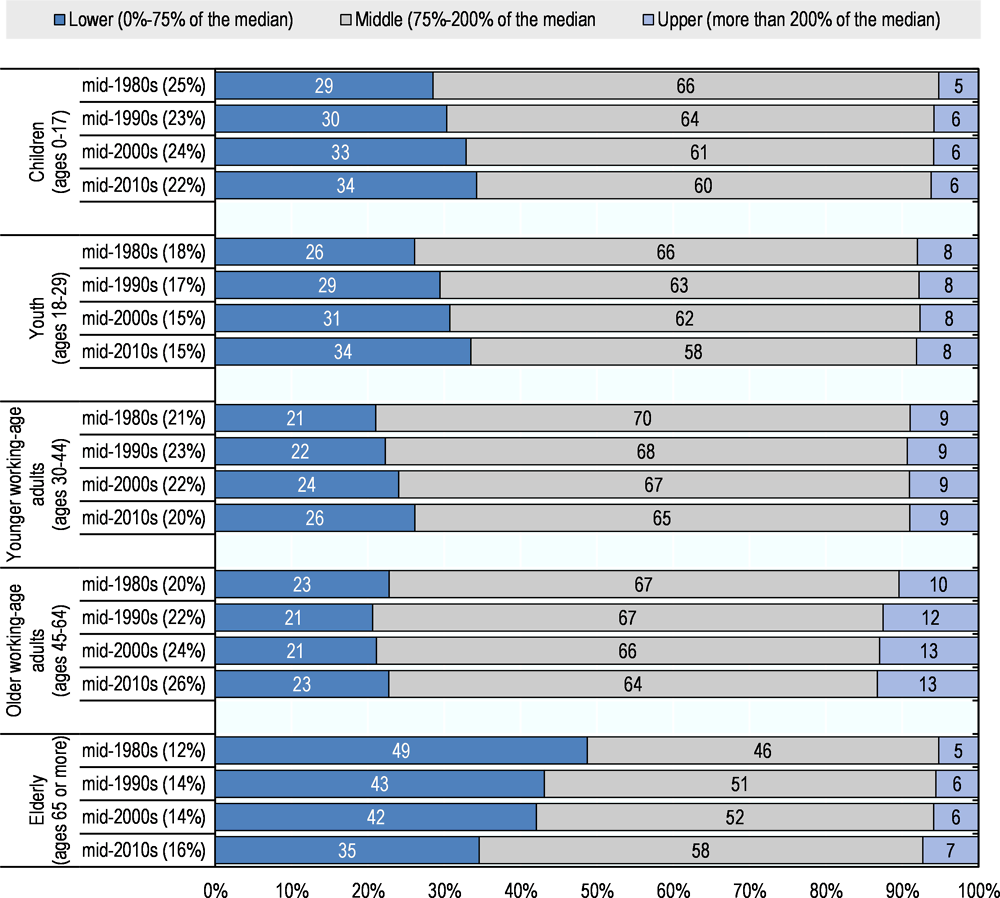
Note: “Middle income” households are defined as those with income between 75% and 200% of the national median. “Upper income” households are defined as those with income over twice the national median. Number in brackets refer to the shares of the specific group in total population. The OECD average comprises available data from Canada, Denmark, Finland, France, Germany, Israel, Luxembourg, Mexico, the Netherlands, Norway, Spain, Sweden, the United Kingdom and the United States.
Source: OECD calculations based on data from the LIS Cross-National Data Center and EU-SILC.
Among children, the largest decline in those in the middle-income group took place in the Netherlands and Sweden, where levels in the mid-1980s were very high and remain higher than the OECD average. Falls were also considerable in Austria, Canada, Finland, Israel, Luxembourg and Spain. With the exceptions of Canada, Finland, Israel, the United Kingdom and the United States, children became increasingly likely to be lower than higher income during the period under study.
2.2.7. Fewer families with children are middle income
The vast majority of households with children are middle income, although their share has fallen in recent decades. Like working-age adults and children, the share of households with children in the middle-income class has also fallen – from 72% to 68% for couples with children, and from 55% to 44% among single parents (Figure 2.12).
When it comes to couples with children, the largest drops were in Canada, Luxembourg and Sweden (Table 2.3). Only in France have their chances of being middle income increased. The fall translates into similar expansions of the lower- and upper-income classes – though chiefly the latter in a few countries, particularly Canada and the United States and, to some extent, Finland, Germany and the United Kingdom.
Between the mid-1980s and mid-2010s, single-parent households increasingly dropped out of the middle-income group and, by the end of the period, a majority were on lower incomes (Figure 2.12). Their income status worsened in all countries, as the share of those in the lower-income class rose from 40% to 53%. In some countries, the trend also translated into considerable falls in the single-parent household likely to be upper income. Falls were particularly stark in France, Luxembourg and Sweden and, to a lesser extent, Finland and Norway.
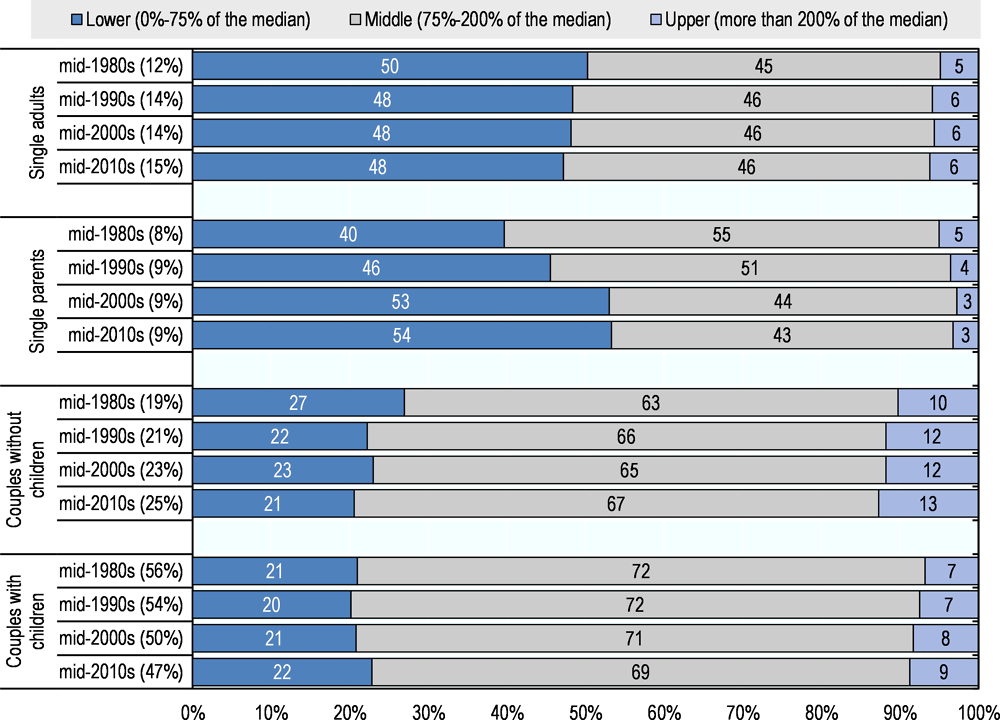
Note: “Middle income” households are defined as those with income between 75% and 200% of the national median. “Upper income” households are defined as those with income over twice the national median. Number in brackets refer to the shares of the specific group in total population. The OECD average comprises available data from Canada, Denmark, Finland, France, Germany, Luxembourg, Mexico, Norway, Sweden, the United Kingdom and the United States.
Source: OECD calculations based on LIS and EU-SILC.
2.2.8. Fewer working-age households are middle income, whether in work or not
Working households are less likely to be on middle incomes than three decades ago. On average across OECD countries, two-thirds of working households were middle income in the mid-2010s – 3 percentage points less than in the mid-1980s (Figure 2.13). The decline was observed in 16 of the 19 countries for which long-term data are available (Table 2.4). Only in Chile, Italy and Mexico was there an increase, but in Chile alone was it sizeable. Everywhere else there was a significant fall in the share of working households in the middle, with particularly steep declines – of 7 to 8 percentage points – in Canada, Israel and the United Kingdom.
In most countries, the trend was accompanied by a rise in the share of in-work households in both the lower- and upper-income classes. Exceptions were Hungary, Switzerland and the United Kingdom – where working-age households chiefly swelled the ranks of the lower-income class – and the Czech Republic, Denmark, Israel and the United States, where they mostly entered the upper-income class.
Fewer non-working households are on middle incomes and more on lower incomes. Twenty years ago, half of the households headed by out-of-work working-age people (“non-working households”) enjoyed middle-income status. Today, most are on lower incomes (Figure 2.13). The fall has been particularly steep (more than 15 percentage points) in Finland, Israel, Italy, Luxembourg, the Netherlands, Norway and Spain (Table 2.4). Only in France, Switzerland and the United States have the shares of non-working households in the middle-income class increased.

Note: The employment status of the head of household is based on the current labour force status of the person responsible for the household, according to ILO definitions. Number in brackets refer to the shares of the specific group in total population.
Source: OECD calculations based on LIS and EU-SILC.
2.3. Taxes, benefits and middle incomes
Taxes and benefits play an important role in redistributing income and reducing inequality in OECD countries (OECD, 2011[14]; Causa and Hermansen, 2017[15]). While the tax and benefit debate sometimes focuses on the rich when it addresses taxes and on the poor when it considers benefits, the middle class is in fact the main stakeholder of both. This section analyses the contribution of middle incomes to tax revenues and their receipt of social spending, the net outcome of taxes paid and benefits received, and how these have changed in the last decade in OECD countries and selected emerging economies.
Analysis focuses exclusively on personal direct taxes8 and cash social benefits9. Due the unavailability of data, it does not consider other sources of public revenue and spending (e.g. indirect taxes and such public services as health and education). This lack of data limits the scope of analysis and may distort it if total amounts of taxes and benefits are considerably different. On average across OECD countries, taxes received and benefits paid-out are similar, respectively accounting for 29% and 27% of disposable household income.10 In some countries, however, amounts of public expenditure and revenues not accounted for do differ substantially. In such cases, comparability is hindered, particularly when it comes to assessing whether middle incomes are net payers or net beneficiaries of the tax-benefit system.
2.3.1. Middle incomes pay most taxes, but at times less than their income share
Middle-income households contribute the bulk of income tax revenues – an average of almost two-thirds of revenues from personal direct taxes, a proportion similar to their share of income (Figure 2.14). In all OECD countries with data available, middle incomes contribute at least half of tax revenue and at least three-quarters in Belgium, Iceland, Norway and the Slovak Republic. Only in Israel and the United States do they contribute less than half, with the United States also being the sole OECD country where middle incomes contribute less than upper incomes.11.
In some countries, middle incomes’ share of taxes paid is lower than their share of income earned. Australia, Israel, Portugal, Spain, the United Kingdom and the United States are all cases in point. In the United States, for example, middle incomes earn 50% of the country’s income, but contribute only 43% of its tax revenue. Part of the reason is the highly progressive nature of income tax systems in those countries, whereby upper incomes account for high shares of taxes (Figure 2.14).12
Upper incomes pay disproportionally more than their income share – on average, 29% of personal direct tax revenue for a 22% share of income. The United States is the only country where upper incomes pay more than half of tax revenue. In Israel, the upper-income class pays 47% of all taxes while accounting for 31% of income.
As for lower-income households, they pay a small share of taxes. On average, that share is 7% of personal direct taxes, ranging from 2% in Ireland and the United Kingdom to 14% in Greece and Switzerland.
Note: Mid-2010 refers to 2012 for Korea and South Africa; to 2013 for Brazil, Canada and Switzerland; to 2014 for Australia, Iceland, Ireland, Italy, Luxembourg, Norway, Poland and Slovenia; to 2009 for Japan; to 2016 for Israel and the United States; to 2015 for the remaining countries.
Source: OECD Secretariat calculations based on LIS and EU-SILC except for Japan (Tanaka and Shikata, 2019[7]) – based on National Survey of Family Income and Expenditure (NSFIE).
In Brazil and South Africa, the two emerging economies with tax data available, the contribution of middle incomes to tax revenue is limited and well below their share of income. Out of all personal direct taxes collected in the country, upper incomes account for more than 75% in Brazil and over 80% in South Africa.
2.3.2. The middle-income class receives more benefits than the other income classes, though not proportionately to its share of the population
As with taxes, the middle-income class receives the bulk of social benefits because of its sheer size – 60% on average across OECD countries13 (Figure 2.15, Panel A), which is equivalent to 7.2% of GDP.14 Pensions (old age and invalidity) make up two-thirds of cash benefits (OECD, 2019[16]). Accordingly, most benefits paid out to the middle-class target the elderly. People aged 65 or over receive more than half of social security cash benefits paid to the middle-income class, despite making up less than one-fifth of the middle-income population. Across OECD countries, the share of cash benefits received by the middle-income group ranges from less than one-third in Mexico, to slightly less than half in Australia, Chile, Estonia, Latvia and the United States, and around three-quarters in Luxembourg, Norway and the Slovak Republic.
The average share of cash benefits that the middle-income class receives is slightly less than its share of the population, though there is considerable variation from country to country. OECD-wide, the middle-income class accounts for 61% of the population and 60% of benefits. The gap is much wider, however, in Australia, Denmark, Korea, Mexico and Portugal, where middle-income households receive a small share of benefits in comparison to their share of the population. In Mexico, for example, they comprise 45% of population and 29% of benefits. Their relatively low share of benefits in some of the countries, such as Australia and Denmark, is attributable to the fact their benefit systems chiefly target people on lower incomes.
In other countries, by contrast, like Mexico and Portugal, upper incomes are the disproportionate recipients. And, in a handful of countries – particularly Greece, Luxembourg and Poland – whose social security systems do not seek to assist lower-income households, the middle-income class receives a share of benefits that is proportionately much larger than its share of the population. In Greece, for example, middle-income households account for 59% of the population and 70% of benefits, while those on lower incomes account for 32% of the population and 15% of benefits.
Upper-income households receive, proportionally, more cash benefits than any other income class. In contrast to lower and middle incomes, the share of benefits enjoyed by the upper-income class is greater than its share of the population – 1.5 times greater on average, with 9% of the population receiving 13% of benefits. The chief driver is the uneven distribution of pensions in some countries. In Mexico and Portugal and, to a lesser extent, Chile, Israel and the United States, elderly upper-income households get a share of benefits that far outstrips their share of the population. In Mexico, for example, they account for 18% of the old-age population and 54% of old-age benefits. Significantly, benefits to lower-income households are disproportionately low in those countries, as in Greece, Italy, Luxembourg and Spain.
When it comes to the Emerging economies, the share of benefits received by middle-income households in Brazil and South Africa is much lower than the OECD average – partly because their middle-income classes account for smaller shares of their populations. Moreover, in the case of Brazil, benefits received by low- and middle-income households are disproportionately low. It is the other way round for upper-income households, who account for 19% of the population and 43% of social benefits. As for Russia, middle-income households receive proportionally more benefits than their share of the population.
Note: Mid-2010 refers to 2012 for Korea and South Africa; to 2013 for Brazil, Canada and Switzerland; to 2014 for Australia, Iceland, Ireland, Italy, Luxembourg, Norway, Poland and Slovenia; to 2009 for Japan; to 2016 for Israel and the United States; to 2015 for the remaining countries.
Source: OECD Secretariat calculations based on LIS and EU-SILC except for Japan (Tanaka and Shikata, 2019[7]) – based on National Survey of Family Income and Expenditure (NSFIE).
2.3.3. Are middle incomes net contributors or net beneficiaries of tax-benefit systems?
How the tax-benefit system affects the middle-income class depends on age.15 The net effect of taxes and benefits on the population as a whole is broadly neutral. Their effect on the middle-income class, however, differs greatly between households headed by people of working age and those headed by the elderly. OECD-wide, the former pay 17% more in taxes than they receive in benefits, while the latter receive a substantial 60% more in benefits than they pay in taxes – an indication of the importance of social security transfers (particularly pensions) in redistributing income across generations. Elderly households are also net recipients in both the lower and upper-income classes. Working-age households are net payers in both middle and upper-income classes, only those in the lower-income class are net recipients (Figure 2.16).

Source: OECD Secretariat calculations based on data from LIS and EU-SILC.
Middle-income households generally pay less tax but receive less in benefits than OECD population averages. They pay the equivalent of 28% of their disposable income in personal direct taxes, while receiving 25% in social security cash benefits (Figure 2.17, Panel A). Indeed, in most countries they seem to be net contributors, paying more in income tax than they receive in cash benefits. However, that perception may be biased by incomplete tax and benefit data (as stated at the beginning of Section 2.3).
A more accurate measure is yielded by considering the amount of taxes and benefits of the middle-income class in comparison to the overall population average (Figure 2.17, Panel B). In most countries, middle-income households generally contribute slightly more than the overall population, as they pay less tax but also receive less in benefits. In Portugal, for example, they pay 4 percentage points less in tax but receive 5 points less in benefits. In comparison to the nationwide average, the contribution of middle-income households is particular high in Belgium, Denmark, Estonia and Ireland, where benefits target low-income households. Middle-income households gain considerably more than the average from the system in Greece, where lower-income households pay a high share of taxes (Figure 2.14) and many insurance benefits are not targeted (Figure 2.15).
In the emerging economies of Brazil and South Africa, middle incomes receive more in benefits than they pay in taxes. In Brazil, even upper incomes are net recipients of the tax-benefit system, as personal direct taxes account for a small share of tax revenue (OECD et al., 2018[17]) and most social benefit spending is aimed at insurance pensions with limited redistributive effect (OECD, 2015[18]).

Note: The OECD average comprises available data from Austria, Belgium, Canada, Czech Republic, Denmark, Finland, Germany, Iceland, Ireland, Israel, Italy, Korea, Japan, Luxembourg, Netherlands, Norway, Portugal, Slovak Republic, Sweden, and United States.
Source: OECD Secretariat calculations based on LIS and EU-SILC except for Japan (Tanaka and Shikata, 2019[7]) – based on National Survey of Family Income and Expenditure (NSFIE).
2.3.4. More taxes and more benefits for middle incomes since the crisis
Middle-income households have paid more income taxes and received more social security cash benefits since the global financial crisis, but levels and effects differ across age groups. Between 2007 and 2015, both taxes and benefits increased in real terms and contributed to the rise of disposable household income as benefits grew faster than taxes. Both grew faster among households headed by the elderly rather than by working-age people, enjoying particularly large increases in benefits – an average of 1.3% per year.
Over the last decade, benefits contributed as much as earnings to lifting the incomes of middle-income households. Between 2007 and 2015, their mean disposable incomes grew by an annual average of 0.9% (Figure 2.18, Panel A). Market incomes (mainly from earnings and capital) and benefits contributed 0.6 percentage points each, while higher taxes reduced disposable income by 0.3 points. Old-age pensions – rather than benefits intended to alleviate the impact of recession, like social assistance payments and unemployment allowance – seem to have driven the rise in benefits of which old-age households were the chief recipients (Figure 2.18, Panel C). Even in countries where market incomes were still below pre-crisis levels (e.g. Ireland, Portugal and Spain), the impact of rising benefits on disposable income was greater among the elderly middle-income population than their working-age peers (Figure 2.18, Panel B). Benefits also increased in countries that experienced considerable growth in market incomes, such as Chile, Estonia, Korea, Norway and Poland.
Although income taxes paid by middle-income households increased in most OECD countries between 2007 and 2015, their impact on disposable income has been limited. They noticeably reduced it in some countries that enjoyed considerable economic growth, such as Norway, Poland and Slovak Republic, as well as in France, where growth was slower. In some countries, taxes increased despite lower market income, due either to significant rises in benefits (e.g. Luxembourg) or to tax reforms implemented as part of fiscal consolidation programmes (e.g. Ireland and Portugal). In Greece, Iceland, the Netherlands and the United Kingdom, lower taxes cushioned much of the fall in market incomes. The fall in taxes was considerable in Greece, where market incomes collapsed, and in the United Kingdom, where a series of reforms raised the tax-free personal allowance.16
After economic growth started to recover, around 2011, disposable income climbed at a faster rate, driven mainly by market income growth and, to some extent, by social benefits. Overall, the tax-benefit system has had a negative impact on disposable income since the recovery, as income taxes have increased faster than benefits (data not shown).
Note: 2007 refers to 2005 for Israel; to 2006 for Brazil, Germany and Korea, to 2008 for Australia, Estonia and Italy 2015 refers to 2012 for Korea and South Africa; to 2013 for Brazil, Canada and Switzerland; to 2014 for Australia, Iceland, Ireland, Italy, Luxembourg, Norway, Poland and Slovenia; to 2016 for Israel and the United States.
Source: OECD calculations based on data from LIS and EU-SILC.
2.4. Conclusion
This chapter has sought to analyse the changing trends that affect the middle-income class in OECD countries and selected emerging economies. To that end, it has used a definition of middle incomes that is consistently applicable to all countries – namely, 75% to 200% of the median household disposable income. Thus defined, middle-income households make up the majority of the population in OECD countries: 61% on average, and 70% or more in Norway, the Czech Republic and Iceland. Only in Chile and Mexico are less than half the population on middle incomes.
Countries that are richer in terms of absolute household income tend to have larger middle classes. However, there are exceptions. In the United States, the middle-income group is small given the fourth-highest absolute median income level across countries, while in most Central European countries it is larger than income levels would suggest.
Middle incomes have barely grown in real terms over the last 10 years and, importantly, have grown more slowly than upper and top incomes for three decades. On average across OECD countries, real median incomes have risen by one-third less than those in the top 10%. As a result, the middle class’s share of income has shrunk in comparison to the upper class: while aggregate middle income was four times greater than that of the upper-income group in the 1980s, they were less than three times the size by the mid-2010s. The middle-income group’s dwindling share of income may also result in weaker economic and political influence.
The middle-income class is smaller than three decades ago. Every 10 years an average of 1% of the population ceases to be middle income. One-third of the households that moved out of the middle-income class moved into the upper-income class. However, the remaining two-thirds became lower income. Those chiefly affected were households in the mid- and low-lying echelons of the middle-income group. Indeed, the upper-middle-income class even grew in most of the countries where the middle-income class as a whole declined. The inference is of an increasing divide within the middle class.
The make-up of the middle-income class has undergone profound change. It has, in particular, aged faster than the population as a whole over the past three decades. Thus, while the share of elderly people in the middle-income class rose, shares of those from all other age groups fell, especially among young people and families with children. As a consequence, chances to make it to middle incomes fell for each subsequent generation since the baby boom generation. The fall of middle-income shares among working-age households affected those headed by people both in and out of work, although it was more pronounced among the jobless.
Middle-income households are neither net contributors of personal direct taxes nor net recipients of cash benefits. They tend to receive almost as much in social benefits as they pay in taxes. That said, people on lower-middle incomes tend to be net beneficiaries and those on higher-middle incomes net payers. After 2007, growth in the incomes of the middle-income class was attributable primarily to benefits– focused chiefly on elderly households – rather than to labour and capital incomes.
References
[12] Armingeon, K. and L. Schädel (2014), “Social Inequality in Political Participation: The Dark Sides of Individualisation”, West European Politics, Vol. 38/1, pp. 1-27, https://doi.org/10.1080/01402382.2014.929341.
[1] Atkinson, A. and A. Brandolini (2013), “On the Identification of the Middle Class”, in Income Inequality, Stanford University Press, https://doi.org/10.11126/stanford/9780804778244.003.0003.
[9] Bartels, L. (2009), “Economic Inequality and Political Representation”, in The Unsustainable American State, Oxford University Press, https://doi.org/10.1093/acprof:oso/9780195392135.003.0007.
[31] Bussolo, M. et al. (2018), Toward a New Social Contract: Taking on Distributional Tensions in Europe and Central Asia, The World Bank, https://doi.org/10.1596/978-1-4648-1353-5.
[25] Callan, T. et al. (2011), “The distributional effects of austerity measures: a comparison of six EU countries”, EUROMOD Working Papers, https://ideas.repec.org/p/ese/emodwp/em6-11.html (accessed on 26 November 2018).
[15] Causa, O. and M. Hermansen (2017), “Income redistribution through taxes and transfers across OECD countries”, OECD Economics Department Working Papers, No. No. 1453, OECD Publishing, Paris, https://doi.org/10.1787/bc7569c6-en.
[24] De Agostini, P., J. Hills and H. Sutherland (2018), “Were We Really All in it Together? The Distributional Effects of the 2010-15 UK Coalition Government’s Tax-benefit Policy Changes”, Social Policy & Administration, Vol. 52/5, pp. 929-949, https://doi.org/10.1111/spol.12344.
[2] Ferreira, F. et al. (2012), Economic Mobility and the Rise of the Latin American Middle Class, The World Bank, https://doi.org/10.1596/978-0-8213-9634-6.
[22] Förster, M. (1994), “Measurement of low incomes and poverty in a perspective of international comparisons”, Labour Market and Social Policy Occasional Papers, No. 14., OECD Publishing, Paris,, http://www.oecd.org/els/soc/34805910.pdf (accessed on 26 November 2018).
[19] Förster, M. and I. Tóth (2001), “Child poverty and family transfers in the Czech Republic, Hungary and Poland”, Journal of European Social Policy, Vol. 11/4, p. 19632, http://journals.sagepub.com/doi/pdf/10.1177/095892870101100403 (accessed on 26 October 2018).
[11] Gallego, A. (2007), “Unequal Political Participation in Europe”, International Journal of Sociology, Vol. 37/4, pp. 10-25, https://doi.org/10.2753/ijs0020-7659370401.
[29] Jenkins, S. et al. (eds.) (2012), The Great Recession and the Distribution of Household Income, Oxford University Press, https://doi.org/10.1093/acprof:oso/9780199671021.001.0001.
[26] Matsaganis, M. and C. Leventi (2014), “Distributive Effects of the Crisis and Austerity in Seven EU Countries”, ImPRovE Working Papers, https://ideas.repec.org/p/hdl/improv/1404.html (accessed on 26 November 2018).
[16] OECD (2019), Social Expenditure Update 2019, Public social spending is high in many OECD countries, OECD Publishing, Paris, http://www.oecd.org/social/expenditure.htm0 (accessed on 24 January 2019).
[13] OECD (2018), A Broken Social Elevator? How to Promote Social Mobility, OECD Publishing, Paris, https://dx.doi.org/10.1787/9789264301085-en.
[20] OECD (2018), OECD Income Distribution Database (IDD): Key Indicators, http://www.oecd.org/social/income-distribution-database.htm (accessed on 19 November 2018).
[21] OECD (2018), What are equivalence scales, http://www.oecd.org/els/soc/OECD-Note-EquivalenceScales.pdf (accessed on 19 November 2018).
[23] OECD (2017), Income Distribution Database: Terms of reference, OECD Publishing, Paris,, http://oe.cd/idd (accessed on 26 November 2018).
[18] OECD (2015), “Inequality and fiscal redistribution in emerging economies”, in In It Together: Why Less Inequality Benefits All, OECD Publishing, Paris, https://dx.doi.org/10.1787/9789264235120-10-en.
[14] OECD (2011), Divided We Stand: Why Inequality Keeps Rising, OECD Publishing, Paris, https://dx.doi.org/10.1787/9789264119536-en.
[30] OECD (2011), Divided We Stand: Why Inequality Keeps Rising, OECD Publishing, Paris, https://dx.doi.org/10.1787/9789264119536-en.
[28] OECD (2008), Growing Unequal?: Income Distribution and Poverty in OECD Countries, OECD Publishing, Paris, https://dx.doi.org/10.1787/9789264044197-en.
[17] OECD et al. (2018), Revenue Statistics in Latin America and the Caribbean 2018, OECD Publishing, Paris, https://dx.doi.org/10.1787/rev_lat_car-2018-en-fr.
[10] Page, B., L. Bartels and J. Seawright (2013), “Democracy and the Policy Preferences of Wealthy Americans”, Perspectives on Politics, Vol. 11/01, pp. 51-73, https://doi.org/10.1017/S153759271200360X.
[27] Paulus, A., F. Figari and H. Sutherland (2017), “The design of fiscal consolidation measures in the European Union: distributional effects and implications for macro-economic recovery”, Oxford Economic Papers, p. gpw054, https://doi.org/10.1093/oep/gpw054.
[6] Pew Research Center (2017), “Middle Class Fortunes in Western Europe”, Global Attitudes & Trends, http://www.pewglobal.org/2017/04/24/middle-class-fortunes-in-western-europe/.
[5] Pew Research Center (2015), “The American Middle Class Is Losing Ground”, Social & Demografic Trends, http://www.pewsocialtrends.org/2015/12/09/the-american-middle-class-is-losing-ground/.
[3] Reeves, R. and K. Guyot (2018), “There are many definitions of middle class—here’s ours”, Middle Class Memos, Brookings, https://www.brookings.edu/blog/up-front/2018/09/04/there-are-many-definitions-of-middle-class-heres-ours/ (accessed on 24 October 2018).
[8] Rose, S. (2016), “The Growing Size and Incomes of the Middle Class”, Urban Institute, Income and Benefits Policy Center, https://www.urban.org/sites/default/files/publication/81581/2000819-The-Growing-Size-and-Incomes-of-the-Upper-Middle-Class.pdf.
[7] Tanaka, S. and M. Shikata (2019), “The middle class in Japan, 1994–2009: Trends and characteristics”, Keio-IES Discussion Paper Series, No. DP2019-001, Keio University, Tokyo, https://ies.keio.ac.jp/en/publications/10666/ (accessed on 25 March 2019).
[4] Thurow, L. (1984), “The Disappearence Of The Middle Class”, New York Times, Business Forum, https://www.nytimes.com/1984/02/05/business/business-forum-the-disappearance-of-the-middle-class.html.
Notes
← 1. This poverty definition is the same as that used by the OECD to measure relative poverty in the Income Distribution Database (Förster, 1994[22]; OECD, 2017[23]).
← 2. The OECD’s headline poverty indicator defines as “poor” people in households whose income is below 50% of median income. The European Commission considers that people are at risk of poverty if their household income is below 60% of the median income.
← 3. The Czech Republic and Slovak Republic are at the bottom of the OECD income inequality league (OECD, 2018[20]). Inequality in Hungary and Poland is higher and variable, and increased particularly steeply in the wake of the economic transition (Förster and Tóth, 2001[19]). More recently it has eased.
← 4. Disposable incomes are adjusted for household size and economies of scale by dividing overall household disposable income by the square root of household size (OECD, 2018[21]). National incomes have been adjusted for cross-country differences in the prices of goods and services using prices and purchasing power parities for 2010, expressed in USD.
← 5. Similarly, trends in the upper-income class can be approximated with the top 10%.
← 6. This refers to the average for 19 OECD countries for which long-term data series are available. The average annual growth rate of all 36 OECD countries during the latest period since 2007 was somewhat higher, at 0.6%.
← 7. The rise of the poverty risk during the economic recovery could be partly driven by a statistical artifice of relative poverty measures, but evidence based on absolute poverty measures corroborate this result. During recoveries, median incomes increase and, thus, push the poverty line up hence increasing the poverty risk of households whose incomes increased at a lower rate than the median. Similarly, the same artifice may reduce the poverty risk of households during recessions (Jenkins et al., 2012[29]). Recent evidence for the European Union using an absolute poverty measure points out to a rise of the poverty risk for middle class in the 2011--14 period (Bussolo et al., 2018[31])
← 8. Personal direct taxes refer to personal income tax, social insurance contributions paid by workers and property tax. Other taxes (e.g. corporate income tax, employer social insurance contributions and consumption taxes) are not included.
← 9. Cash social benefits include social security benefits from social insurance, social assistance payments and income support.
← 10. In Iceland, Denmark, the Netherlands, Switzerland and the United States the total amount of taxes exceeds the total amount of benefits by at least 10% of disposable household income. In Spain, benefits exceed taxes by 10% of disposable household income and in Brazil by 14%.
← 11. While tax data are not available, it is possible that the middle-income classes in Chile and Mexico also contribute less than upper incomes, as evidence shows that they do in the United States and Brazil (Figure 2.14).
← 12. A recent OECD study found that the personal income taxes and social security contributions in those countries – particularly Ireland, Israel and Spain – are among the most progressive in the OECD (Causa and Hermansen, 2017[15]).
← 13. Monetary social benefits refer to social transfers paid in cash such as pensions, unemployment benefits, family benefits, tax credits and assistance benefits. Quasi-cash transfers such as the US Supplemental Nutrition Assistance Program (SNAP), also known as “food stamps” are also included. Public services and in-kind benefits such as publicly provided health care and education are not included. Previous OECD work has assessed the incidence and distributive effect of in-kind benefits (OECD, 2011[30]; OECD, 2008[28]).
← 14. According to the OECD’s Social Expenditure Database (SOCX), public spending on cash social benefits amount to an OECD average of 12% of GDP (OECD, 2019[16])
← 15. In order to control for the important role of taxes and benefits in redistributing income across the life cycle, this section assess their net effect at the overall population level and across age groups. When interpreting the results, it should be kept in mind that analysis does not cover social transfers in kind. In general, countries spend as much on these in-kind transfers as on cash benefits and the former tend to be proportionally distributed, hence to the advantage of middle-income households (OECD, 2011[14]).
← 16. Several studies have analysed the effect on disposable household income of tax-benefit reforms as part of fiscal consolidation programmes, (De Agostini, Hills and Sutherland, 2018[24]; Callan et al., 2011[25]; Matsaganis and Leventi, 2014[26]; Paulus, Figari and Sutherland, 2017[27]).