copy the linklink copied!1. Key policy insights
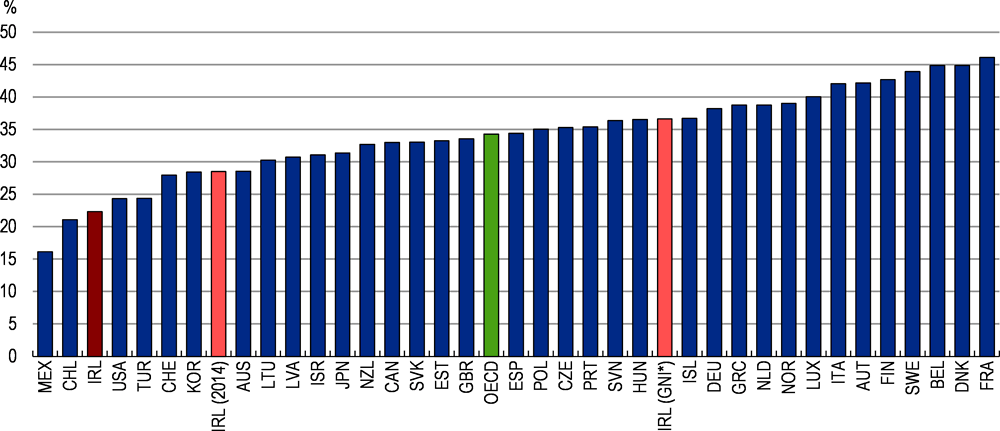
Ireland’s living standards remain high (Figure 1.1, Panel A). Growth has been strong, despite bouts of volatility. The average real wage was on par with the OECD average in the mid-1990s, but now stands more than 15% above. Furthermore, a highly redistributive tax and transfer system has contained income inequality in disposable incomes (Figure 1.1, Panel B).
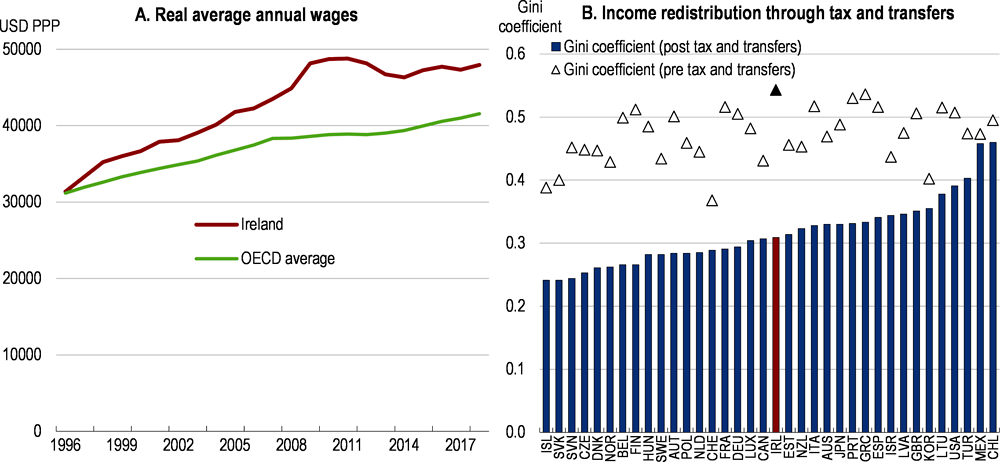
Note: In Panel B, data are for 2017 or the most recently available year.
Source: OECD Economic Outlook database; OECD Income Distribution database.
The population also benefits from a high level of wellbeing across other dimensions (Figure 1.2). Life satisfaction is high, according with the strong economy as well as other features such as low levels of pollution, strong community engagement and high perceived personal security. Performance in education depends less on socio-economic status than in most other OECD countries. The gender wage gap is also one of the lowest in the OECD, having declined markedly over recent decades. Ireland continues to be an attractive destination for foreign direct investment, with a stable political system, a relatively-young English-speaking population and a supportive regulatory and tax regime. Looking forward, the country is well positioned to take advantage of the opportunities presented by technological change, though there are various challenges that need to be carefully navigated.
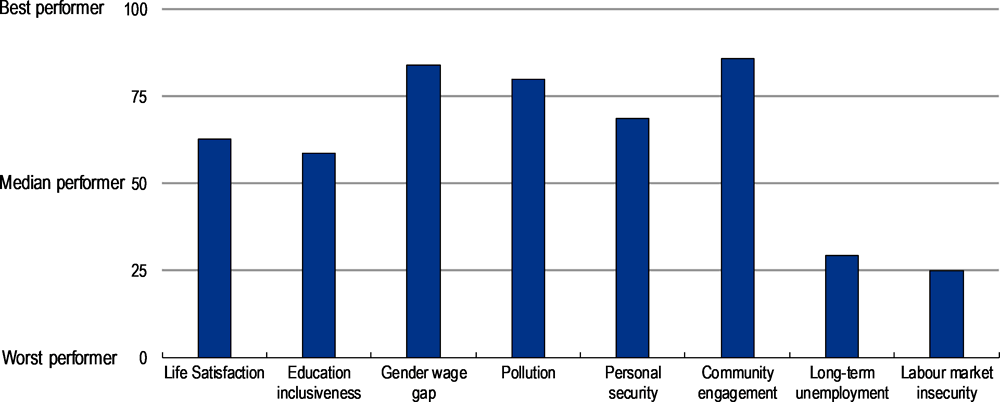
Note: Education inclusiveness is based on the measure of variation in reading performance explained by a student’s PISA index of economic, social and cultural status. Data for the gender wage gap are for 2017 or the latest available year for each country used.
Source: OECD Better Life Index database; OECD Gender Data Portal; OECD PISA 2018 database.
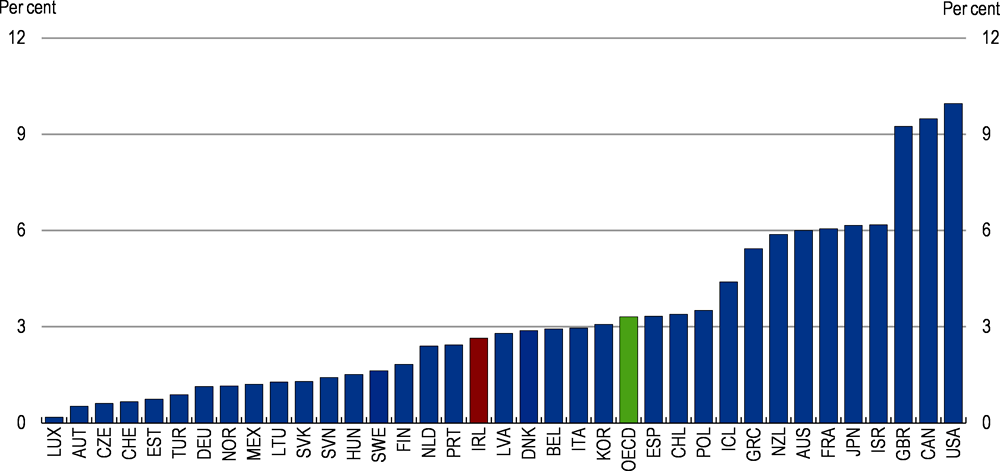
The impressive economic growth of recent years has contributed to the economy beginning to run up against capacity constraints, with some skill shortages and strains on key infrastructure. The population is ageing, with the number of people aged over 65 outpacing that of the prime working age cohort since 2008. The structure of the economy is also undergoing sizeable change. Businesses located in Ireland have been keener to embrace new technologies than their counterparts in most other OECD countries, but the impact on productivity growth in most firms has been modest so far. These trends unfold against a backdrop of heightened global uncertainty and with scars of the financial crisis, notably high general government debt, fragilities in the banking sector and high long-term unemployment (Figure 1.2), still apparent.
The authorities have compiled a reform programme in response to these various challenges. Public investment decisions are to be aligned with a country-wide planning framework, Ireland 2040. In addition, Future Jobs Ireland set out a strategy to support businesses in embracing productivity-enhancing technological change and transitioning to a low-carbon economy, while promoting greater labour force participation and skill accumulation. With the United Kingdom’s departure from the European Union in prospect, the authorities have also been putting in place a variety of supports for those Irish firms likely to be most affected.
In this context, the main messages of this Economic Survey are:
-
Government finances have improved markedly, but ongoing fiscal prudence is needed given ageing-related fiscal costs will substantially rise and high uncertainty in the global outlook.
-
Emerging capacity constraints can be mitigated by expanding supply. This can be enabled by raising labour force participation and reinvigorating productivity growth.
-
Further technological adoption by businesses will boost productivity if complementary improvements in skills are achieved. Policy settings in other areas, including competition and the labour market, need to be revisited as new technologies spread.
copy the linklink copied!Recent macroeconomic developments and short-term prospects
Economic performance has remained impressive, despite various uncertainties. Irish national accounts have been heavily distorted by the activities of multinational corporations in recent years, leading the authorities to develop new analytical measures, such as modified gross national income (GNI*; see the 2018 OECD Economic Survey of Ireland for a full description) and modified domestic demand.
Over the past year, modified domestic demand grew by around 3% (Figure 1.3). While investment activity has softened somewhat, private consumption growth has been solid. Exchequer tax receipts that are sensitive to the economic cycle, such as those related to income tax and value added tax, have been rising strongly.
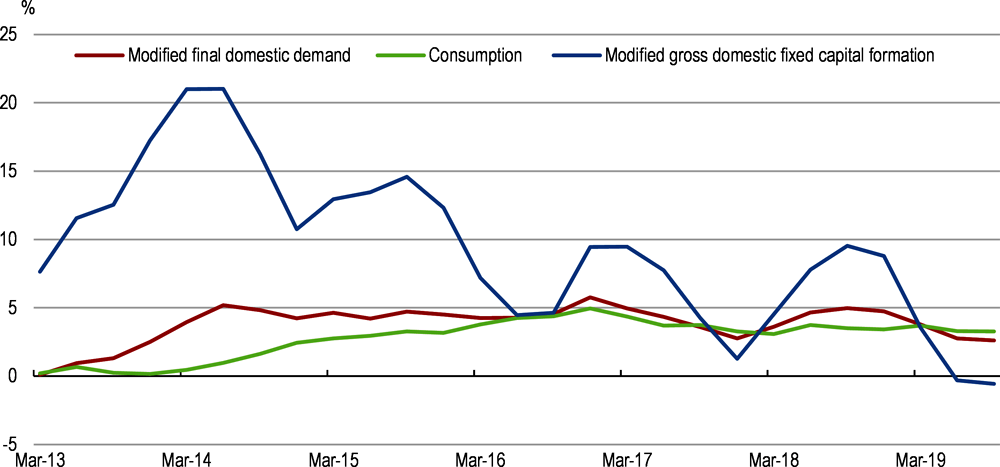
Note: The series are based on a trailing four-quarter average. Modified final domestic demand and modified gross domestic fixed capital formation are underlying measures of economic activity as they exclude the impact of volatile items that have little connection with the real economy such as trade in aircraft by aircraft leasing companies and trade in R&D and intellectual property.
Source: CSO, OECD calculations.
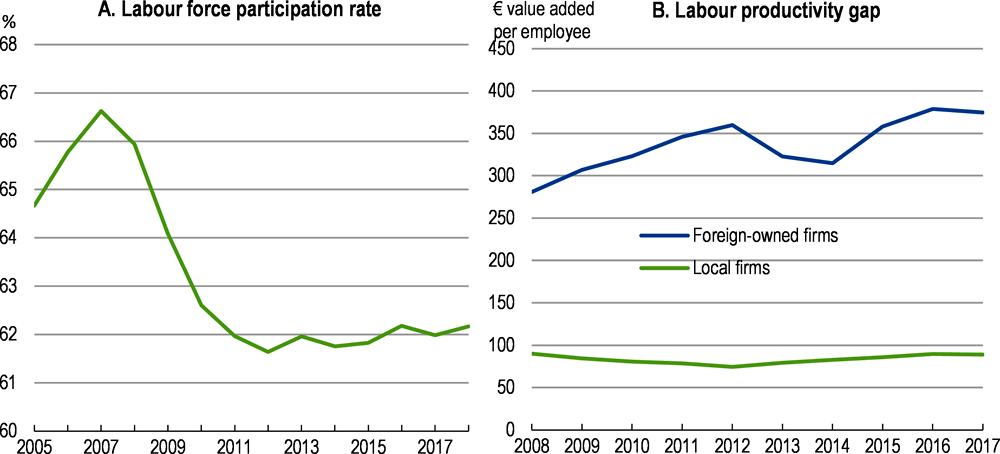
Buoyant consumption growth has reflected labour market strength. Total employment has risen by around 3% annually since 2013, driven fully by an increase in full-time employees. Brighter prospects have induced higher labour market participation (Figure 1.4, Panel A), especially for those of prime working age (25-54). Nevertheless, labour force participation remains four percentage points below the peak reached just before the financial crisis. Immigration plummeted between 2007 and 2010 but has resumed since, while fewer Irish emigrated. Net immigration has thus been positive and growing since 2015. Even so, the labour market has tightened with the continued decline in the unemployment rate. Indeed, the job vacancy rate has risen, putting upward pressure on wages. Average hourly wages have been growing by an annualised rate of 2½% in the past few years (Panel B), partly feeding into prices, particularly in services. Inflation would have been stronger over the past few years, if not for the appreciation of the euro against the British pound since the result of the Brexit referendum in 2016 (Economic Social and Research Institute, 2019).
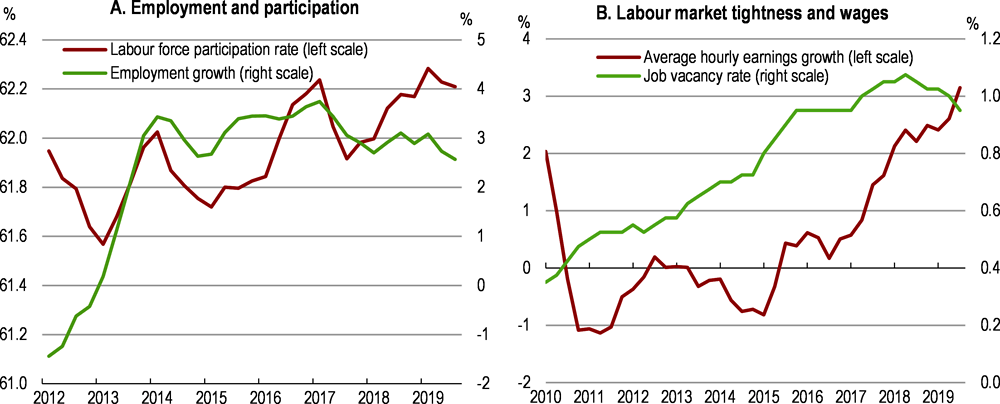
Note: In Panel A, employment growth is calculated as annualised percentage change from quarterly data and the labour force participation is the four quarter moving average. In Panel B, average hourly earnings growth is calculated as annualised percentage change from quarterly data and the job vacancy rate is the four-quarter moving average.
Source: CSO, OECD calculations.
Consumer spending would be even stronger, were it not for high uncertainty. Consumer sentiment is at its lowest level since 2014 and households’ saving rate has risen since the mid-2010s (Figure 1.5). Total credit extended to the sector has also fallen, though this mostly reflects a contraction in credit for house purchases amid tighter macroprudential lending standards.
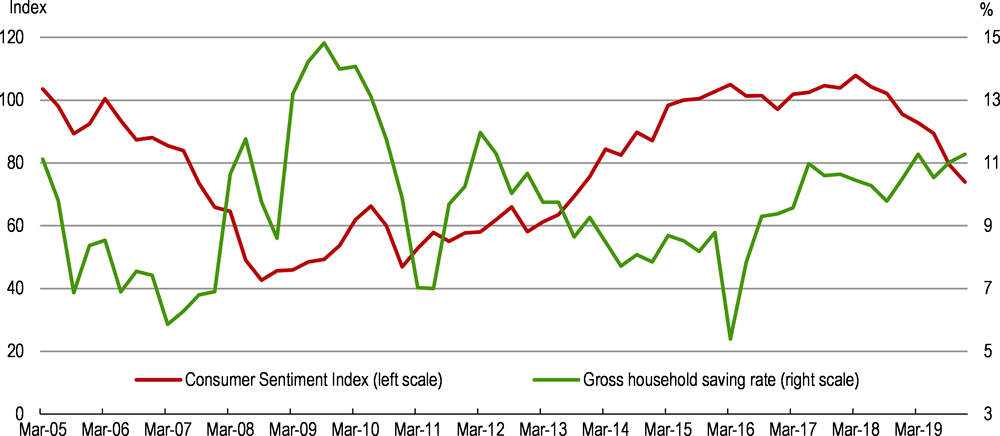
Note: The measure of consumer sentiment is calculated as quarterly averages of monthly readings.
Source: OECD Economic Outlook database, Economic Social and Research Institute (ESRI).
Investment activity continues to be driven by strong growth in housing construction (Figure 1.6, Panel A), a catch-up following the collapse in dwelling supply during the financial crisis (OECD, 2018a) and in the face of population growth. New dwelling completions rose by around 20% in the first three quarters of 2019 compared with a year earlier. Around 21,000 dwellings were likely completed in the full year, contributing to slowing house prices, especially in Dublin. Nevertheless, dwelling rents have continued to rise rapidly and projected demographic changes suggest further increases in the number of new homes is required: the central bank recently estimated that around 34,000 homes are needed each year to 2030 assuming continued high migration and no change in household formation rates (Conefrey and Staunton, 2019). The authorities established new institutions and revised planning guidelines in accordance with several of the recommendations in the 2018 OECD Economic Survey of Ireland aimed at raising housing supply (Table 1.1; also see Chapter 2).This should continue to be a focus for policymakers.
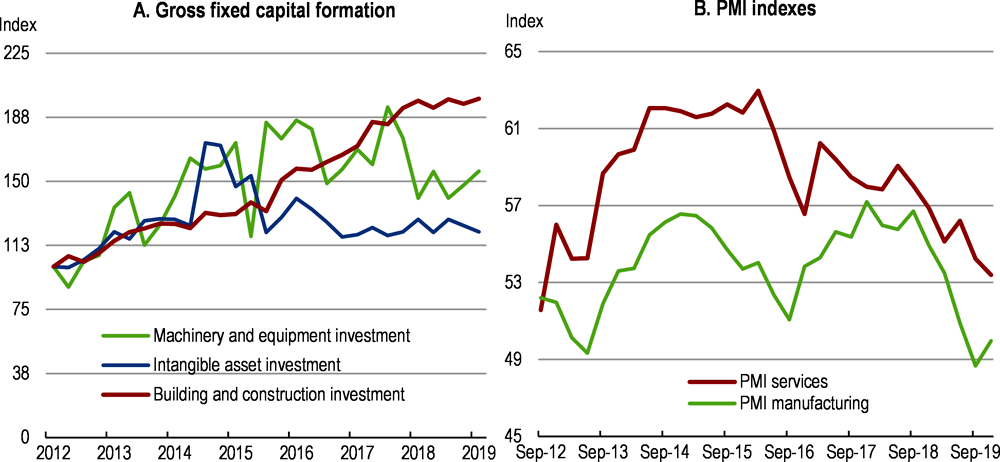
Note: Panel A presents data on gross domestic fixed capital formation. The machinery and equipment component excludes investment in aircraft related to leasing and the intangible assets component excludes R&D service imports and trade in intellectual property. The excluded components tend to be distorted by the activities of multinationals. In Panel B, data are on a three-month moving average basis.
Source: CSO, Markit Economics.
Other building and construction spending has also been robust, partly reflecting public projects under the Ireland 2040 plan. In contrast, investment in non-aircraft machinery and equipment and intangible assets has stagnated since 2015 amid heightened global economic and political uncertainty. This accords with a continued decline in bank lending to small and medium enterprises. In recent months, purchasing managers indexes have weakened, especially for the manufacturing sector (Figure 1.6, Panel B), portending softer private business investment.
Fiscal policy has been expansionary over the past year, with strong public capital spending and steadily growing government consumption. The estimated underlying primary budget balance fell by around ½ per cent of GDP in 2019, suggesting that the increase in the headline budget balance was entirely attributable to stronger cyclical conditions and interest rate developments.
Ongoing export momentum has also supported the domestic economy. Services exports have soared over recent years, mostly driven by computer services. The services sector now accounts for around half of all Irish exports. Merchandise exports have expanded more moderately, partly due to the slowdown in the European economies that are the major markets for such goods (Figure 1.7, Panel A).
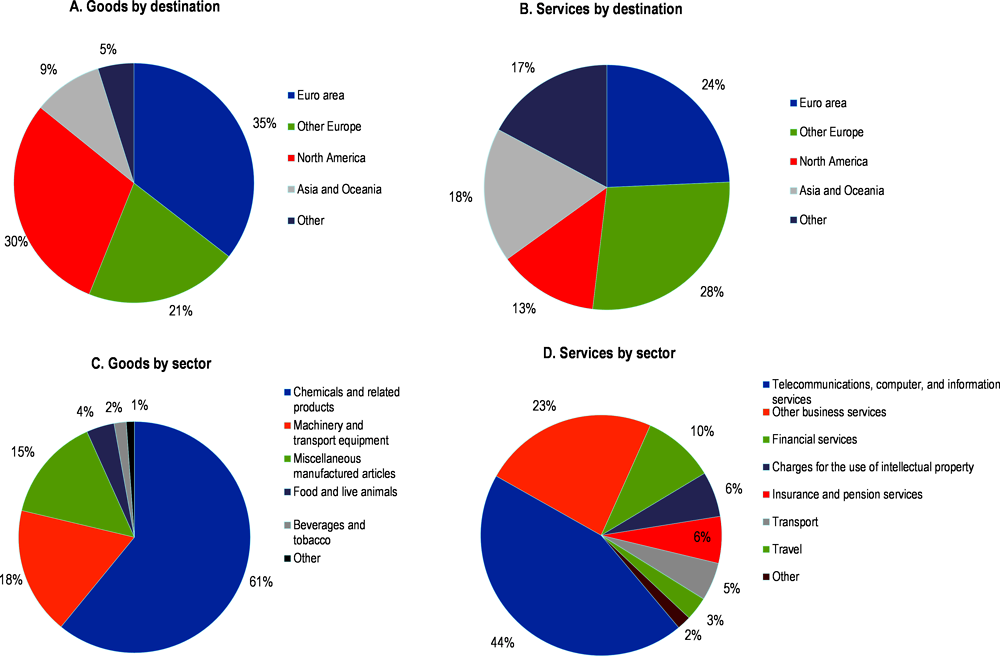
Note: Data presented in Panels A, B and D are for 2017. Data presented in Panel C are an average over 2016-18.
Source: OECD International Trade Statistics.
Despite robust aggregate export growth, the United Kingdom’s planned departure from the European Union (“Brexit”) and slowdown have started to affect Irish trade in some sectors. The United Kingdom accounts for 14% of all Irish exports. Exports of machinery and equipment, chemicals and tourism to Ireland’s large neighbour have either stagnated or fallen since the UK referendum on EU membership in 2016. The 2018 OECD Economic Survey of Ireland presented estimates derived from the OECD METRO model that suggested Irish exports in some sectors such as agriculture and food could fall by around 20% in the event of a trade arrangement between the UK and EU governed by the World Trade Organisation’s Most-Favoured Nation Rules. So far, however, there is not clear evidence of significantly weaker exports in these sectors resulting from Brexit uncertainty (Central Bank of Ireland, 2019a).
Overall, the Irish economy has gained competitiveness and external imbalances have declined in recent years. The growth in Irish exports has outpaced the expansion in Irish export markets, signalling gains in export market share. Ireland’s current account is volatile and heavily influenced by the activities of multinationals. However, in underlying terms, it has moved from a deficit of 7½ per cent of GNI* in 2008 to a surplus of 6½ per cent in 2018 (Figure 1.8). Although the current account surplus has been inflated by recent unexpectedly high corporate tax revenues, it would have still recorded a surplus of around 4% of GNI* in 2018 if windfall corporate tax receipts from 2015 to 2018 were excluded (Department of Finance, 2019a).
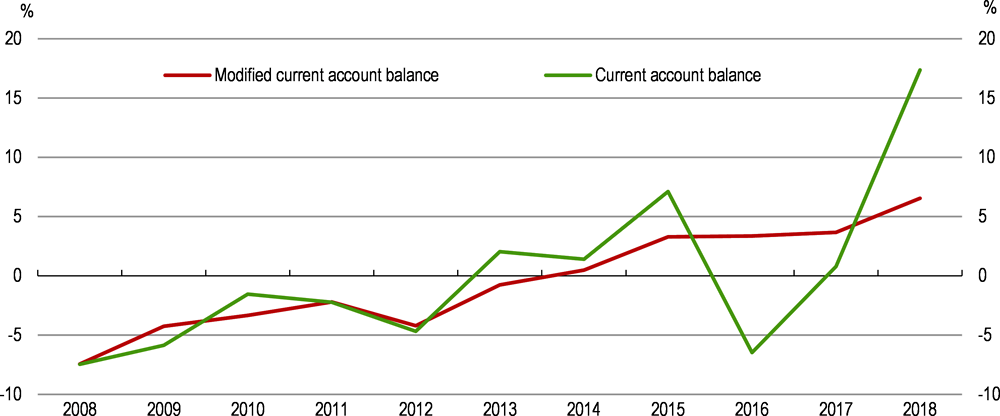
Note: The modified current account balance adjusts for three main distortions affecting the interpretation of the headline current account: intellectual property imports, imports of aircraft related to leasing and profits of companies that establish a legal presence in Ireland while investing little in the country.
Source: CSO, OECD calculations.
Looking ahead, on the assumption of an orderly Brexit (i.e. the transition period is assumed to end smoothly), economic growth is set to moderate but remain slightly above estimated potential output growth (Table 1.2). Lingering Brexit-related uncertainty will constrain business investment and private consumption. Housing–related construction and public capital projects will continue to support the economy, although mounting capacity constraints may hinder growth in these areas. The unemployment rate will continue to fall to historically very low levels with wage pressures building. As higher wages further feed into prices, competitiveness will deteriorate absent a resurgence in productivity growth. A slowdown in demand in Ireland’s major trading partners will also contribute to lower export growth.
In the event of an orderly Brexit, fiscal policy is expected to exert a broadly neutral influence on economic conditions. Given that the economy is expected to grow slightly above estimated potential output growth and that euro area monetary policy settings are exerting a stimulatory effect, fiscal policy should be tightened to have a slightly contractionary influence. That said, the high level of uncertainty at present means that the authorities should prepare to make further counter-cyclical adjustments to fiscal policy settings if either upside or downside shocks eventuate.
The risks to the economic outlook are tilted to the downside. The exact impact of Brexit on the economies of the United Kingdom and European Union is highly uncertain and depends on the nature of any trade arrangement eventually agreed, but a sharp slowing in demand from these areas will notably weaken the Irish economy given its high dependence on trade. The re-imposition of customs and border controls and additional administrative burdens along the UK “Land Bridge” has the potential to significantly increase costs for traders (Box 1.1). The Irish Maritime Development Office estimate that over €21 billion of trade was carried out via the UK Land Bridge in 2016. Furthermore, beyond the central forecast scenario and its associated risks, a disorderly resolution to the Brexit transition process, a ratcheting up of trade policy tensions directly involving European economies and an oil supply shock would considerably alter the outlook (Table 1.3).
The United Kingdom “Land Bridge” is a term used to describe a route that connects importers and exporters in Ireland to international markets via the United Kingdom road and ports network. It is a strategically important means of access to Ireland’s main export markets in the European Union as it delivers transit times at least twice as fast as alternative routes. As a result, the Land Bridge has typically been favoured by traders in perishable goods, those that rely on speed of delivery as a competitive advantage and those that trade in high value added goods where shorter transit times reduce working capital requirements.
A recent study by the Irish Maritime and Development Office produced an estimate of the volume of Irish trade that uses the Land bridge to access the European Union. In 2016, it was estimated that around 40% of Irish exports in both volume or value terms travelled via the Land Bridge. In addition, around 13% of Irish import volumes and values used the route.
Source: Breen, et al. (2018).
If negative risks eventuated, some of the Irish economy’s vulnerabilities could compound the pain. Legacies of the financial crisis could also amplify a negative economic shock. The debt burden of the household sector remains high by cross-country standards, though it has declined notably over the past decade (Figure 1.9). Public sector debt is also still high and fragilities in the financial sector remain a source of concern for policymakers (both discussed further below). A great asset to the Irish economy, but also a vulnerability, is the high share of foreign-owned firms in the business sector. They currently account for around one in five jobs in Ireland (both direct and indirect effects) and the bulk of corporate tax revenues. The 2018 OECD Economic Survey of Ireland documented a large positive productivity gap between foreign-owned and locally-owned firms in the Irish economy. Furthermore, foreign-owned firms primarily source inputs from abroad (OECD, 2020a), with such firms in key sectors like chemicals and computer, electronic and optical products sourcing less than 10% of their materials within Ireland. Foreign-owned firms are internationally mobile and a fading of their desire to locate in Ireland could weigh heavily on the economy. Rising international tax competition as well as new international tax agreements as part of the OECD Base Erosion and Profit Shifting (BEPS) process (discussed further below) could influence the future location decisions of foreign-owned firms.
While corporate debt is high by international standards, it is inflated by the debt of large multinational enterprises to foreign counterparties that are often within the same corporate group. Abstracting from these liabilities, Irish corporate debt is roughly in line with that in other European countries (Department of Finance, 2019b).
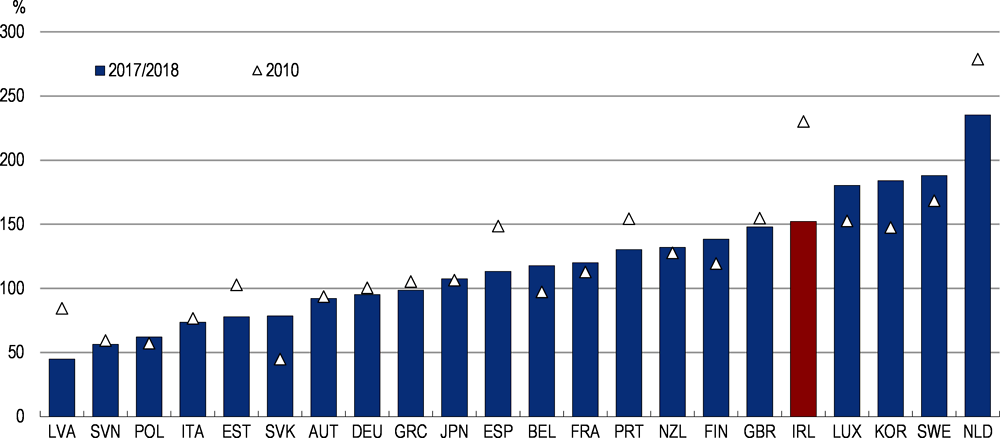
Note: The blue bars present the latest available data point, which corresponds to either 2017 or 2018.
Source: OECD Resilience database.
copy the linklink copied!Safeguarding financial stability
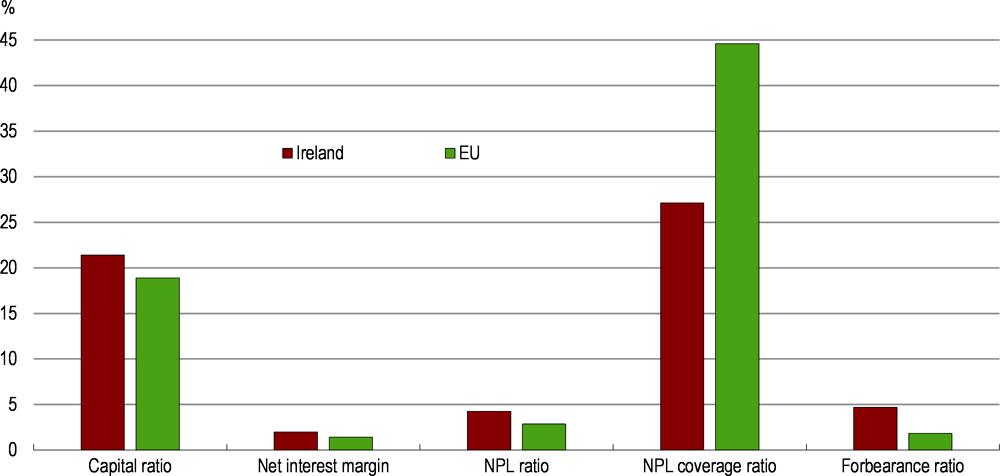
The Irish banking sector has deleveraged markedly since the financial crisis, with balance sheets having contracted by around 60% since 2009. More stable sources of funding now make up a larger share of liabilities and banks have become more resilient to shocks. The leverage ratio (the ratio of core capital to total assets) was close to double the average EU value in early 2019, with the retail banking sector having twice as much Tier 1 capital relative to risk weighted assets as in 2010. Interest margins are relatively comfortable (Figure 1.10), mainly due to lower funding costs and interest rates on mortgage loans and SME loans that are higher than in other countries (European Commission, 2019a).
The results of 2018 EU-wide stress tests suggest that Irish banks could weather a significant downturn. The tested banks had enough capital to remain solvent in the event of Europe-wide recession, while maintaining lending to the rest of the economy in line with debt repayments from borrowers. The Central Bank of Ireland has actively deployed macroprudential policy measures to buttress the stability of the financial system. Since 2015, macroprudential mortgage rules such as loan-to-value and loan-to-income limits have been applied. A countercyclical capital buffer is currently set at 1% and additional capital buffers are applied to six supervised institutions identified as systemically important.
The Central Bank recently opted to maintain the regulated loan-to-income and loan-to-valuation limits for 2020. The measures have become increasingly binding as housing prices outpaced incomes (Kelly and Mazza, 2019). With a housing market that continues to suffer from supply constraints, this signals that the measures are working as intended: encouraging mortgage lending that reflects borrower’s debt servicing capacity and leaning against the conditions for another credit-fuelled boom-bust housing cycle to take root. A recent counterfactual analysis estimated that dwelling prices would have been 26% higher in early 2019 if the macroprudential mortgage measures had not been introduced (Central Bank of Ireland, 2019b).
Source: European Banking Authority.
The macroprudential toolkit should continue to be evaluated against emerging risks. The current set of policy measures assume an orderly Brexit scenario. They are also focused primarily on the banking sector, despite the share of non-bank financial institutions having risen dramatically over recent years (IMF, 2019). The development of a systemic risk buffer should be considered, following the agreement of the Minister of Finance to transpose the measure into Irish law and give responsibility to the central bank for its implementation and calibration. If adopted, this tool would allow the central bank to impose additional capital requirements on banks to safeguard the financial system against an idiosyncratic shock. Having the systemic risk buffer in the macroprudential toolkit could be especially important for a very open economy like Ireland that has been prone to volatility in the past.
Irish retail bank profitability has recovered since the crisis. However, a number of the systemically important Irish-headquartered banks are still trading below book value, indicating that market participants are pessimistic about future profitability and asset quality. Costs in Irish banks are inflated relative to other European banks (Central Bank of Ireland, 2019b) and have been rising: the aggregate cost-to-income ratio picked up from 56% in mid-2016 to around 63% in 2019. Downward pressure on net interest margins due to the low interest rate environment and the lingering high stock of non-performing loans (NPLs) on bank balance sheets have also been weakening bank profits.
The NPL ratio fell from around 15% in mid-2016 to 5% in 2019, aided by portfolio sales and improved economic conditions. Moreover, the stock of NPLs more than one year past due halved in the year to June 2019. Nevertheless, the aggregate NPL ratio in Ireland remains elevated compared to European peers (Figure 1.10) and many of the remaining NPLs on bank balance sheets may be difficult to cure (Central Bank of Ireland, 2019c). This partly reflects weak collateral enforceability due to slow repossession proceedings relative to other countries (O’Malley, 2018; National Competitiveness Council, 2019). Repossession is especially slow for primary dwellings (OECD, 2018a) and mortgages tied to such dwellings remain the main source of the remaining NPL stock.
Slow repossession proceedings provide a disincentive for both the borrower and lender to engage in the repossession process. Reflecting this, the proportion of loans granted forbearance in Ireland was over double the European Union average in 2019 (Figure 1.10). Furthermore, over half of the remaining principal dwelling arrears balances are long-term in nature (over 720 days past due). Relatively weak mortgage enforceability in Ireland means that increased provisioning for non-performing housing loans may be needed, especially as such provisions are relatively low in Ireland. Although NPL sales have mostly been at values within provisioning levels, increased provisioning requirements would encourage banks to reduce their stock of NPLs more rapidly and allow them to do so without threatening their solvency. In any case, higher NPL provisions are likely to be required over the coming year as part of the European Central Bank’s Supervisory Expectations for Prudent Provisioning (Central Bank of Ireland, 2019b). European Union regulations have also been amended to introduce minimum coverage (i.e. a “prudential backstop”) for losses caused by future loans that turn non-performing (European Union, 2019).
To further promote non-performing loan resolution, the authorities should also identify measures to speed up repossession proceedings. As discussed in the 2018 OECD Ireland Economic Survey, slow repossession procedures partly reflects high frequency of adjournments of mortgage arrears cases before the courts (OECD, 2018a). The authorities should consider standardising the ‘suspended’ possession order, like in the United Kingdom (CCPC, 2012). This would better encourage engagement between the borrower and lender by granting lenders a collateral possession order for a future date with the suspension of possession conditional on well-defined criteria. Trade-offs exist, as such a policy may have the unintended consequence of encouraging collateral to be run down by debtors. The impact of any such policy change on debtor wellbeing should also be evaluated, with the reform carefully designed to ensure that the benefits with regard to reducing uncertainty and encouraging the provision of finance outweigh any unintended costs.
New financial sector entrants
The reduction in the size of bank balance sheets has coincided with strong growth in the non-bank financial sector. Investment funds, the largest part of Ireland’s non-bank financial sector, have increased their balance sheet more than six-fold since the end of 2008. In mid-2019, such funds had assets under management of €2.6 trillion (around 8 times annual GDP).
Most of the exposure to non-bank financing entities lies with non-residents. The assets and liabilities of such entities are reasonably well diversified geographically, though around 30% of their assets and funding are directly related to the United States (IMF, 2019). In recent years, the links between non-banks and the Irish economy have been growing. Irish resident investment funds now hold around one-third of the stock of investable commercial real estate (Central Bank of Ireland, 2019b). Furthermore, domestic banks now invest about 12% of their assets into investment funds and other non-bank financial intermediaries and around 10% of bank funding derives from these sources (IMF, 2019). These tighter links increase the risk that a shock to the non-bank financial sector would affect real economy.
Some segments of the non-bank market are highly leveraged. In particular, real estate investment funds notably increased their leverage over the past five years. This was partly due to the introduction of a 20% tax rate on foreign investors holding shares of funds investing in Irish property, which induced shareholder loans to be increasingly used in place of equity (Central Bank of Ireland, 2019b). As part of Budget 2020, the government introduced limitations on deductions for interest expenses in an attempt to disincentivise high levels of leverage by real estate investment funds. Nonetheless, even after abstracting from the increase in shareholder loans due to the earlier change in taxing arrangements, such funds remain highly leveraged relative to European peers (Central Bank of Ireland, 2019b). A risk is that an increase in market interest rates (for instance, through a sudden drop in global risk appetite) could result in forced sales of real estate assets.
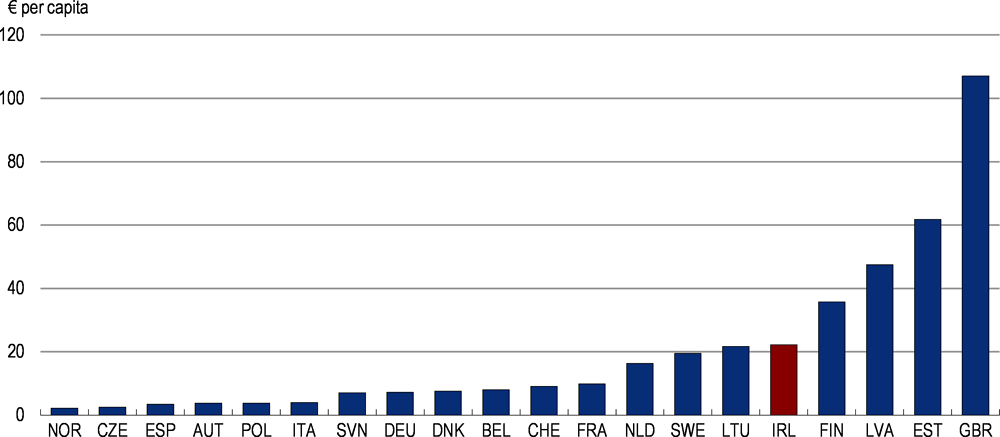
Given the wide variety of entities and activities in the non-bank sector, the authorities must continue to invest resources in monitoring developments and enhancing their capability to conduct robust stress tests of the sector. In doing so, care should be taken not to introduce excessive regulatory burdens that would hold back the development of innovative financial solutions providing alternatives to bank financing. Bank interest rates are relatively high in Ireland (Figure 1.11), partly due to a lack of competition in the financial sector following the financial crisis, so new sources of finance should be encouraged.

Note: Indicators are measured as at August 2019.
Source: European Central Bank.
Technology has enabled the entry of new business models of credit intermediation that operate online (“fintech”), such as lending-based crowdfunding and balance sheet lenders (leveraged non-bank institutions that transform risk and maturity). Online alternative financing is quite developed in Ireland relative to most other EU countries (Figure 1.12). Such sources of finance can both introduce competition to the traditional banking sector and provide access to finance for entities that have trouble obtaining credit from traditional banks. For instance, some young entrepreneurial firms that have few physical assets and a limited track record may turn to online alternative financing platforms. The emergence of fintech can reduce the systemic importance of some existing entities. Furthermore, platform intermediation may be less prone to self-fulfilling bank runs than traditional banks as borrowers and lenders are connected directly, meaning that a lender's return does not depend on the actions of other lenders (Havrylchyk, 2018). At the same time, growth in decentralised financial technologies may bring risks to financial stability. For instance, peer-to-peer lending patterns are often prone to pro-cyclicality and pose legal and administrative challenges for recovery resolution (Financial Stability Board, 2019).
Recently, Big Tech companies with a large user base have entered the EU payments market (e.g. Apple Pay, Google Pay and peer-to-peer payments and donations via Facebook Messenger). Some of these have done so by obtaining licenses in Ireland. The scale of the network that Big Tech companies possess makes their potential for disruption to the existing market especially large. Their entry can make cross-border payments less expensive and time-consuming for consumers. Some entrants are adopting a “freemium” business model, by which payment services have no financial cost for users but their data is collected and can be used for advertising and other functions. This information could be used by Big Tech companies to create credit-scoring models that are sold to banks and other loan originators. Past work has highlighted that information from users’ online activity can substantially improve the prediction of default when combined with credit bureau scores (Berg et al., 2018). In principle, better prediction of default would enhance financial stability.
Source: Cambridge Centre for Alternative Finance.
The size of Big Tech firms and their large existing customer network may have adverse consequences for competition in the market. Online payments may be characterised by winner-takes-all dynamics, as the value to customers of a platform is likely to increase with the number of active users. Many Big Tech firms also have considerable gatekeeper power due to their ability to bar other companies from accessing their technological infrastructure (Khan, 2018). While increased market concentration is not necessarily undesirable, policymakers must ensure that incumbents do not defend dominant positions through anticompetitive conduct. This includes through Big Tech companies acquiring smaller innovative firms that could grow into potential competitors.
Only around one-third of fintech firms are regulated by the Central Bank of Ireland or another European country (Enterprise Ireland, 2018) and unregulated entities have no reporting obligations to the regulator. While some of these unregulated firms do not provide financial services, many undertake activities that can have implications for consumer protection, market conduct, payment activities and financial stability. Designing a robust regulatory framework requires intimate knowledge by regulators about emerging business models and risk management practices. An “Innovation Hub” has been launched by the central bank to increase engagement between regulators and fintech firms and has received around six enquiries each month (Central Bank of Ireland, 2018). This should be complemented by ensuring that regulators have the power to obtain relevant information from those unregulated entities in the fintech or Big Tech domains that undertake activities that have implications for the functioning of the financial sector and consumer protection. At the same time, care should be taken to ensure that reporting obligations do not impose an inordinate administrative burden on these firms.
The central bank and competition authorities should also continue to closely monitor the level of market concentration in the non-bank financial sector, especially with the emergence of payment services through Big Tech companies. If such entities launch a new payment service via a subsidiary, the Irish regulators treat the new firm the same way that they would any other start-up. However, given the potential market power afforded to such payment services from the existing network of the parent company, greater scrutiny of the competitive consequences on the market of the firm’s entry is required.
copy the linklink copied!Ensuring fiscal sustainability
Recent fiscal developments
Ireland’s fiscal position continues to improve. For the first time in a decade, the budget balance returned to surplus in 2018. However, in the past few years the improvement has not reflected a structural tightening of fiscal policy. Instead, unexpected corporate tax receipts and interest savings have enabled the government accounts to balance. Against a backdrop of emerging capacity constraints, fiscal policy has been too loose, even if it has been less pro-cyclical than in 2005-09 or 2010-14 (Figure 1.13). The authorities should be vigilant to ensure that the historical pattern of fiscal policies that have amplified, rather than smoothed, the economic cycle is not repeated.
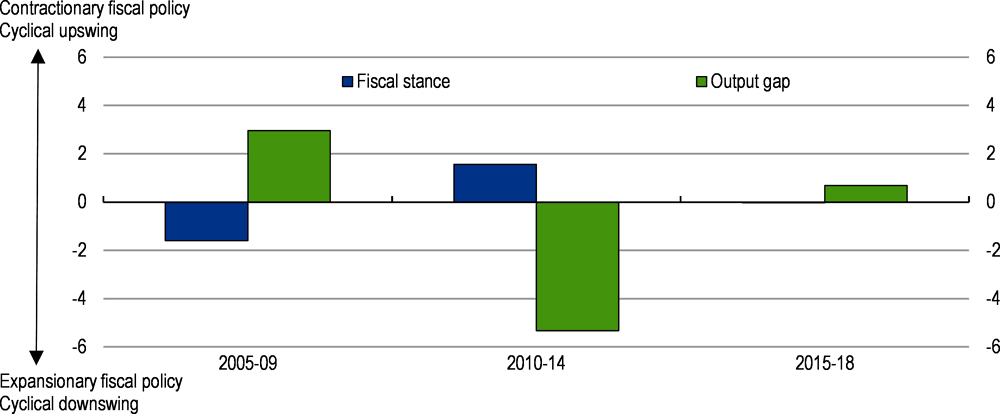
Note: The figure presents the simple average of the fiscal stance (defined as the change in the underlying primary budget balance as a percentage of GDP) and the output gap over successive time periods. An increase in the fiscal stance denotes a contractionary fiscal stance. A positive output gap means actual GDP exceeds estimated potential output.
Source: OECD Economic Outlook database, OECD calculations.
The recent rise in corporate tax receipts is likely to be unwound over the medium term and the authorities should plan accordingly. The Irish Fiscal Advisory Council has estimated that corporate tax receipts in 2018 were 30-60% (equivalent to 1½-3% of GNI*) higher than expected based on the economy’s underlying performance (Irish Fiscal Advisory Council, 2019; Figure 1.14, Panel A). The concentration of corporate tax receipts continues to increase: the top 10 taxpaying companies accounted for 45% of overall corporate tax revenues in 2018, up from 39% in 2017 (Department of Finance, 2019c). The Department of Finance has taken the prudent approach of assuming that around one third of corporate tax receipts are non-recurring in their preparation of the subsequent year’s budget. However, unbudgeted expenditures over the past few years have meant that a substantial portion of these non-recurring receipts have been spent within the year (Figure 1.14, Panel B).
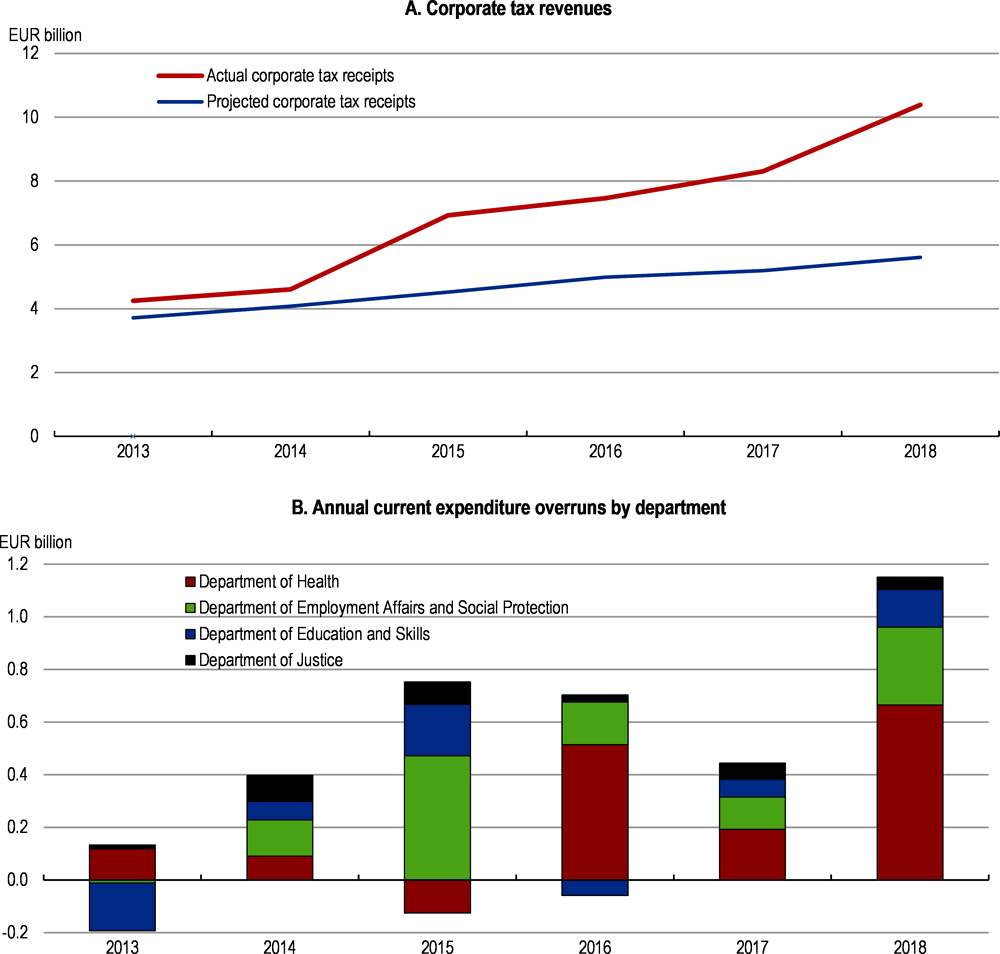
Note: In Panel A, corporate tax receipts are projected using the best-performing modelling approach outlined in Casey and Hannon (2016). In Panel B, the four largest departments by current expenditure are shown. Expenditure overruns are calculated as the difference between the outturn and budgeted gross current expenditure for that year.
Source: Irish Fiscal Advisory Council.
The health sector has been a notable source of current expenditure overruns over the past few years, despite increased budget allocations. Another recurring issue has been the payment from the Department of Employment Affairs and Social Protection of Christmas bonuses to social welfare recipients that are unbudgeted and adjusted from year to year based on “prevailing conditions”. In addition, some large public capital projects saw sizeable cost overruns. Ireland’s Comptroller and Auditor General has undertaken a review into significant time and cost overruns in recent capital projects in the higher education sector (Comptroller and Auditor General, 2019). Across both current and capital public expenditures, the historical pattern of cost overruns that are balanced through supplementary government financing creates little incentive for future public spending efficiency.
Further public spending overruns may crowd out other current or capital spending needs. As part of the National Development Plan 2018-2027, the government set aside €116 billion for public investment. This is a response to deep cuts to public capital investment through the crisis years and to expected future demographic pressures on infrastructure. Many such projects are much needed and cost overruns or poor project selection that crowd out public investments with high social returns must be avoided. Alternatively, additional unbudgeted public spending could slow the necessary continued reduction in government debt if other spending plans are maintained through increased borrowing.
In prioritising, costing and delivering public capital projects, the need for better availability of detailed data on public assets was underlined in the OECD Ireland Economic Survey 2018. More broadly, a recent OECD evaluation of the Irish Government Economic and Evaluation Service identified poor data availability as an impediment to evidence-based policy making (OECD, 2020). A welcome development was the increased emphasis on improving data collection and identifying data gaps in the government’s 2019 Spending Review. New tools have also been developed such as the Investment Projects and Programmes Tracker that provides information on the progress of all major investments that make up Project Ireland 2040. However, continued efforts should be made to systematically collect information on the performance of existing public assets to better enable transparent, evidence-based prioritisation of future infrastructure projects. New Zealand provides an example of a country that identified data gaps as an impediment to robust infrastructure planning. Subsequently, a cross-sector infrastructure evidence base was published in 2014 and updated thereafter. The database provides performance indicators related to public assets as well as scenario analysis to identify future demand pressures on the infrastructure stock.
Government debt ratios continue to trend down, but gross general government debt remains high at above 100% of modified gross national income (GNI*). For Ireland, GNI* is a better indicator of the capacity of the government to repay its debt, insofar as it is less affected by one-off factors related to the activities of multinational enterprises. In per capita terms, general government debt is one of the highest in the OECD (Figure 1.15). Over half of long-term Irish government bonds are held by non-residents, that come with a higher risk of sudden stop in the event of a negative shock (Department of Finance, 2019d). Refinancing risk has been reduced through a significant increase in the average maturity of Irish government debt over the past decade. By 2018, average debt maturity was high compared with other European countries at above 10 years (Department of Finance, 2019d).
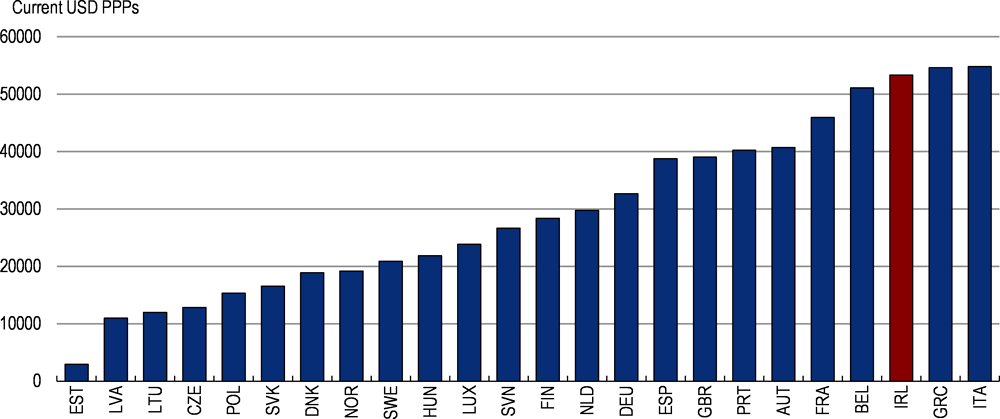
Note: Data for Norway are for 2015.
Source: OECD.
The authorities have also now established the “Rainy Day Fund”, for use in the event of a severe adverse economic shock (Table 1.5). Initially, €500 million were to be transferred to the Fund from the Exchequer each year until 2023, and so far the Fund has accumulated €1.5 billion in liquid assets. Nevertheless, in preparing Budget 2020, the authorities chose not to transfer the earmarked €500 million to the Fund because of the potential challenges associated with a no-deal Brexit. Going forward, the transfer of the agreed amount to the Fund should be made each year, with the intended pool only reduced if a severe adverse economic shock does actually come to pass. Furthermore, the incoming government should commit to transferring further windfall corporate tax revenues to paying down general government debt and partly to the Fund to ensure future negative shocks can be offset through fiscal loosening.
Looking forward, the fiscal framework needs further reform, as some of the fiscal rules outlined in the EU Stability and Growth Pact are not entirely suitable in the Irish context. Ireland’s upwardly distorted GDP, along with inflated corporate tax receipts, flatter the Irish fiscal position when judged against fiscal rules that are based on GDP or on the closely-related measure of potential output growth that is harmonised across EU countries. As part of Budget 2020, the Department of Finance noted that key components of the EU fiscal rules such as the binding 3% of GDP threshold for the headline fiscal deficit, the 60% general government debt-to-GDP threshold, the “medium-term objective” and the “expenditure benchmark” (both of which depend on estimates of potential output growth) are misleading in the case of Ireland (Department of Finance, 2019e). To support the calibration of appropriate fiscal policy, Ireland should self-impose a more stringent set of fiscal targets. These should be based on GNI* (instead of GDP) and the measure of potential output growth that has been developed by Ireland’s Department of Finance and endorsed by the Irish Fiscal Advisory Council. The authorities recently made progress in this regard, announcing a target for public debt as a share of GNI* of 60% in the long term and around 85% by 2025.
Ireland continues to be an active participant in efforts to advance international tax policy coordination. Numerous actions have been taken to implement recommendations from the OECD BEPS Action Plan. These include the introduction of country-by-country reporting for large multinational enterprises and the first OECD-compliant patent box, as well as early signature and ratification of the BEPS Multilateral Instrument.
The OECD has recently released two consultation documents on potential changes to the International Tax System. These proposals fall under two Pillars. Under Pillar 1, the Secretariat has proposed a Unified Approach that would establish a new nexus and allocate increased taxing rights to market/user jurisdictions. Under the proposal, countries would be allocated some taxing rights that would not be dependent on physical presence but would be largely based on sales (OECD, 2019a). Under Pillar 2, the consultation document outlines a proposal that would aim to ensure that all internationally operating businesses pay a minimum level of tax on their foreign income. This could impact the attractiveness of Ireland as a location for foreign direct investment. While many details of the proposals are still under discussion by the Inclusive Framework on BEPS, such an agreement would go some way to addressing the tax policy challenges arising from the digitalisation of the economy.
Substantial fiscal pressures loom on the horizon
Ageing-related costs will exert substantial pressure on public finances over the coming years. Current trends suggest the increase in public expenditure on health and pensions will be one of the largest in the OECD, expanding by over 6% of GDP by 2060 (Figure 1.16, Panel A). Government debt is projected to rise back above 115% of GDP absent offsetting policy measures (Figure 1.16, Panel B). Ageing may also put downward pressure on revenues, as it will lower the proportion of people active in the formal labour market in a tax system that relies heavily on labour taxation. Growth-enhancing structural reforms may provide some offset, but this will not be enough to put government debt on a sustainable trajectory.
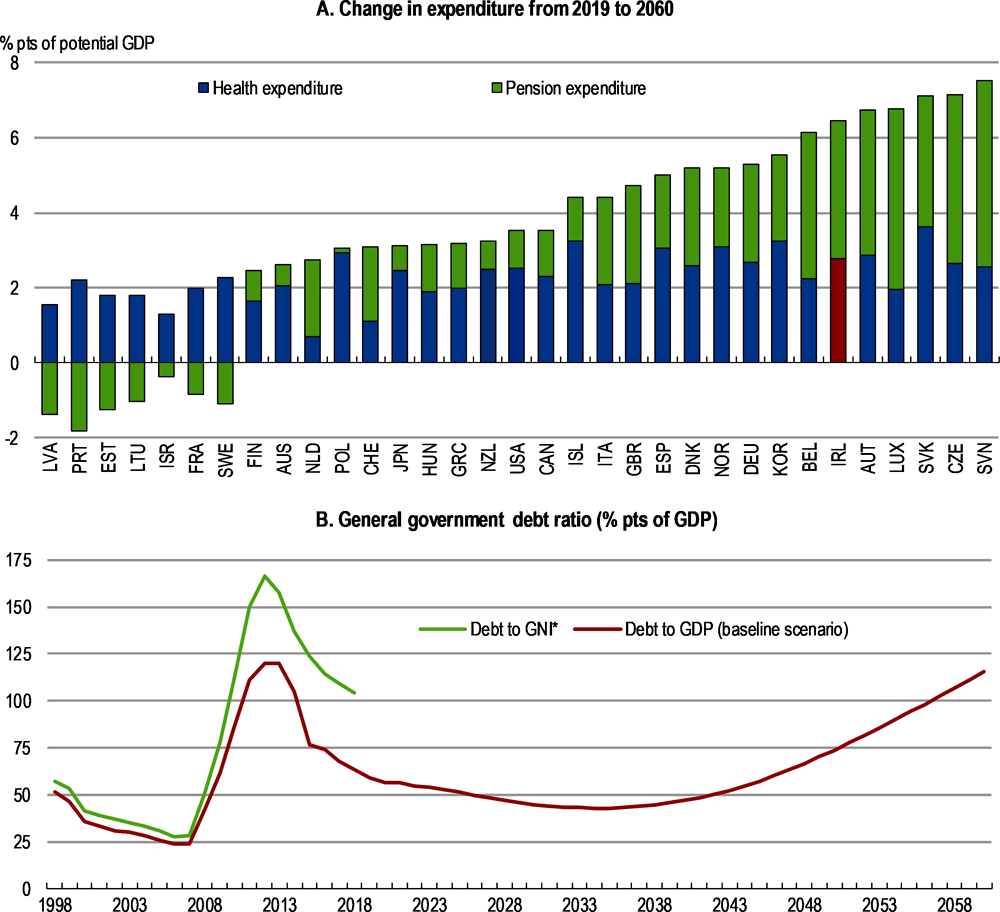
Source: Simulations based on the OECD Economics Department Long-term Model.
Future corporate tax revenues are also likely to slow. The authorities acknowledge that the windfall corporate tax revenues of recent years may not be sustained and new international tax rules around the digital economy could reduce corporate tax revenues further (Government of Ireland, 2019a). The impact of international tax changes on Irish tax receipts depends heavily on the exact rules adopted. Notwithstanding considerable uncertainty, the authorities recently estimated that corporate tax receipts could be €500 million lower per year between 2022 and 2025 as a result of the implementation of BEPS (Government of Ireland, 2020). This does not take into account potential secondary effects, such as the location decisions of multinational firms.
The combination of still high public debt, elevated economic uncertainty and substantial future cost and revenue pressures require deep reforms to fiscal policy. There is scope to improve expenditure efficiency, but new streams of tax receipts will need to be found if government finances are to be made sustainable and large cuts to public services avoided. Ireland proved adept at implementing essential economic reforms that were well communicated to the population through the recent economic crisis, suggesting that such changes to fiscal policy are achievable.
Raising public spending efficiency
An ageing population will mean a greater share of government spending allocated to health, social care and pensions over the coming years. Combined with the fact that health and social protection have been experiencing the largest recent cost overruns (Figure 1.14, Panel B), improving public expenditure efficiency in these areas should be prioritised.
In the health sector, most of the recent increase in public funding has been directed toward hospitals. However, it has led to no significant increase in measured outputs (Lawless, 2018), insofar as the overall number of patients on hospital waiting lists has not declined (Health Service Executive, 2019). Unbudgeted health spending has been attributed to both weak spending controls and weak budget planning (Irish Fiscal Advisory Council, 2018). Several recent initiatives have sought to improve spending efficiency in hospitals. Activity-based funding (whereby budgets are allocated to each hospital based on the number and complexity of patients) has replaced block funding for inpatient and day-case procedures. The Health Service Executive also introduced an Accountability Framework for the sector, with a review undertaken in 2015. However, several of the review’s recommendations, including the requirement for hospitals to produce their own productivity plans, have not been implemented.
The key instrument available to the Health Service Executive for budget planning is the National Service Plan. There are legislative requirements associated with these plans to have them set out the health services to be provided in the forthcoming year given the allocated budget envelope. Nevertheless, several of them have not been fulfilled in recent years (Connors, 2018). Going forward, the plan should: i) be drafted in line with the agreed budget published in mid-December every year, ii) provide estimates of the number of employees of the Health Service Executive during the period and the services to which they relate, iii) indicate the type and volume of health and personal social services to be provided during the plan period.
In the area of social protection, pension spending is anticipated to increase by around 0.7% of GDP over the next decade, accounting for half the increase in demographic-driven public costs. Ireland’s state pension operates on a pay-as-you-go basis, meaning that pension disbursements are funded by the taxes and social contributions of current workers. An expected rise in the old-age dependency ratio, from 20.5% in 2016 (i.e. 4.9 workers for every old age dependent) to 44% in 2051 (Parliamentary Budget Office, 2019), will then threaten the sustainability of the system. To help tackle this challenge, the state pension age was increased to 66 in 2014 and will rise to 67 in 2021 and 68 in 2027. Thereafter, it ought to be linked to changes in life expectancy. There is also scope for private pensions to play a greater role in the system, as private pension coverage is currently low in Ireland (OECD, 2019b). The authorities outlined a Roadmap for Pension Reform in 2018 which included an auto-enrolment system, whereby private pension contributions from employers and employees (subject to an earnings ceiling) will be partially matched by the government. This measure designed to strengthen private pension savings is scheduled to be introduced in 2022.
At present, increases in the State pension are determined in a discretionary manner as part of the annual budget process. This contrasts with many other OECD countries where the benefit rate is indexed to domestic wage or price developments. Since 2002, the state pension benefit has risen by 65%, following a heavily pro-cyclical pattern, compared to a 20% rise in Irish consumer prices (Figure 1.17). Compared with other OECD countries, the value of the basic pension in Ireland appears adequate at present (OECD, 2017b). Indexation of future benefit increases to consumer price inflation would be a more transparent system that, based on recent historical experience, would produce budgetary savings. In a similar vein, Christmas bonuses to welfare recipients should be delinked from revenue outturns in order to improve fiscal sustainability and to avoid fiscal policy exacerbating fluctuations in economic conditions. These bonuses should also be systematically included in government budget plans.
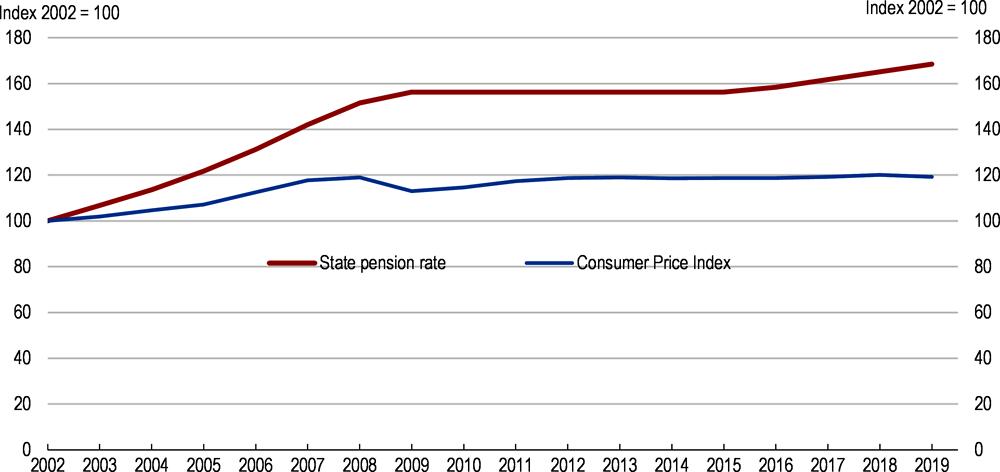
Source: Department of Employment Affairs and Social Protection, CSO.
Raising revenues through growth-friendly tax sources
New sources of revenue are likely to be needed in addition to structural reforms and improvements in public spending efficiency to achieve a sustainable path of public debt. At present, the tax burden in Ireland is low compared with other OECD countries in Europe (Figure 1.18). In the first instance, the tax base of those forms of taxation proven to be less distortionary for economic activity or that dissuade undesirable activities should be broadened. Some changes in tax policy may have adverse distributional consequences that require offsetting policy adjustments to ensure that social cohesion is maintained.
Note: Data for Australia and Japan are for 2017. Given the distortions to Irish GDP, alternative measures for Ireland are also presented. Both the ratio of tax revenue to GDP in 2014 (before the significant distortions to Irish GDP occurred) and tax revenue as a share of modified gross national income (GNI*) are presented in pink. It should be noted that the latter measure is not strictly comparable to the measures for other countries that take GDP as the denominator.
Source: OECD Revenue Statistics database.
A recent laudable tax policy change was the restoration of the VAT rate for most businesses in the hospitality sector to 13.5% (from 9%), announced in Budget 2019 (Table 1.4). Consumption taxes are less distortionary to the economy than some other taxes such as those on income (Johansson et al., 2008) and the 2011 reduction of the Value Added Tax (VAT) rate for the hospitality sector to 9% had little economic merit. The experience of other European countries such as France suggest that the stimulatory impact of such measures on employment are modest (Benzarti and Carloni, 2017). Moreover, as many of the items in the sector are disproportionately consumed by those with relatively high incomes, the reinstatement of the 13.5% VAT rate for hospitality should not harm inclusiveness.
As highlighted in the OECD Ireland Economic Survey 2018, there is scope to further broaden the tax base and improve the efficiency of the tax system by moving from five different VAT rates to three. One aspect of this reform would be moving all items that are currently taxed at the zero rate to a VAT rate of 5%. As the zero rate is currently applied to many necessities (i.e. most food, books, children’s clothes and shoes, oral medicines), such a move would likely have adverse consequences for low-income households. With this in mind, part of the revenues raised from the reform should be used for targeted transfers to those on low incomes. Overall, a reform package that involved streamlining the VAT rates at the same time as increasing transfers to low-income households could improve the efficiency of the tax and transfer system and raise around 0.5% of GDP in government revenue (Table 1.6).
Ireland also relies relatively little on some other efficient tax sources, such as recurrent taxes on immovable property (Figure 1.19). Such taxes are less distortionary than taxes on income because they have less of an impact on decisions to supply labour, invest in human capital and other assets, produce and innovate (Johansson et al., 2008). As emphasised in the 2018 OECD Ireland Economic Survey, there is scope to increase revenues from recurrent property taxation by more regularly updating market values. However, since then, the authorities have delayed the revaluation of the properties that are the basis of the local property tax until 2020. This follows an earlier delay of the revaluation from 2016 to 2019. For most properties, taxes are being paid on their 2013 value or not at all (if built since 2013). Given steady increases in house prices, households in some locations would face a steep hike in property tax liabilities if the base were updated to the 2019 market value. To ensure a measure of stability in local property tax bills and protect the revenue source, an interdepartmental group has recently proposed several alternative methods for the revaluation.
Source: OECD Revenue Statistics database.
Going forward, more regular revaluations of the local property tax base are essential. These should continue to be calculated on lagged valuations of dwelling prices to minimise the pro-cyclicality of the revenue source. More regular revaluations will help achieve the objective of minimising large and unexpected adjustments in the property tax liabilities of households. The fact that a higher tax rate is currently applied to properties valued at above €1 million and that the steepest rise in property values since 2013 has been in Dublin (a comparatively high-income area) suggests that a revaluation is unlikely to worsen aggregate income inequality. Nevertheless, harmful distributional consequences of changes in property tax liabilities should continue to be monitored. As further discussed in Chapter 2, the authorities may also consider replacing some of the current array of property taxes, such as stamp duty, with a recurrent land tax levied on site value. This could be done in a revenue-neutral way, but would encourage more efficient land use at the same time as having much less distortionary impact on the investment decisions of households and businesses (Blöchliger, 2015).
Environmentally-related taxes also need to be increased in order to reduce the damage that households and businesses do to the natural environment. Ireland will not achieve its targeted reductions in greenhouse gas emissions by 2020 or 2030, based on current policy settings. Environment-related taxation remains low compared with the average OECD country and less than half of Ireland’s energy-related CO2 emissions are priced above €30 per tonne, a low-end estimate of climate-related cost (Figure 1.20). The Irish government has expressed a deep commitment to decarbonisation and a Climate Action Plan has been published. Therein, it proposed that the carbon tax be raised from €20 per tonne of CO2 to €80 by 2030. The first step in this process was taken in Budget 2020, with the carbon tax raised to €26 per tonne of CO2 on petrol and diesel (its implementation for other fuels is being delayed until May 2020, after the winter heating season). Sustained action needs to be taken to achieve this policy adjustment, by increasing the carbon tax each year according to a schedule that is well communicated to households and businesses.
Distributional and poverty effects should be considered in designing a policy package that allows for steady upward adjustments in the carbon tax. Recent simulation results suggest that an increase in the carbon tax to €30 per tonne of CO2 would induce a 4% decline in emissions (Tovar Reaños and Lynch, 2019). However, the policy change is found to be regressive, as energy expenditure makes up a relatively large share of the expenditure bundle of poorer households. According to the simulations, such distributional consequences could be entirely unwound by recycling some of the increase in carbon tax revenues in the form of a targeted transfer to poorer households through the social welfare system. Nevertheless, such transfers should be thoughtfully designed to avoid disincentivising work. In increasing the carbon tax in Budget 2020, three different uses for the revenues were identified by the Minister of Public Expenditure and Reform: i) support for low-income families through an increase in the winter fuel allowance and energy efficiency upgrades for households at risk of energy poverty; ii) energy efficiency upgrades and new transition programmes for the Midlands region, which has seen job losses in the peat harvesting industry owing partly to government commitments to scale back peat burning in power stations; iii) measures to promote behavioural change such as investment in cycling projects and electric vehicle infrastructure.
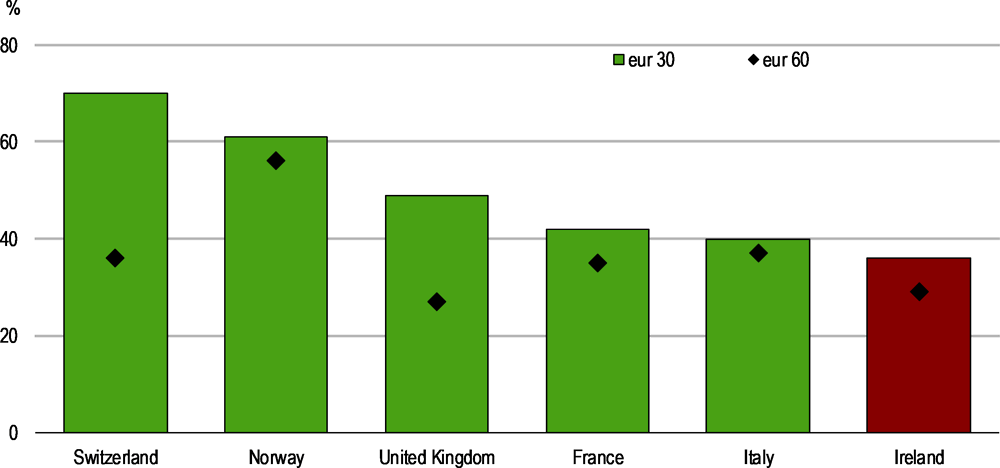
Source: OECD.
Recent experience from other OECD countries may be useful as the authorities consider how to offset any regressive effects of future increases in the carbon tax. Simulations for Germany suggest that using two thirds of a carbon tax on transport and heating fuels for per capita lump-sum transfers would avoid making large groups of households worse off and would make most families as well as low-income households with relatively low per capita energy consumption better off (Bach et al., 2019). It may also be prudent to distribute such a payment ahead of the tax taking effect in order to help garner public support. An example of successful implementation of a carbon tax is British Columbia in Canada, which redistributed the revenues from the tax to households through tax reform. At the federal level, Canada has also used per capita lump sum transfers as well as transfers that vary depending on the remoteness of a household location. Location-contingent transfers could help reduce financial pressure on car-dependent households. Such transfers could be temporary and need not influence incentives if related to location at the time of introduction of the tax.
At the same time, other aspects of tax policy can be reformed to better deter environmentally damaging activities. The revenues derived from such adjustments can be used to undertake new green projects, to reduce other forms of taxation or to lower the government’s outstanding debt burden. Synthetic fertilisers are currently at the zero VAT rate, despite the negative environmental consequences of their use including soil and water pollution. With the broader reform of the VAT system recommended above, such fertilisers should eventually be moved to, at least, the standard VAT rate.
Table 1.6 presents estimates of the fiscal effects of some of the recommended reforms. The quantification is merely indicative and does not allow for behavioural responses or the impact of the tax and spending measures on GDP growth. Table 1.7 quantifies the impact on growth of some of the reforms recommended in this Survey (quantification is not feasible for all of them).
There is also a need for new policy settings that reduce road congestion. Dublin was the third most congested OECD city in 2018, behind Istanbul and Mexico City, according to the Tom Tom Traffic Index. In this context, the government should consider introducing congestion charging to incentivise avoiding trips at busy times and greater use of public transport. Nevertheless, before implementing such a policy, it is important to ensure adequate availability of alternative modes of transport to accommodate those switching away from motor vehicle travel. As part of the National Development Plan 2018-2027, the authorities prioritised new train infrastructure (e.g. the Metro link and DART expansion in Dublin), an overhaul of the bus system in Ireland’s cities and the expansion of cycling and walking infrastructure. At the same time, new modes of shared transport should be actively promoted (International Transport Forum, 2018; Chapter 2) and demand-management tools such as greater restrictions on parking should continue to be pursued. Along with congestion charging, distance-based charges for motor vehicles may need to be considered in the future to offset a depletion in government revenues as the car fleet moves further towards electric vehicles that pay no fuel excise tax.
copy the linklink copied!Medium-term policy challenges
Looking ahead, there is a risk that capacity constraints are exacerbated by demographic pressures (Figure 1.21). The population is expected to grow by one quarter and the old age dependency ratio will more than double by 2050.
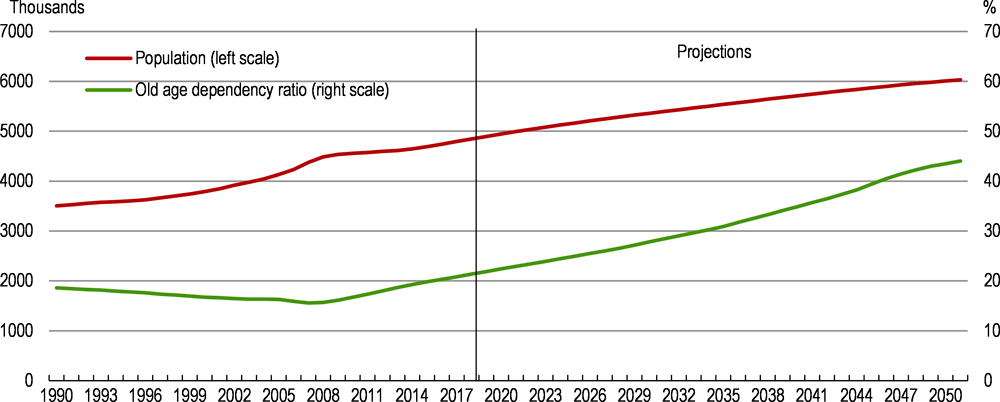
Note: Projections are based on a central scenario assumption for migration and fertility.
Source: CSO.
To meet this challenge, the supply side of the economy will need to continue to evolve. The labour force participation rate has fallen over the past decade as the population has begun to age and more young people have chosen to stay in education (Figure 1.22, Panel A). Ensuring that those that who wish to work are supported in doing so will be important over the coming years to promote both the inclusiveness and the competitiveness of the economy. This will require maintaining a health system that supports employment later in life.
Note: In Panel A, the labour force participation rate of the population is calculated as a four-quarter average and is based on the population aged over 15. In Panel B, data are for those firms in contact with the enterprise agencies of the Department of Business, Enterprise and Innovation.
Source: CSO, Department of Business, Enterprise and Innovation.
Improving the efficiency of production processes will also be key. The 2018 OECD Economic Survey of Ireland focused on supply-side issues stemming from the weak productivity growth of locally-owned enterprises (Figure 1.22, Panel B). The large productivity gap between foreign-owned and locally-owned enterprises has translated into wage differentials between the two types of firms, contributing to Ireland’s high level of market income inequality (Figure 1.1, further above). As such, boosting productivity in local businesses should also benefit inclusiveness. One area where government can support productivity is by ensuring institutional arrangements prevent and sanction economic crimes. Concurrently, an expanding economy and population will need to use natural resources more efficiently. This is particularly the case given the increasing risk of severe and irreversible impacts stemming from climate change.
Better utilisation of the labour force to help alleviate capacity constraints
Future Jobs Ireland, the medium-term economic development strategy, sets a target of raising the labour force participation rates of those aged between 25 and 69 from 74.8% in 2018 to 78% by 2025 (Department of Business, Enterprise and Innovation, 2019). To achieve this, a dramatic increase in the labour force participation of some cohorts will be required, notably women and older workers. For example, the illustrative scenario outlined in Figure 1.23 (“higher participation”) would put the labour force participation rate on a path to allow the 2025 target to be achieved. Under this illustrative path, the gender participation gap for those aged between 25 and 64 (currently at 13.6%) would need to be closed by 2040 and the participation rate of those aged 65-69 to rise from the currently observed 23.3% to 55.3% by 2050.
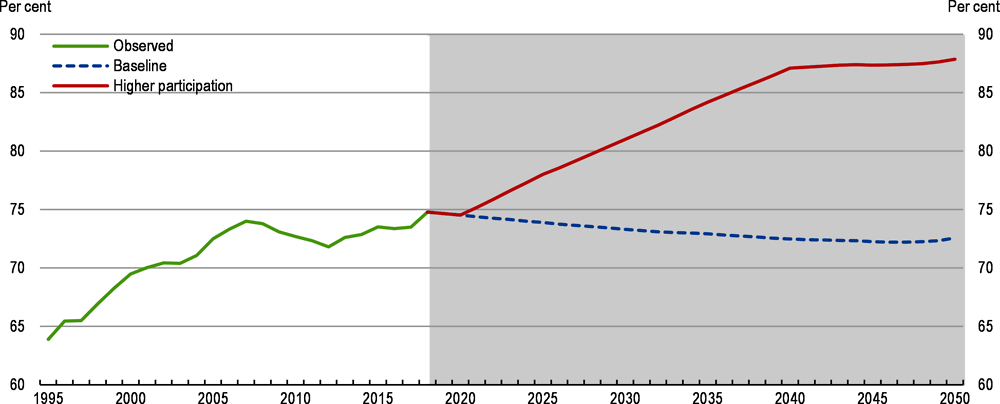
Note: “Baseline” assumes that the labour force participation rates for both genders and all five-year age groups remain at their levels of 2018. “Higher participation” assumes the participation rates for each gender and age group as follows: the rates of men in each five-year age group between 25-29 and 45-49 increase to the levels prior to the crisis (averages over 2000-07) by 2025; the rates for men in five-year age groups of 50-54, 55-59 and 60-64 converge to that of the 45-49 age group by 2030, 2035 and 2040, respectively; the participation rates for men and women in age groups of 65-69 and 70-74 converge to the averages of the top third of OECD countries by 2035 and continue to rise at the same pace through 2050; the participation rates for women in each age group between 25-29 and 60-64 converge to those for men by 2040
Source: OECD Labour Force Statistics; Central Statistics Office, Population & Labour Force Projections; OECD calculations.
Reducing labour underutilisation and the pool of long-term unemployed
As identified in the recent OECD Jobs Strategy, Ireland’s labour underutilisation rate, which includes those in the population who do not participate, is higher than the OECD average (Figure 1.24; OECD, 2018b). This reflects underemployment for the young and other groups, including women with children, older workers and the disabled. A policy priority is expanding the quantity of high-quality jobs in a way that improves labour market inclusiveness. Product market reforms that reduce barriers to entry for new firms, promote the expansion of high-performing firms and the orderly exit of those that underperform will be important for promoting new high-quality jobs (see Chapter 2).
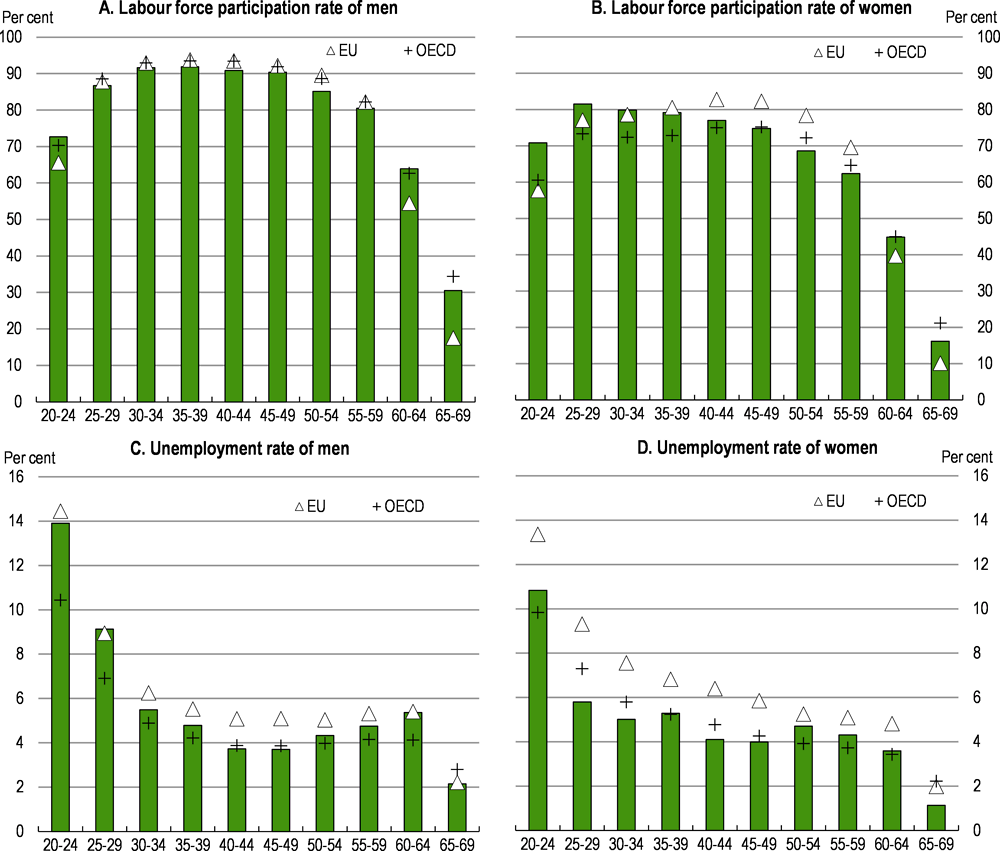
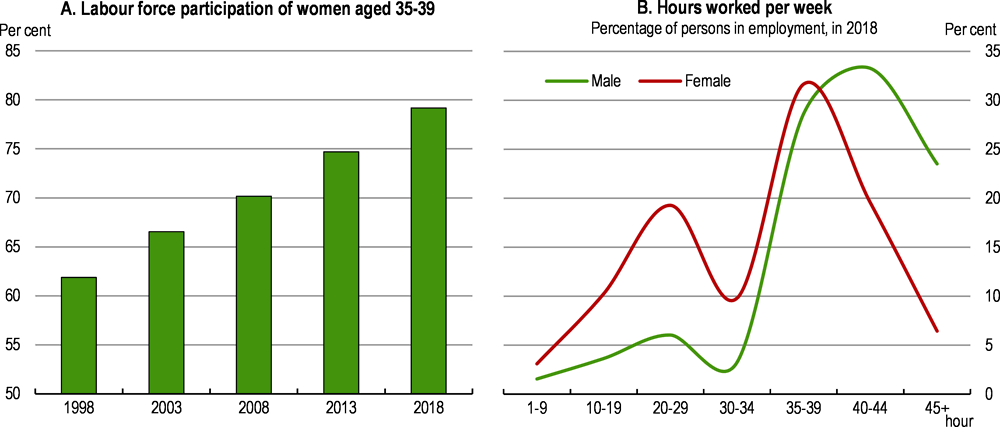
While labour force participation of men matches the OECD and the EU averages, that of women is lower than the EU average for those between the ages of 40 and 59 (Figure 1.25, Panel A and B). In Ireland, caring responsibilities tend to fall on women: the gender gap in unpaid work hours is one of the highest in Europe (Russell et al., 2019). While young women’s participation rates have risen as public spending on family benefits increased from 2.3% of modified gross national income in 2000 to 3.6% in 2015, the current middle-aged female cohorts aged 40 to 59 had lower participation profiles when they were 35 to 39. Such women are also more often responsible for adult care than men or those females in younger age cohorts (Russell et al., 2019).
Reducing barriers to high-quality jobs for cohorts with low participation and employment rates, in particular middle-aged women, requires significant investment in job training. Springboard+, a labour market activation and upskilling and reskilling programme, provides a number of courses for those returning to work, including women re-entering the workforce after a period of childcare. In addition, “Women ReBOOT”, an enterprise-led initiative co-funded by Skillnet Ireland, the national agency for workforce learning, supports inactive women through coaching, work placements and skills development to re-enter the technology sector after a career break. While achieving a high conversion rate to employment of 85%, participation in the programme has been limited to just over 100 women since 2017 (Government of Ireland, 2019b). The authorities should consider scaling up the programme, given the evidence of positive employment outcomes.
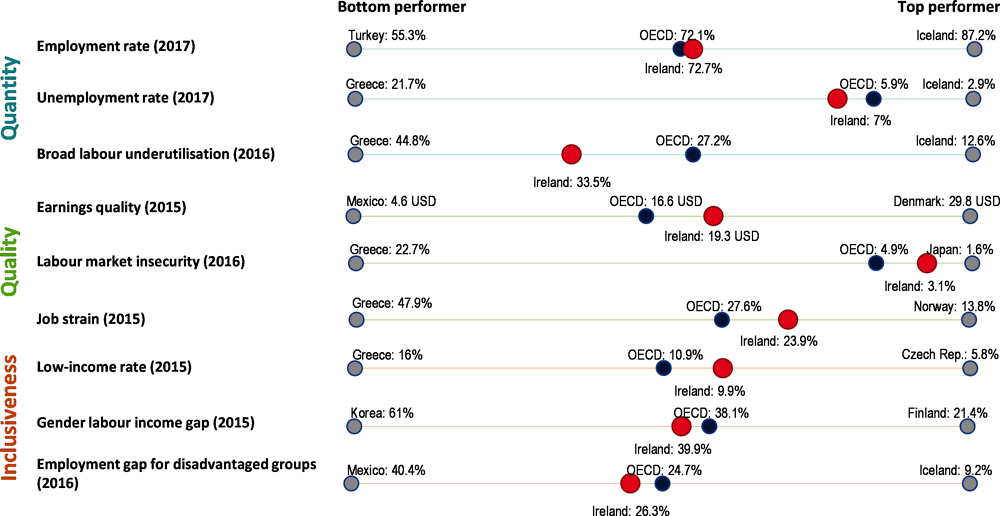
Note: Broad labour underutilisation: share of inactive, unemployed or involuntary part-timers (15-64) in population (%), excluding youth (15-29) in education and not in employment (%). Earnings quality: gross hourly earnings in USD adjusted for inequality. Labour market insecurity: expected monetary loss associated with the risk of becoming unemployed as a share of previous earnings. Job strain: percentage of workers in jobs with a combination of high job demands and few job resources to meet those demands. Low-income rate: share of working-age persons living with less than 50% of median equivalised household disposable income. Gender labour income gap: difference between per capita annual earnings of men and women (% of per capita earnings of men). Employment gap for disadvantaged groups: average difference in the prime-age men's employment rate and the rates for five disadvantaged groups (mothers with children, youth who are not in full-time education or training, workers aged 55-64, non-natives, and persons with disabilities; % of the prime-age men's rate). It should be noted that Ireland-specific statistics published by Ireland’s Central Statistics Office indicate that the unemployment rate fell to 5.8% in 2018, while the employment rate moved down to 68.7%.
Source: OECD Jobs Strategy dashboard.
Policymakers should also seek to reduce any impediments for women who wish to work longer hours: more than 30% of women work less than 30 hours per week, a significantly higher proportion than for men (Figure 1.26, Panel B). The government introduced financial supports for working families in recent years, with measures such as increased earnings thresholds for the removal of welfare benefits (Table 1.8). Further building up the capacity of formal long-term care arrangements will also support women undertaking unpaid adult care for long-term care dependent relatives if they wish to increase paid work.
Source: OECD Labour Force Statistics database.
While a decade of increases in public spending have made childcare benefits comparable to other OECD countries, increasing fees by childcare providers have partially offset the increase in benefits to leave net childcare costs significantly higher (Table 1.9). A recent empirical study found a negative link between childcare costs and the employment of Irish females: 10% higher childcare costs were associated with half an hour less paid work by mothers per week (Russel, et al., 2018). In 2017, the enrolment rate of early childhood education and care for children aged 0-2 was 7.8%, well below the OECD average of 26.3%, while full enrolment was almost achieved for those aged 3-5 with the rate at 98.4% (OECD, 2019c). The government launched the new National Childcare Scheme in November 2019, shifting away from childcare benefits as social protection entitlements towards a comprehensive and progressive system of universal and income-based benefits. Budget 2019 adjusted the originally planned income thresholds so that more middle and higher income households can now access the benefits, while those below the relative poverty line benefit from the very highest subsidy rates under the scheme. The new programme should be accompanied by significant measures to expand quality childcare capacity. For example, the authorities are currently considering permitting National Childcare Scheme subsidies to be used for childminding services (non-relative care of children within the childminder’s family setting). Although this may improve access and affordability to childcare, expanding the use of such services should be coupled with appropriate regulation, as well as training and supports for the providers that improve service quality (Government of Ireland, 2019c).
Source: OECD Labour Force Statistics database; CSO, Labour Force Survey.
Across age cohorts, labour force participation drops considerably between 55-59 and 60-64 for both men and women (Figure 1.25, Panel A and B). This pattern is also observed in other OECD countries, but Ireland’s participation rate for those in the 65-69 age group is below the OECD average, despite longer life expectancy. The effective retirement age for men currently matches the public pension eligibility age of 66, but that for women is 64.2, falling short of it. Retaining older workers in the labour market is essential for their income security, given that the pension eligibility age is set to increase to 67 in 2021 and 68 in 2028. Promoting employment of the elderly also has significant macroeconomic implications (see above). As both skills and physical capacity can deteriorate with age, providing effective life-long job training opportunities as well as more flexible work arrangements are key for enabling a longer work life.
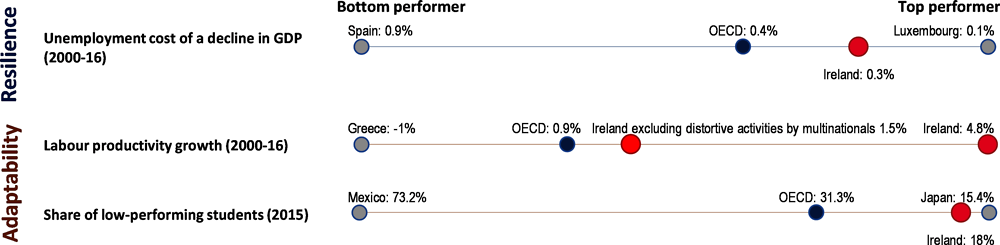
Note: Resilience: average increase in unemployment rate over 3 years after a negative shock to GDP of 1% (2000-16); Labour productivity growth: annual average productivity growth (2010-16), measured in per worker terms. Share of low-performing students: % share of 15-year-olds not in secondary school or scoring below Level 2 in PISA (2015). Labour productivity of Ireland excluding distortive activities by multinationals are calculated based on the ratio between GDP and modified domestic demand published by the Central Statistics Office, which excludes the impact of trade in aircraft by aircraft leasing companies and trade in R&D service imports and intellectual property.
Source: OECD, OECD Jobs Strategy dashboard; Central Statistics Office; OECD calculations.
Focusing on those that are unemployed, the aggregate unemployment rate has now declined to near pre-crisis levels, though outcomes vary depending on the worker cohort. Unemployment remains high among younger men, while it is low for women relative to other EU countries across all age cohorts (Figure 1.25, Panel C and D). This largely stems from young men’s employment being concentrated in sectors hit hardest by the crisis, notably construction.
The high share of long-term unemployment also remains a source of concern, as long spells out of employment can deprive workers of their skills and make reintegration to employment more difficult. Although the share of those unemployed for one year and over fell to 40.8% in 2018, it remained well above the OECD average and the share of long-term unemployed prior to the crisis (Figure 1.28, Panel A). In addition, the share of those unemployed for four years and over among the long-term unemployed rose from 23.8% to 43.8% between 2012 and 2016 (Bergin and Kelly, 2018). While the share of long-term unemployment continued to fall in 2019 towards the level observed before the crisis, labour market programmes should continue to focus on further reducing the share of long-term unemployment.
Compared to the OECD average, labour market programmes in Ireland focus more on out-of-work income maintenance (Figure 1.28, Panel B). This protects the unemployed from falling into poverty, but benefits must be designed in a way so as not to disincentivise taking up a job (OECD 2018b). The policy mix could be shifted to better encourage the unemployed to return to work quickly, through strengthening the emphasis on employment incentives and spending on training programmes, which is below the OECD average on a per participant basis (see Chapter 2). In 2012, the Public Employment Service (PES) of Ireland introduced a one-stop-shop service named Intreo, which tailors all employment and income supports for individual jobseekers. An evaluation of the Intreo model in the early years of its operation found no substantial impact of the reform on the probability of a jobseeker entering an education, training or employment placement course (Kelly et al., 2019). It noted that the reform focused on streamlining the activation process instead of adjusting the active labour market programmes provided. Going forward, ongoing assessment of the effectiveness of the activation approach, given the changing characteristics of jobseekers, is necessary. This is likely to require additional data collection efforts (Lavelle and Callaghan, 2018; Chapter 2). The activation programmes should also focus on building the work skills of disabled workers, given that only 30% of disabled workers were at work in 2011, implying a 31-percentage point gap with those without disabilities, the fourth largest in the EU (Watson et al., 2017).
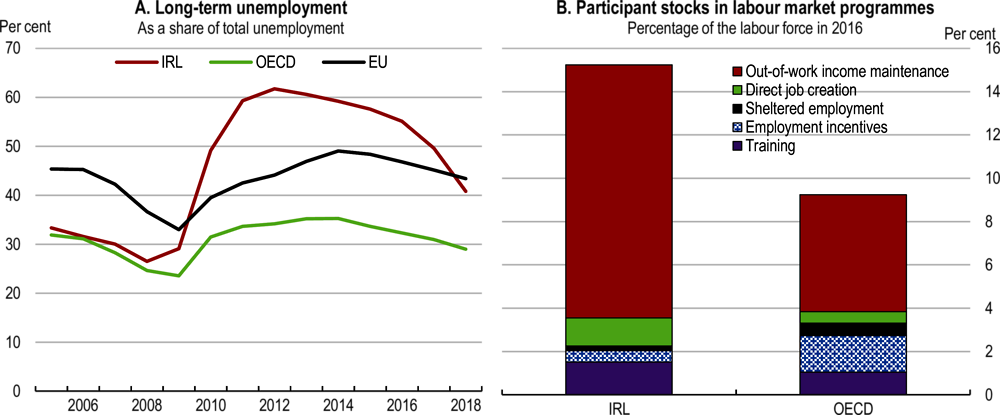
Note: In Panel A, long-term unemployment refers to unemployment for one year and over. It should be noted that Ireland-specific statistics published by Ireland’s Central Statistics Office show that the proportion of those unemployed for one year and over was 36.3% in 2018. In Panel B, out-of-work income maintenance includes early retirement programmes and employment incentives includes start-up incentives.
Source: OECD Labour Force Statistics database; OECD Public Expenditure and Participant Stocks on LMP dataset.
The adult learning system is key for adapting to technological and demographic changes
The Irish labour market has exhibited flexibility in adjusting to ongoing structural changes and economic shocks. This has served Ireland well as it has deepened its integration into the global economy and as new technologies have been increasingly adopted by the business sector (Chapter 2). Labour productivity has risen, especially in multinational firms, though this has largely reflected capital deepening instead of improvements in efficiency.
Looking ahead, accelerating technological advances can facilitate the creation of new products and open up the markets for new types of equipment and skills. Broad technological diffusion that raises productivity will lead to lower retail prices, boosting aggregate demand. This has the potential to create an array of new jobs. Nevertheless, such advances may also be accompanied by some workers’ skills becoming obsolete at a quickening pace, leaving them trapped in low-quality jobs or joblessness. The challenge is intensified by simultaneous population ageing, which potentially marginalises a large number of older workers unless well-designed reskilling programmes exist. To make the most of technological and demographic changes, it is a priority to further strengthen the adaptability of the labour market by providing continuous opportunities to develop, maintain and upgrade skills through learning and training at all ages.
Upskilling or reskilling of workers is indeed becoming a serious challenge. Despite faster improvement of formal education qualifications, measures of the skills of Irish adults are below the OECD average. While the share of the population with university or equivalent level education was close to the OECD average for those aged between 55 and 64, it reached 53.5% for those aged between 25 and 34, well above the OECD average of 44.1% in 2017 (Figure 1.29, Panel A). Nevertheless, measured literacy skills of Irish adults remained close to the OECD average, and numeracy and problem-solving skills were significantly lower for all age cohorts (Figure 1.29, Panel B, C and D).
The sluggish growth of skill supply has contributed to skill shortages. In 2016, 29.5% of total jobs were being performed by underqualified workers, the highest in the OECD, and 14.6% by overqualified workers, below the 16.8% OECD average (Figure 1.30). According to a recent business survey, 76% of Irish firms reported the lack of staff with the right skills as a major obstacle to investment, following uncertainty about the future, which was cited by 79% of them (European Investment Bank, 2019). As skills decline with age, developing an effective adult learning system is key for enabling individuals to keep their skills continuously updated to stay employed or to allow them to transition to new jobs (see Chapter 2). Financial arrangements for training programmes are particularly important for adult learning in Ireland. Public spending on training per participant, firms’ investment in non-formal training as a share of gross value added and provision of employer-sponsored training are currently below the OECD average. Business contributions to the National Training Fund should be accompanied by a cost-reimbursement scheme that allows firms to claim back expenses for the training costs they incur, contingent on such training programmes being aligned with the identified skill priorities of the National Training Fund. Furthermore, the government should strive for a better mix of financial incentives for gaining new skills by considering measures including: i) a further shift of active labour market policies toward training, ii) the introduction of paid training leave and iii) the provision of preferential loans to individuals for training.
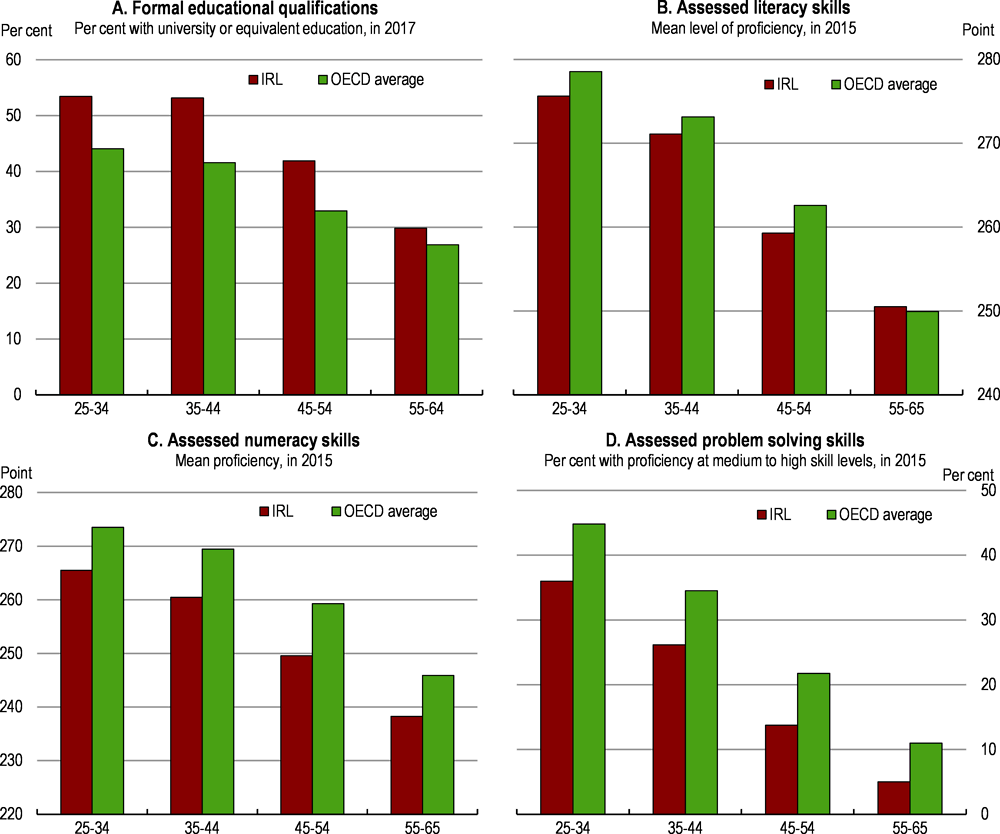
Source: OECD Educational Attainment dataset; OECD Survey of Adult Skills (PIAAC).
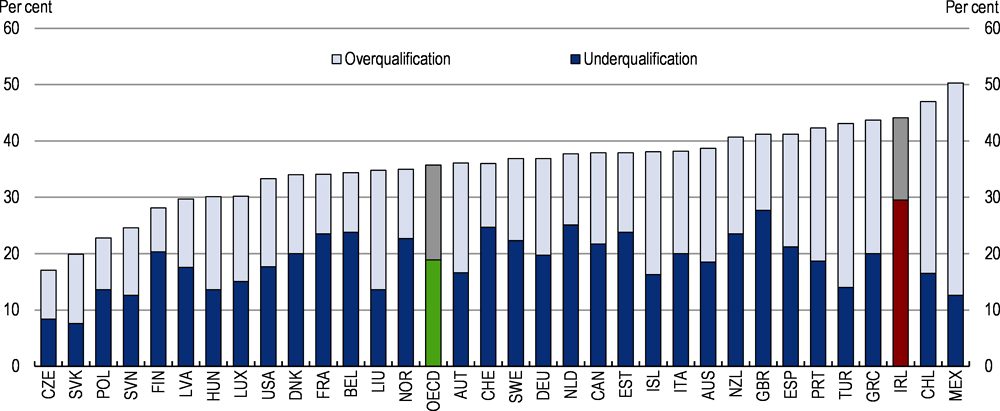
Source: OECD (2017), Getting Skills Right, OECD Skills for Jobs Indicators.
The ageing population requires a well-functioning health system
Health outcomes have improved at high cost and with low satisfaction
Life expectancy in Ireland has increased more rapidly and is now higher than in the average OECD country. This is undoubtedly positive for the Irish population. To ensure that these extra years of life are lived in the best health possible, improvements to the functioning and financial sustainability of the health and long-term care systems should continue to be a focus. Doing so will promote both labour market participation and Irish living standards in the years ahead.
In 2017, 83.2% of Irish adults reported that their health conditions were "good" or "very good", the fifth highest in the OECD area. However, relatively good health outcomes have been sustained at a higher financial cost than in many other OECD countries. Health spending per capita was USD 4 915 in 2018, higher than the USD 3 992 OECD average, despite Ireland’s comparably young population. The absence of universal coverage for primary care and a symbiotic relationship between public and private care systems mean that private expenditure plays a substantial role in system funding. Despite high health spending per capita, doctor consultations are less frequent and there is less hospital inpatient activity than the OECD average. While some of this may be related to the health status of the population and gaps in coverage, it also reflects capacity constraints: doctors and hospital beds per capita are below the OECD averages, with hospitals operating near full capacity (Table 1.10). These constraints are also reflected in lengthy waiting times for medical procedures, contributing to low patient satisfaction (Figure 1.31).
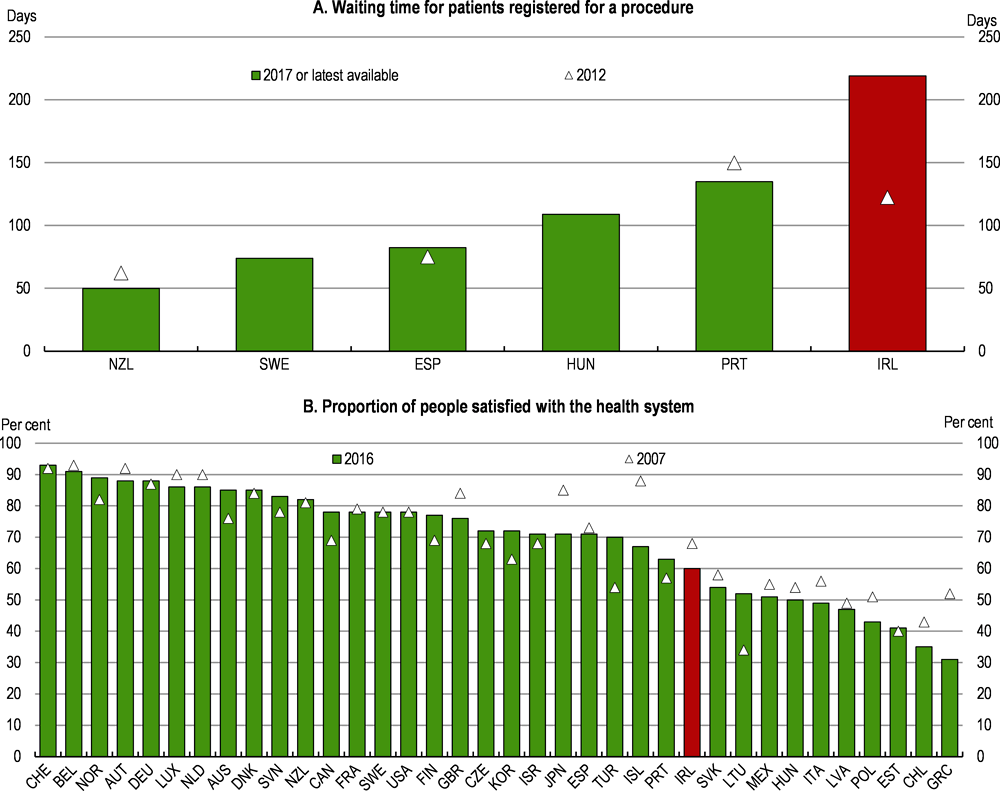
Note: Panel A shows average waiting time across cataract surgery, coronary bypass, prostatectomy, hysterectomy, hip replacement and knee replacement. Data for New Zealand are as of 2016. Data for Hungary and Sweden for 2012 are not available.
Source: OECD, OECD Health Statistics 2019; OECD Government at a Glance 2017.
Universal access to a comprehensive range of care is key to developing a more efficient health system
Ireland is the only Western European country that does not provide universal coverage for primary healthcare. Low-income residents or those with certain medical conditions are eligible for a Medical Card which provides free access to primary care and hospital services and medicines with limited co-payments. Some other population groups (10% of the population) have access to a GP Visit Card that covers general practitioner charges, but not the costs of medicines or hospital fees. However, more than half of the population pay out-of-pocket for a general practitioner visit (OECD and European Observatory on Health Systems and Policies, 2019). Gaps in public health coverage have resulted in high rates of private health insurance coverage (45% in 2017), which allows patients to bypass long waiting lists in the public system and gain faster access to hospital care and diagnostics (OECD and European Observatory on Health Systems and Policies, 2019). Medical consultants have an incentive to prioritise private patients, as they are often paid on a fee-for-service basis for private care, while being contracted to care for public patients on a salaried basis. The current system means that health costs can be prohibitively high for a group of the population with earnings that are below average but who are not eligible for free medical services. The prioritisation of private patients within the system raises serious equity concerns.
Limited access to primary care can lead to poor disease management, which exacerbates treatment costs and congestion of hospitals. Indeed, many hospitalisations in Ireland are avoidable, given the high hospital admission rate for chronic obstructive pulmonary disease and asthma, which could be effectively managed in primary care settings. The admission rate for these chronic conditions in 2015 was 329 per 10 000 population, among the highest in the OECD and the second highest in the EU. The GP contract in 2019 addressed this problem by including provisions for prime care chronic disease management. Nevertheless, primary care infrastructure is still under development.
In recognition of these challenges, a cross-party parliamentary committee published the Sláintecare report in 2017, which provided a roadmap to develop a patient-centred universal single-tier health and social care system over the next decade. Some of the key recommendations included: i) significant expansion of community and hospital care capacity; ii) universal access to a comprehensive range of health services at no or reduced cost; and iii) phased elimination of private care from public hospitals. It aims to shift care out of hospitals into primary and community settings, while envisaging waiting time guarantees of less than 12 weeks for an inpatient procedure, 10 weeks for an outpatient appointment and 10 days for a diagnostic test. The permanent increase of public spending to implement the reforms was estimated at €2.8 billion over ten years, which would be covered by a single national health fund based on general taxation with some earmarked funding. Besides the permanent increase, the Sláintecare Report recommended one-off spending of €3 billion to develop health infrastructure, digitalisation (“e-health”) and expansion of training capacity for health professionals.
The authorities subsequently launched the Sláintecare Implementation Strategy in 2018, which set out a three-year implementation plan for some elements of the report and a ten-year strategic direction. The first three-year implementation strategy focused on improving the governance framework of the health system, preparing a masterplan for new models of care and setting up a transition fund. In April 2019, the authorities launched the Sláintecare Integration Fund with €20 million designated for 122 projects to develop local community and primary care systems. It has also committed to increasing the number of community care staff through the establishment of the Sláintecare Enhanced Community Fund, which was allocated €10 million in Budget 2020. Nevertheless, further strengthening primary and long-term care is rightly identified as a priority. It is projected that demand for home help and for places in residential care homes will increase by more than 50% by 2030 (Wren et al., 2017). Already, Ireland is experiencing a high rate of unmet needs for home care relative to other comparable European countries (Privalko et al. 2019).
While the Sláintecare implementation plan is an essential first step, the upcoming implementation strategy should ensure that the reform will be implemented without delay, by articulating a sequence of changes that put the new system in operation and lay out concrete measures to finance the additional spending. Given the sizeable permanent increase of public spending that will be required, the plan should be accompanied by a deliberate increase of stable tax revenue sources, such as the VAT, as well as new measures to enhance spending efficiency (see above).
There remains ample scope for containing pharmaceutical spending
Pharmaceutical spending accounts for a substantial part of healthcare costs in Ireland. In 2017, pharmaceutical spending per capita was USD 599, higher than the USD 564 OECD average. Greater use of generic drugs is key to contain pharmaceutical costs. The Health (Pricing and Supply of Medical Goods) Act 2013 introduced reference prices, which sets a common reimbursement price for a group of interchangeable drugs. Following the legislation, the share of generic drugs in the pharmaceutical market rose from 29% to 40% in volume terms by 2017.
Even so, the share of generic drugs remains much lower than in many other OECD countries (Figure 1.32). Facilitating competition in the off-patent drug market would boost penetration of generics and further cost savings. In particular, the re-reference periods for many drugs spans several years in Ireland, contrary to the standard practice of biannual reviews in many other EU countries. Infrequent reviews on reference prices can lead to overly high reimbursement rates if there has been a reduction in the market price of a pharmaceutical product. The lowest price in the group of interchangeable drugs should be identified through more frequent reviews, like in the Netherlands, and serve as a benchmark for the maximum reimbursement rate, taking into account, however, the need to ensure continuity of supply (Connors, 2017). In addition, the time span of initial reference pricing following patent expiration should be shortened. Policies related to pharmaceutical prescription should also promote generic uptake. Measures taken by other EU countries should be considered, including: i) incentives for doctors to prescribe generics through a pay-for-performance scheme; ii) prescription quotas for generics; and iii) mandatory prescription by non-proprietary names (i.e. ensuring that doctors prescribe by medical ingredients and not by brand names; OECD, 2018c).
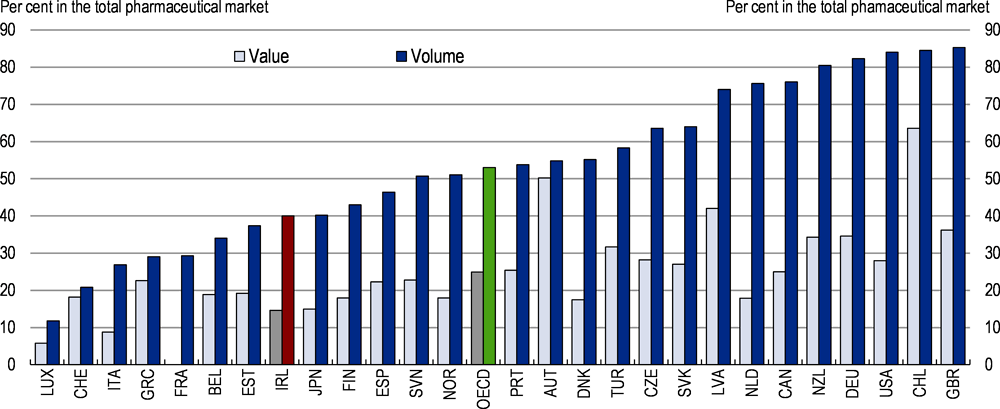
Note: Data include sales of medical non-durables. Reimbursed pharmaceutical markets are referred to for the United Kingdom, Germany, New Zealand, Austria, Spain, Ireland, Belgium, Greece and Luxemburg, while community pharmacy markets are referred to for Chile, the United States, Denmark, Slovenia, and Estonia. Data in value terms are not available for France.
Source: OECD, OECD Health Statistics 2019.
Combating corruption to enhance trust in economic transactions
Fighting corruption is important to prevent distortions in competition and the misallocation of resources, while fostering trust in economic transactions. The 2018 OECD Economic Survey of Ireland highlighted that, abstracting from the activities of multinational enterprises, the efficiency of resource allocation in Ireland is relatively low. Poor resource allocation reduces aggregate productivity growth and hampers the capacity of the economy to accommodate the new demands of a growing population.
Indicators of control and perceived risks of corruption suggest that Ireland ranks in the middle of the OECD but performs poorly compared with many Northern European OECD countries and small open OECD economies such as Canada and New Zealand (Figure 1.33, Panel A, B and C). Empirical evidence shows that companies from countries that are a party to the OECD Convention on Combating Bribery of Foreign Public Officials in International Business Transactions reduce investments in corrupt destinations (Blundell-Wignall and Roulet, 2017). Catching up to the best-performing small open OECD economies in control of corruption could have a positive impact on the Irish economy, including through maintaining Ireland’s attractiveness as a destination for foreign direct investment.
According to a survey by the European Commission, 68% of Irish citizens think that corruption is widespread, in line with the EU average (European Commission, 2017b). The survey also shows that 70% of Irish citizens think high-level corruption cases are not adequately pursued, which is also around the EU average. Although 89% of firms do not consider corruption to be a problem when doing business, the majority of them think that those who engage in corrupt practices are unlikely to be caught, charged, and heavily fined or imprisoned (European Commission, 2019b). Indeed, the anti-money-laundering regime exhibits weaknesses in enforcement of the law through investigation, prosecution and confiscation (Figure 1.34, Panel B). In recent years, Ireland has made progress in compliance with the recommendations of the Financial Action Task Force (Financial Action Task Force, 2019). The impact of these changes on the performance of the regime will be assessed in 2022.
Ireland has implemented several reforms following the 2017 White Collar Crime Package. These include the Criminal Justice (Corruption Offences) Act 2018, which consolidated and overhauled seven pieces of corruption-related legislation and introduced a number of new offences. In tandem, the Anti-Corruption Unit of the national police force (Garda Síochána) was established in 2017. While these strengthened the anti-corruption regime, further efforts should be made to effectively enforce the new law. For example, Ireland should take necessary steps to ensure that all relevant legal entities including unincorporated bodies such as branch companies and limited partnerships, which are not considered as legal persons under the 2018 Act, are liabile for the criminal offences (OECD, 2019d). In addition, there is scope to increase the resources allocated to the Garda Anti-Corruption Unit and for its corruption prevention mandate to be clarified. Furthermore, setting up an inter-agency body would help clarify role-sharing of relevant agencies and facilitate coordination of their corruption prevention efforts (United Nations, 2019).
Corporate governance should also be aligned with the strengthened anti-corruption regime. A survey showed that 40% of Irish corporate executives and board members have limited or no working knowledge of bribery and corruption legislation, while only 18% see bribery and corruption as a key risk to their business (Deloitte, 2019). Ireland should update codes of conduct for a range of businesses and relevant professionals to promote development of effective internal control systems. In addition, an amendment to the whistleblower law in 2018 does not provide protection for whistleblowers who report corruption using trade secrets unless they prove that their disclosure was motivated by a general public concern. While the amendment was in response to the EU directive on the protection of trade secrets, Ireland is the only country that changed whistleblowing legislation in this way (Dell and McDevitt, 2018). The effect of the amendment should be closely monitored and adjusted if the heightened onus of proof is found to hamper whistleblowing.
Ireland should also step up efforts to tackle bribery by Irish companies and individuals in their foreign activities and by foreign companies operating in Ireland by strengthening the implementation of the OECD Anti-Bribery Convention. Ireland is considered to have particularly weak enforcement of the OECD Convention (Dell and McDevitt, 2018). International legal cooperation is indispensable for effectively controlling corruption related to foreign activities. In Ireland, mutual legal assistance is regulated by the Criminal Justice (Mutual Assistance) Act 2008, which is applicable to EU members and other States designated under the Act. The Act provides a basis for cooperation under a number of EU, Council of Europe and UN instruments. Cooperation with other countries requires designation of the countries under the Act. For example, while confiscation orders from EU countries are directly enforceable under the law, the government has discretion for those from other countries as to whether to make an application to the court (United Nations, 2019). Ireland should continue to extend mutual legal assistance with non-EU countries through designations under the law as well as treaties.
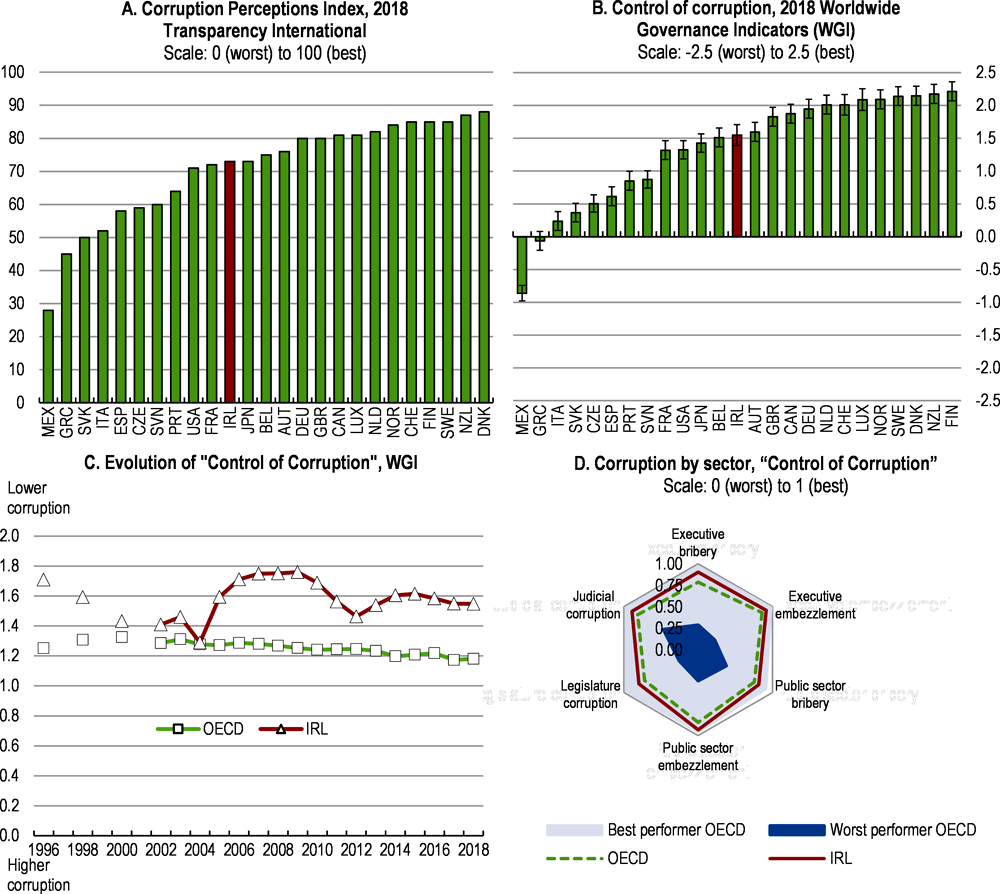
Note: Panel B shows the point estimate and the margin of error. Panel D shows sector-based subcomponents of the “Control of Corruption” indicator by the Varieties of Democracy Project.
Source: World Bank; Transparency International; Varieties of Democracy Institute; University of Gothenburg, and University of Notre Dame.
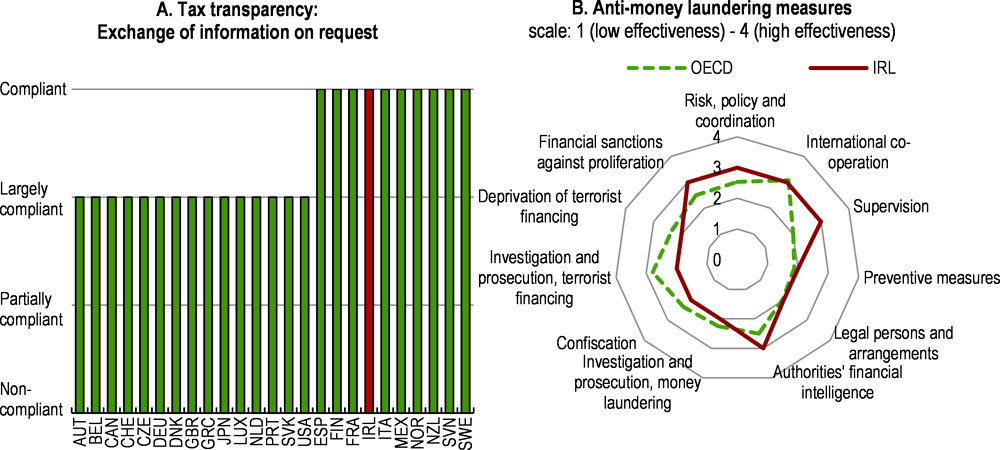
Note: Panel A summarises the overall assessment on the exchange of information in practice from peer reviews by the Global Forum on Transparency and Exchange of Information for Tax Purposes. Peer reviews assess member jurisdictions' ability to ensure the transparency of their legal entities and arrangements and to co-operate with other tax administrations in accordance with the internationally agreed standard. The figure shows first round results; a second round is ongoing. Panel B shows ratings from the FATF peer reviews of each member to assess levels of implementation of the FATF Recommendations. The ratings reflect the extent to which a country's measures are effective against 11 immediate outcomes.
Source: OECD Secretariat’s own calculation based on the materials from the Global Forum on Transparency and Exchange of Information for Tax Purposes, OECD, and Financial Action Task Force (FATF).
Further promoting environmentally sustainable growth
The expected growth in the Irish population will also put strains on the environment, unless the activities of the population adjust to use resources in a more efficient and environmentally-sustainable way. Some of these impacts may be local in nature, such as through the impact on air and water pollution, while others, including the emissions from greenhouse gas emissions, will have more global consequences. The Irish government has been targeting an 80% reduction in emissions of carbon dioxide in three key sectors (electricity generation, the built environment and transport) by 2050 relative to 1990 levels. However, it has also supported a more ambitious proposal at the EU level to target net zero emissions by 2050. In addition, in the agriculture, land use and forestry sectors, the aim has been to progress towards carbon neutrality without compromising sustainable food production.
Ireland has made progress in decoupling energy-related CO2 emissions from GDP over the past 15 years. Declining energy intensity and rising renewable energy production have contributed (Figure 1.35, Panel A). Nonetheless, non-CO2 greenhouse gas (GHG) emissions, mostly in agriculture, account for a third of total emissions and have been rising. Overall GHG emissions are 11% lower than in 2005 but have increased in recent years, notably in transport. Most Irish GHG emissions are not covered by the European Union’s emissions trading schemes, making national mitigation policies particularly important.
On current policies, Ireland will miss its target to reduce emissions outside the emissions trading schemes by 20% between 2005 and 2020 (Climate Change Advisory Council, 2019). It will also miss the 2030 target (a 30% decline from 2005 levels) by a wide margin. Ireland can purchase emissions allowances within the EU to make up for the shortfall. However, this would cost taxpayer money while only deferring abatement effort. Moreover deferring abatement effort risks raising costs, as long-lived infrastructure investment that is consistent with decarbonisation needs to be deployed as soon as possible. As argued by Ireland’s Climate Change Advisory Council (2019), overachieving the 2030 target would be appropriate to reach the 80% GHG emission reduction target by 2050 at lower cost.
The Irish government’s Climate Action Plan proposes sectoral emission targets as well as steps to reach the 2030 emissions target and prepare for net-zero emissions in 2050. It includes a stronger climate policy governance framework with an independent Climate Action Council which would propose five-year carbon budgets and monitor the actions to reach them. A similar framework has helped the United Kingdom sharply reduce emissions in electricity generation (OECD, 2019e). The Action Plan now needs to be followed by the continued implementation of steps to achieve emission reductions. As discussed earlier, there is a need for higher environmental levies to deter damaging activities. More ambitious policy to price emissions would also boost eco-innovation, which is weak (Figure 1.35, Panel D).
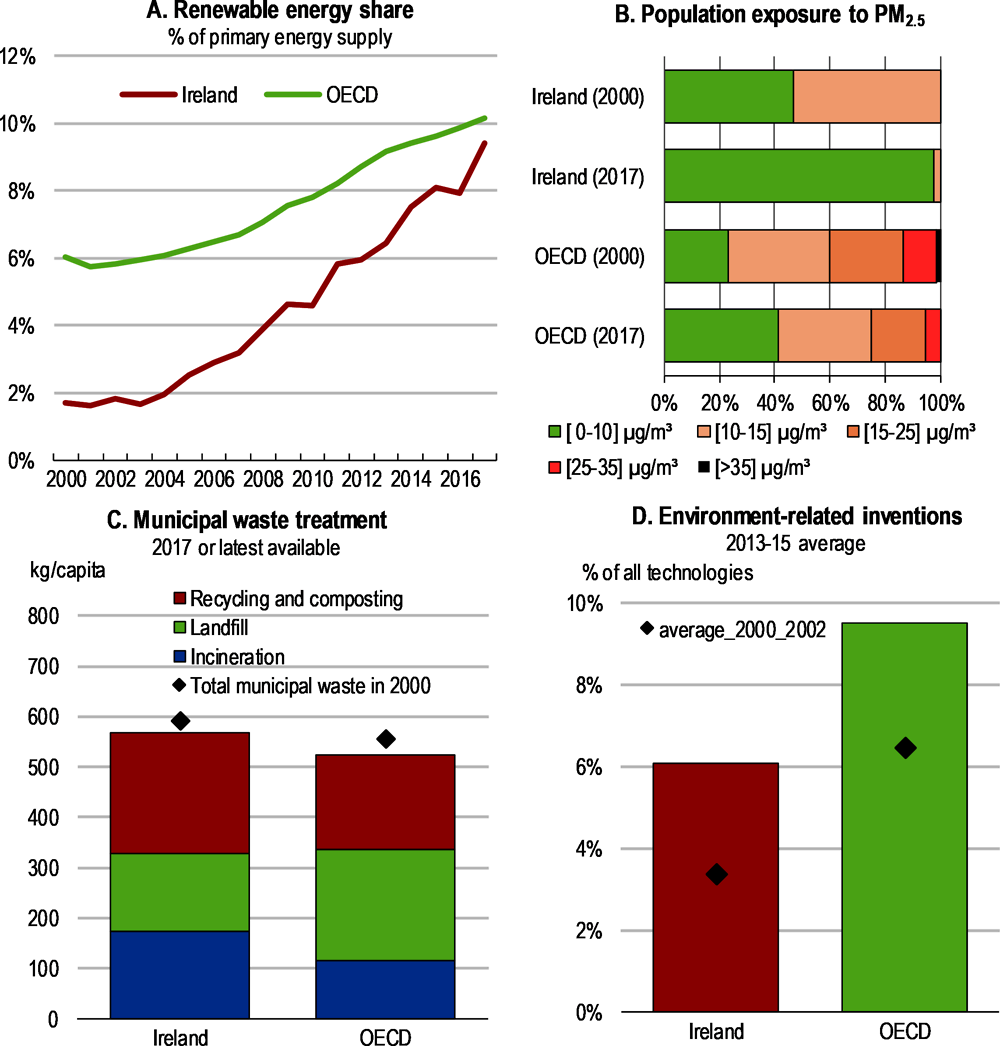
Source: OECD Green Growth Indicators database.
The agricultural sector is the largest single contributor to Ireland’s greenhouse gas emissions. This is a reflection of the relative size of the sector within the Irish economy, particularly intensive livestock production (Figure 1.36). Emissions in agriculture, mostly related to cattle, are not priced (Climate Change Advisory Council, 2019). Ireland could consider following New Zealand’s approach to pricing such emissions, which involves close consultation with farmers. In the New Zealand case, it is planned that biological emissions (i.e. those from methane and nitrous oxide) from agricultural activity will be included in the emissions trading scheme if insufficient progress in reducing emissions is made on a voluntary basis. Ireland should pursue full and early implementation of cost effective measures for abatement of agricultural emissions, taking into account the full costs and benefits (both private and public) of implementation. The mitigation measures outlined in its agricultural “Marginal Abatement Cost Curve” (Teagasc, 2018) should be a priority. These include afforestation, improvements in agricultural production efficiency, grassland and other soil management, as well as changes in fertilisation, energy efficiency and biomass use. If fully implemented, estimates suggest that these measures will reduce or absorb the equivalent of 37% of 2005 agricultural emissions by 2030.
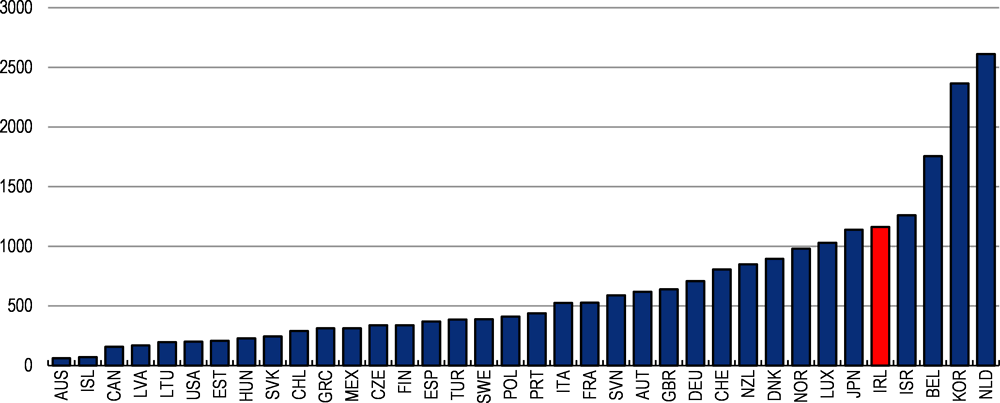
Note: Conversion coefficients used to convert livestock heads in sheep equivalent: 1 for sheep and goats, 6 for cattle and buffaloes, 4.8 for equines,1 for pigs, and 0.06 for poultry birds.
Source: OECD Agricultural Statistics database; FAOSTAT database.
Diversified uses of land can have both local and global environmental benefits, improving biodiversity, water quality, leisure, tourism services, as well as resilience to climate change (Climate Change Advisory Council, 2019). Upscaling afforestation should be prioritised in the near term to allow the full carbon storage potential of trees to be realised by 2050. It is not clear whether it is possible to achieve Ireland’s afforestation targets (22 million trees planted each year to 2040), particularly in the context of current government support for different land uses (including for agriculture) and the social factors which prevent the wider uptake of forestry. Public support to producers and the relative competitiveness of Irish dairy farming increases the value of farmland and thereby the cost of mitigation through diversified land use. Nonetheless, Ireland could reconsider the balance of support for different land uses to ensure it is supporting stated forestry and climate policy goals, notably by placing a greater emphasis on increasing the provision of environmental services such as carbon sequestration and prioritising measures that support water quality. The 2018 OECD Ireland Economic Survey highlighted many of the challenges for the latter, not least the need to continue investing in modern water infrastructure.
Further reductions in the emissions intensity of Irish buildings should also be pursued. Policies to lower energy demand are key, including those that encourage investment in energy efficiency improvements. The average Irish dwelling emits almost 60% more CO2 than the average EU dwelling (Sustainable Energy Authority of Ireland, 2018), partly because Ireland has a relatively high share of fossil fuels in residential heating (IEA, 2019). While the CO2 intensity of residential energy declined steadily between 1992 and 2013, there has been little progress since (Sustainable Energy Authority of Ireland, 2018).
The authorities have introduced regulations requiring all new buildings to install renewable energy systems and to become “nearly zero energy buildings”. Furthermore, homeowners carrying out major renovations or extensions are now required to ensure the entire dwelling meets a higher energy rating than was previously the case. Financial support for the installation of new oil or gas boilers has also been discontinued to avoid possible lock-in of high-carbon heating systems and local authorities are undertaking a programme of insulation retrofitting for the least energy efficient social homes.
As in most OECD countries, the rental sector poses an ongoing challenge for further reducing emissions from dwellings due to the weaker incentives of owners to make investments in heating efficiency. The authorities have introduced an exemption to the 4% restriction on rent increases in Rent Pressure Zones (identified areas that have experienced high and rising rents) if a landlord improves the energy rating of their property by at least seven building energy ratings. An ongoing action under Ireland’s Climate Action Plan is further encouraging improvements in energy efficiency in the rental sector. As recommended by the International Energy Agency, the government should consider introducing minimum energy efficiency standards for existing rental dwellings to encourage renovations that both improve energy efficiency and make more use of renewable energy (IEA, 2019). Such a policy should specify a timeline for the minimum standards to be achieved that is consistent with the emission reduction path proposed by the authorities. Public funding should prioritise low-income households in poor quality housing with low energy performance. Such investments can provide large benefits, in addition to those from emission reductions, in terms of reduced indoor and outdoor air pollution, lower energy poverty and better indoor ambient temperature (OECD, 2019f). In New Zealand, the health benefits alone were found to make such investments in energy efficiency worthwhile (Grimes et al., 2012). Standards are also key for building equipment and appliances, such as for the installation of electric heat pumps, which could also make energy demand more flexible in response to intermittent electricity supply.
References
Bach, S. et al. (2019), “Politikberatung kompakt Für eine sozialverträgliche CO₂-Bepreisung, Politikberatung kompakt, No. 138, DIW Berlin.
Benzarti, Y. and D. Carloni (2017), “Who really benefits from consumption tax cuts? Evidence from a large VAT reform in France”, NBER Working Paper, No. 23848, National Bureau of Economic Research, Cambridge.
Berg, T., V. Burg, A. Gombovi and M. Puri (2018), “On the rise of Fintechs – credit scoring using digital footprints”, NBER Working Papers, No. 24551.
Bergin, A. and E. Kelly (2018), “The labor market in Ireland, 2000-2016”, IZA World of Labor, 2017:410.
Blöchliger, H. (2015), “Reforming the tax on immovable property: taking care of the unloved”, OECD Economics Department Working Papers, No. 1205, OECD Publishing, Paris.
Blundell-Wignall, A. and C. Roulet (2017), “Foreign direct investment, corruption and the OECD Anti-Bribery Convention”, OECD Working Papers on International Investment, No. 2017/01, OECD Publishing, Paris.
Breen, B., P. Brewster, C. O’Driscoll and A. Tsakiridis (2018), The Implications of Brexit on the Use of the Landbridge, Irish Maritime Development Office, Dublin.
Casey, E. and A. Hannon (2016), “Challenges forecasting Irish corporation tax”, Analytical Note, No. 10, Irish Fiscal Advisory Council, Dublin.
CCPC (2012), National Consumer Agency: Solicitors – Fees Charged & Price Availability, February 2012, National Consumer Agency (Competition and Consumer Protection Commission).
Central Bank of Ireland (2019a), Quarterly Bulletin, No. 3, July 2019, Dublin.
Central Bank of Ireland (2019b), Financial Stability Review, No. 2019:II, Dublin.
Central Bank of Ireland (2019c), Financial Stability Review, No. 2019:I, Dublin.
Central Bank of Ireland (2018), Innovation Hub: 2018 Update, Dublin.
Climate Change Advisory Council (2019), Annual Review 2019, Dublin.
Committee on the Future of Healthcare (2017), Sláintecare Report, Houses of the Oireachtas, Dublin.
Comptroller and Auditor General (2019), “Delivery of capital projects in the higher education sector”, Special Report, No. 107.
Conefrey, T. and D. Staunton (2019), “Population change and housing demand in Ireland”, Economic Letter, No. 14, Dublin.
Connors, J. (2018), Health Budget Oversight and Management: Alignment of Health Budget and National Service Plan, Budget 2019, Government of Ireland.
Connors, J. (2017), “Future sustainability of pharmaceutical expenditure”, Spending Review 2017, Irish Government Economic and Evaluation Service, May.
Connors, J., R. Duffy and F. Newman (2016), “Budgetary impact of changing demographics 2017-2027”, Staff Paper, Department of Public Expenditure and Reform, September.
Dell, G., and McDevitt, A. (2018), Exporting Corruption: Assessing enforcement of the OECD Anti-Bribery Convention, Transparency International.
Deloitte (2019), “Taking all reasonable steps: Deloitte bribery and corruption survey 2019 Ireland”, June.
Department of Employment Affairs and Social Protection (2019), A Roadmap for Pensions Reform 2018-2023, July.
Department of Finance (2019a), “The Balance of Payments in Ireland: Two Decades in EMU”, Economics Division, August, Dublin.
Department of Finance (2019b), “Analysis of private sector debt in Ireland”, Economics Division, Dublin.
Department of Finance (2019c), “Corporation tax”, Tax Strategy Group Paper, No. 19/01, Dublin.
Department of Finance (2019d), Annual Report on General government debt in Ireland 2019, Economics Division, August, Dublin.
Department of Finance (2019e), “Assessing fiscal vulnerabilities”, Budget 2020, Government of Ireland, Dublin.
Department of Finance (2019f), “Value Added Tax”, Tax Strategy Group Paper, No. 19/08, Dublin.
Enterprise Ireland (2018), Ireland FinTech Census 2018: a snapshot of the FinTech landscape in Ireland, Dublin.
European Commission (2019a), Post-Programme Surveillance Report, Institutional Paper, No. 112, Luxembourg.
European Commission (2019b), “Businesses’ attitudes towards corruption in the EU”, Special Eurobarometer, No. 482, December.
European Commission (2017b), “Corruption”, Special Eurobarometer, No. 470, December.
European Investment Bank (2019), European Investment Bank Investment Report 2018/2019: Retooling Europe’s Economy, European Investment Bank.
European Union (2019), Regulation 2019/630 of the European Parliament and of the Council of 17 April 2019 amending Regulation (EU) No. 575/2013 as regards minimum loss coverage for non-performing exposures, Official Journal of the European Union, 25 April.
Financial Action Task Force (2019) “Anti-money laundering and counter-terrorist financing measures Ireland: Follow-up report & technical compliance re-rating”, November.
Financial Stability Board (2019) “Decentralised financial technologies”, Report on financial stability, regulatory and governance implications, June.
Government of Ireland (2020), Medium-Term Fiscal Strategy, Department of Finance and Department of Expenditure and Reform, Dublin.
Government of Ireland (2019a), Summer Economic Statement, prepared by the Department of Finance and Department of Public Expenditure and Reform, Dublin.
Government of Ireland (2019b), Future Jobs Ireland 2019: preparing now for tomorrow’s economy, Dublin.
Government of Ireland (2019c), Draft Childminding Action Plan, August, Dublin.
Grimes, A. et al. (2012), “Cost Benefit Analysis of the Warm Up New Zealand: Heat Smart Programme”, Prepared for the Ministry of Economic Development, Wellington.
Havrylchyk, O. (2018), “Regulatory framework for the loan-based crowdfunding platforms”, Economics Department Working Papers, No. 1513, OECD Publishing, Paris.
Health Service Executive (2019), Performance Profile: January-March 2019, Quarterly Report, Dublin.
IBEC (2017), “Response to proposed Exchequer-Employer Investment Mechanism for HE and FET”, Irish Business and Employers Confederation.
IEA (2019), Energy Policies of IEA Countries: Ireland 2019 Review, International Energy Agency.
IMF (2019), Ireland – Selected Issues, IMF Country Report, No. 19/165, Washington D.C.
International Transport Forum (2018), “Shared mobility simulations for Dublin”, International Transport Forum Policy Papers, No. 58, Paris.
Irish Fiscal Advisory Council (2019), Fiscal Assessment Report, June, Dublin.
Irish Fiscal Advisory Council (2018), Fiscal Assessment Report, November, Dublin.
Johansson, Å. et al. (2008), “Taxation and economic growth”, OECD Economics Department Working Papers, No. 620, OECD Publishing, Paris.
Kelly, E., S. McGuinness, P. Redmond, M. Savege, and J. R. Walsh (2019), “An initial evaluation of the effectiveness of Intreo activation reforms”, ESRI Research Series, No. 81.
Kelly, R. and E. Mazza (2019), “A measure of bindingness in the Irish mortgage market”, Financial Stability Notes, No. 12, Central Bank of Ireland, Dublin.
Khan, L.M. (2018), “Sources of tech platform power”, Georgetown Law Technology Review, No. 325.
Lavelle, O. and N. Callaghan (2018), Public Employment Services – Mapping Activation, Spending Review 2018, Department of Public Expenditure and Reform.
Lawless, J. (2018), “Hospital inputs and outputs: 2014 to 2017”, Spending Review 2018, Department of Public Expenditure and Reform, Dublin. ‘
National Competitiveness Council (2019), Ireland’s Competitiveness Challenge 2019, December. Dublin.
OECD and European Observatory on Health Systems and Policies (2019), State of Health in the EU: Ireland, Country Health Profile 2019, OECD Publishing, Paris/European Observatory on Health Systems and Policies, Brussels.
OECD and European Observatory on Health Systems and Policies (2017), State of Health in the EU: Ireland, Country Health Profile 2017, OECD Publishing, Paris/European Observatory on Health Systems and Policies, Brussels.
OECD (2020a), FDI Qualities and Impacts in Ireland, Directorate for Financial and Enterprise Affairs, forthcoming.
OECD (2020b), The Role of Evidence Informed Policy Making in Delivering on Performance: The Irish Government Economic and Evaluation Service, Public Governance Directorate, forthcoming.
OECD (2019a), “Secretariat proposal for a ‘unified approach’ under Pillar One”, public consultation document.
OECD (2019b), OECD Pension Policy Notes: Ireland, OECD Publishing, Paris.
OECD (2019c), Education at a Glance 2019, OECD Publishing, Paris.
OECD (2019d), Implementing the OECD Anti-Bribery Convention: Phase 1bis Report Ireland, OECD Publishing, Paris.
OECD (2019e), OECD Economic Surveys: United Kingdom 2019, OECD Publishing, Paris.
OECD (2019f), Accelerating Climate Action: Refocusing Policies through a Well-being Lens, OECD Publishing, Paris.
OECD (2018a), OECD Economic Surveys: Ireland 2018, OECD Publishing, Paris.
OECD (2018b), Good Jobs for All in a Changing World of Work: The OECD Jobs Strategy, OECD Publishing, Paris.
OECD (2018c), Health at a Glance: Europe 2018: State of Health in the EU Cycle, OECD Publishing, Paris.
OECD (2017a), How’s Life? 2017: Measuring Well-being, OECD Publishing, Paris.
OECD (2017b), Pensions at a Glance 2017: OECD and G20 Indicators, OECD Publishing, Paris.
O’Malley, T. (2018), “Long-term mortgage arrears in Ireland”, Financial Stability Notes, No. 7, Central Bank of Ireland.
Privalko, I., B. Maître, D. Watson and R. Grotti (2019), “Access to childcare and home care services across Europe: an analysis of the European Union Statistics on Income and Living Conditions (EU-SILC), 2016”, Department of Employment Affairs and Social Protection, Social Inclusion Report, No. 8.
Russell, H., R. Grotti, F. McGinnity and I. Privalko (2019), “Caring and unpaid work in Ireland”, ESRI Research Series.
Russell, H., F. McGinnity, E. Fahey, and O. Kenny (2018), “Maternal employment and the cost of children in Ireland”, ESRI Research Series, No. 73.
Russell, H., F. McGinnity, and P. J. O’Connell (2017), “Gender equality in the Irish Labour Market 1966-2016: Unfinished business?”, Economic and Social Review, 48 (4), 393-418.
Sustainable Energy Authority of Ireland (2018), Energy in the Residential Sector Report, Dublin.
Teagasc (2018), “An analysis of abatement potential of greenhouse gas emissions in Irish agriculture 2021-2030”, Greenhouse Gas Working Group.
Tovar Reaños, M.A. and M. Lynch (2019), “Distributional impacts of carbon taxation and revenue recycling: a behavioural microsimulation”, ESRI Working Paper, No. 626.
United Nations (2019), “Review of implementation of the United Nations Convention against Corruption: Executive summary”, Conference of the States Parties to the United Nations Convention against Corruption, February.
Watson, D., M. Lawless and B. Maître (2017), Employment transitions among people with disabilities in Ireland: An analysis of the quarterly national household survey, ESRI Research Series, No. 58.
Wren, M., C. Keegan, B. Walsh, A. Bergin, J. Eighan, A. Brick, S. Connolly, D. Watson, J. Banks (2017), “Projections of demand for healthcare in Ireland, 2015-2030: first report from the Hippocrates Model”, ESRI Research Series, No. 67.
This Annex reviews action taken on recommendations from the March 2018 Survey that are not reported elsewhere in this Survey.
Metadata, Legal and Rights
https://doi.org/10.1787/dec600f3-en
© OECD 2020
The use of this work, whether digital or print, is governed by the Terms and Conditions to be found at http://www.oecd.org/termsandconditions.