
1. Strengths and challenges for local self-government development in Poland
This chapter assesses the socio-economic trends across local self-governing units (LSGUs) in Poland with a focus on the municipal level, by adopting a territorial perspective that acknowledges the interconnection of LSGUs with (TL3/TL2) regions in Poland and functional urban areas (FUAs). The chapter first assesses demographic trends across TL3 regions and FUAs through international comparisons and outlines the trends across Poland’s municipalities. Third, it analyses the economic performance of TL3 regions in Poland, FUAs and municipalities. Finally, it looks at the enabling factors for development across TL2 regions in Poland by comparing with the OECD benchmark.
Poland is the sixth-largest country in the European Union (EU27) in land area (312 679 km2) and fifth largest by population (38.4 million). Poland’s population density (123 inhabitants per km2) is however below European countries with similar land area and its settlement patterns exhibit a relatively low geographic concentration across (TL2) regions in comparison to European and OECD countries. Poland has the sixth-lowest gross domestic product (GDP) per capita across the OECD, yet it has closed the income gap with the other OECD countries.
This chapter adopts the OECD territorial clasficiation (TL2/TL3 regions and FUAs) and the alternative OECD territorial classification for municipalities in Poland (see introductory chapter) to identify main socio-economic trends across the territory in Poland. Some main findings from this analisys include:
Unlike most OECD countries, Poland has a rather balanced population distribution across TL2 regions, which can lead to important development hubs for the country.
Poland’s relatively large stock of working-age population has supported economic performance in recent decades.
Yet, the balanced population distribution is set to change, as large FUAs increasingly attract most of Poland’s population and non-metropolitan regions face a sharp population decline.
Along with outmigration, a combination of rapid ageing and low levels of youth population replacement threaten the age premium of Poland’s workforce.
Poland has been closing the income gap with OECD countries, yet the wealth has not been equally distributed across TL3 regions in Poland.
Metropolitan regions have the greatest labour productivity in Poland, which is partially associated with a larger specialisation in services activities. In contrast, non-metropolitan economies tend to focus on a larger share of workers in primary activities (agriculture and forestry).
At the local level, municipalities inside FUAs attract most of the firms and employ most of the population in Poland.
The catching-up process of Poland’s economy has translated into improvements in some well-being dimensions across regions, particularly education and safety.
Yet, TL2 regions in Poland lag in housing accessibility, civic engagement and health.
Poland needs to pay particular attention to improving road and information and communication technology (ICT) infrastructure across all region types in order to enhance access to markets, services and unlocks new job opportunities.
This chapter provides a diagnostic of the main economic, social and demographic trends of Poland’s LSGUs with a focus on the municipal level. It assesses the socio-economic trends across Polish municipalities. Given that municipalities are part of TL3 and TL2 regions in Poland and some of them part of FUAs, their socio-economic trends are also influenced by the performance of TL2, TL3 and FUA regions in Poland. The chapter therefore also benchmarks the main trends across TL3 regions in Poland and FUAs against the OECD.
The chapter uses the alternative OECD territorial classification for municipalities based on economic criteria to better capture the commonalities among municipalities in terms of opportunities and challenges (see introductory chapter). This OECD classification classifies municipalities according to their geographic location (inside and outside FUAs), their population size and their degree of accessibility to population settlements. This classification, compared to the current administrative structure, enables to identify municipalities based on measurable characteristics and differentiate among types of rural municipalities (those outside FUAs).
The chapter first describes Poland’s territorial structure and classification, and introduces the OECD regional classification and new municipal typology for Poland. Second, the chapter assesses demographic trends across TL3 regions and FUAs through international comparisons and outlines the trends across Poland’s municipalities. Third, it analyses the economic performance of TL3 regions in Poland, FUAs and municipalities. Finally, it looks at the enabling factors for development across TL2 regions in Poland, including their public governance considerations, by comparing Poland’s enablers with OECD benchmarks.
Poland is the sixth-largest country in the European Union (EU27) in land area (312 679 km2) and fifth largest by population (38.4 million).. Poland’s population density (123 inhabitants per km2) is however below European countries with a similar land area (Germany with 232 inhabitants per km2, or Italy with 200 inhabitants per km2) but far above the OECD country average (37).
Along with a relatively low population density, Poland’s settlement patterns exhibit a relatively low geographic concentration across TL2 regions in comparison to European and OECD countries (Figure 1.1). Poland is among the seven OECD counties with the lowest territorial concentration of population according to the index of geographic concentration. This index indicates the dispersion of the population across the territory, relative to TL2 regions’ land area.
Poland’s dispersed population can bring opportunities in terms of urban-rural linkages as the country holds a large number of small- and medium-sized FUAs whose agglomeration economies can benefit surrounding regions. However, it brings also challenges in terms of attaining economies of scale to deliver quality public services (transport, health) as well as traffic congestion and land use conflicts due to the peri-urbanisation process (OECD, 2018[1]). Addressing this type of bottleneck requires active policies that need to be co-ordinated horizontally among the same level of LSGUs and vertically between national, regional and local self-governments units.
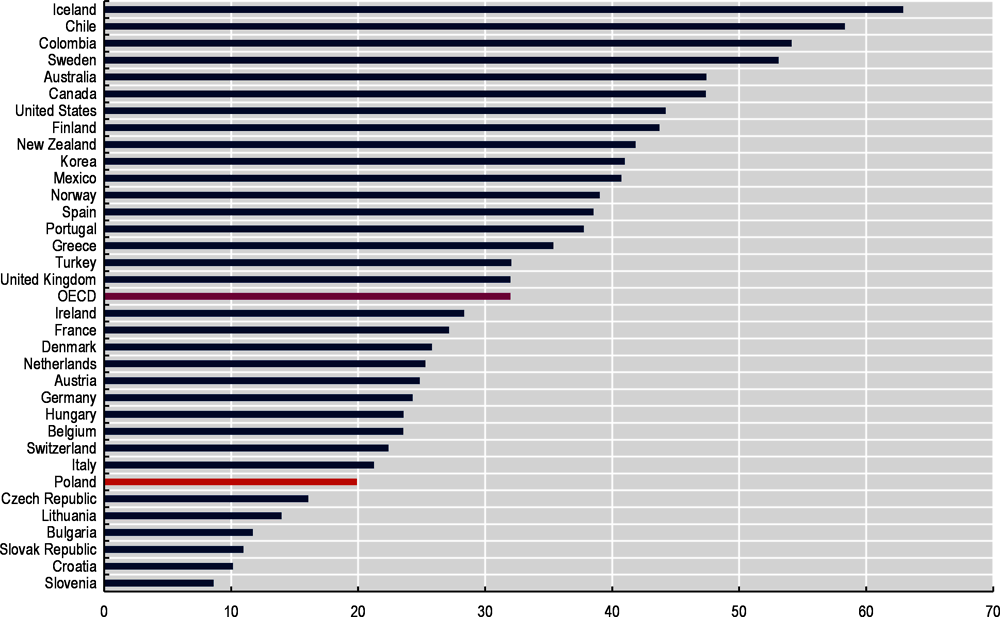
Note: The geographic concentration index of population, which is comparable across countries, is calculated as: , where is the population share of region i, is the area share of region i.
Source: OECD (2020[2]), “Regional demography”, https://doi.org/10.1787/a8f15243-en.
Poland’s regional and municipal government levels are relatively new. As explored in detail in Chapter 6, after the end of the communist era in 1989, a series of decentralisation reforms (in 1990 and in 1998) led to the first municipal elections and the creation of the regional and local self-government levels (OECD, 2018[1]). The regional self-government level is formed of 16 regions/voivodeships (województwo), while the local self-government level is formed of counties (powiat) and municipalities (gmina). Such governance/decentralisation reforms provided subnational self-government units with an increasingly important role in the provision of infrastructure and services.
This section analyses the settlement patterns and demographic trends at the regional, FUA and municipal levels in Poland, using international comparisons for regions and FUAs and leveraging the municipal territorial classification presented previously. According to the OECD questionnaire of Polish LSGUs (OECD, 2019[3]), demographic challenges are an important concern for municipalities with two-thirds of the 47 municipalities surveyed ranking demographic issues among the top relevant topics for development. Main challenges include an ageing and declining population, increasing migration and low birth rates.
Poland has a higher share of population living in non-metropolitan regions than the OECD average
As mentioned in the previous section, Poland has a relatively dispersed population across the territory. Unlike the average trend in OECD countries, Poland has a rather balanced TL3 regional population distribution between metropolitan (51%) and non-metropolitan (49%) regions. Non-metropolitan regions in Poland concentrate a high population in comparison to the average of OECD countries (29%) and most people living in metropolitan regions are located in regions with small- and medium-sized FUAs (35%) rather than in large metropolitan regions (16%). This contrasts with OECD trends, where the latter host on average a larger share of the population (42% of the national population).
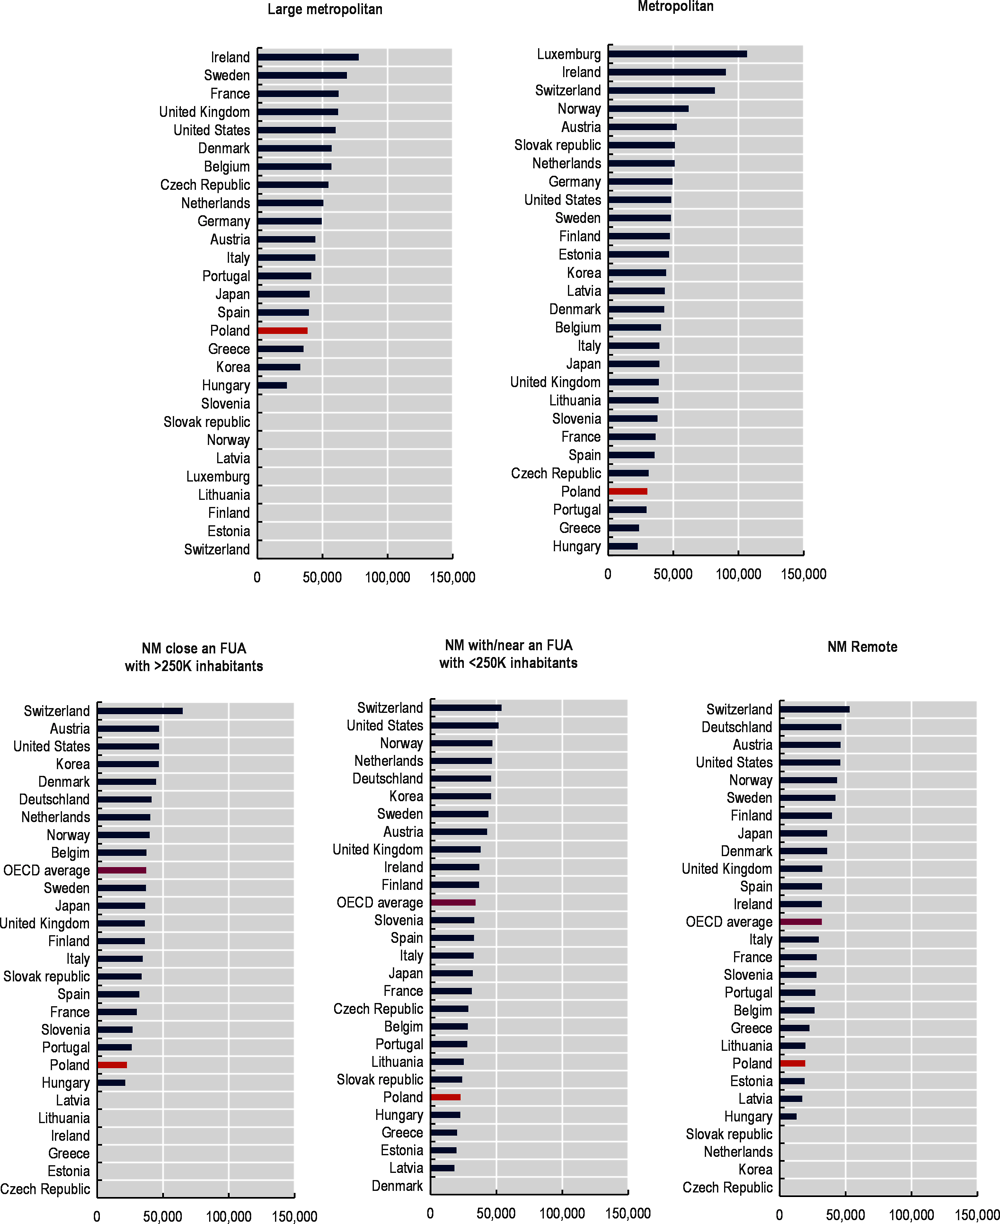
Within non-metropolitan regions, those with or near a small FUA concentrate most of the rural population (30% of the national population), placing Poland as the eighth OECD country with the highest share of population living in these type of regions (Figure 1.2). Regions near a large FUA (10.9% of the national population) and remote regions (8.6%) concentrate a much lower share of the non-metropolitan population. It is worth noting that the share of people leaving in remote regions is slightly above the average of the OECD population in these types of regions (7.7%).
This relatively evenly distributed population across the territory offers the possibility to mobilise the labour force and unlock growth opportunities in all regions. Pockets of density outside large FUAs including villages, market towns and smaller FUAs can represent important hubs for development and job creation (OECD, 2020[4]). Harnessing the benefits from these hubs requires sound co-ordination among governments to support accessibility for these towns and surrounding areas to markets and public services.
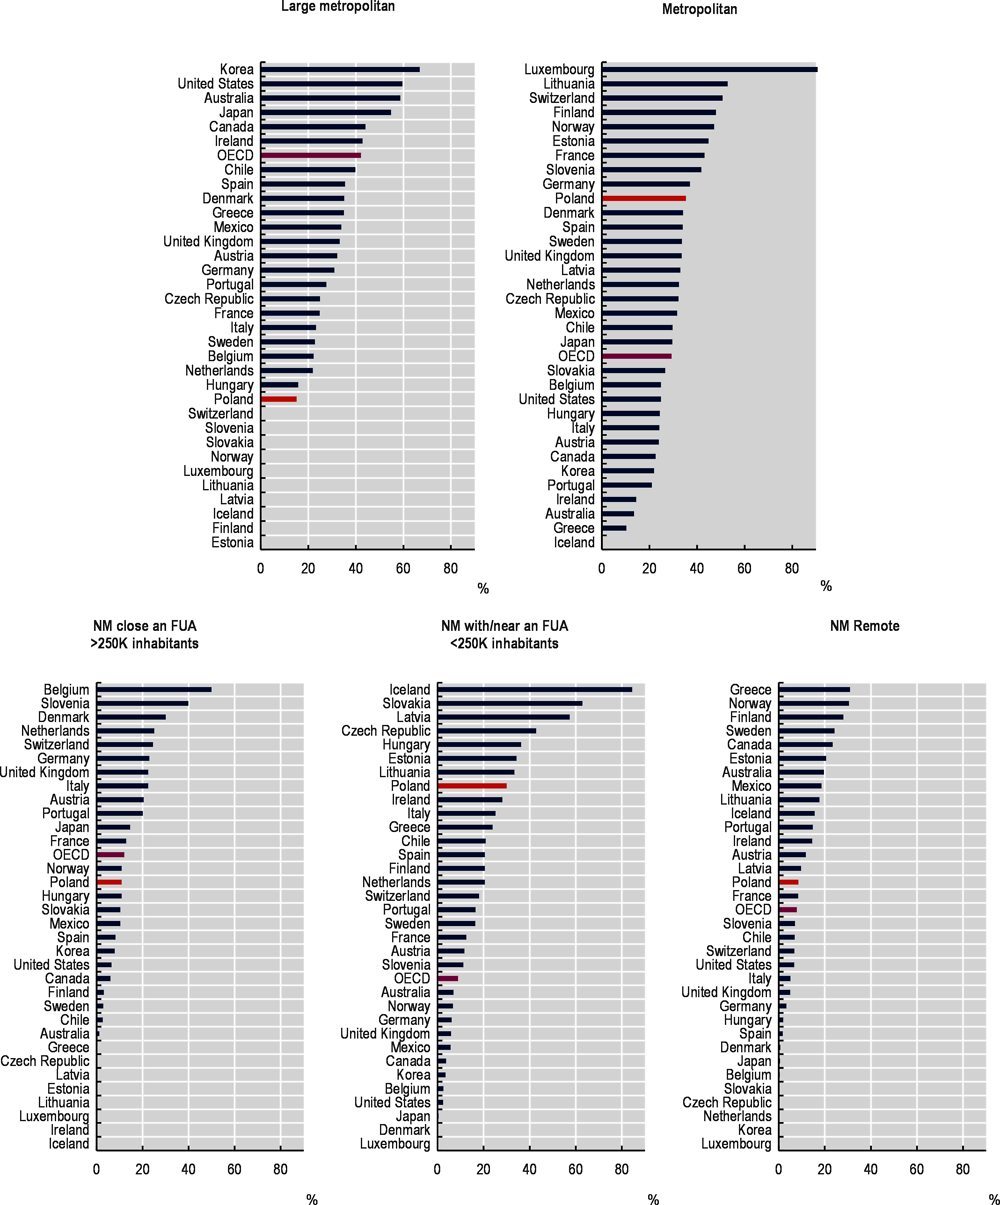
Note: 2018 values for Australia, Ireland, Japan and the United States. NM stands for Non-metropolitan.
Source: OECD (2020[5]), OECD Regional Statistics (database), https://doi.org/10.1787/region-data-en.
Yet, greater absorption of FUAs and a sharp decrease in population is set to change the current territorial balance
Since 2015, Poland has consecutively ranked among the ten countries with the highest population decline across the OECD. In 2018, Poland’s population dropped by 22 400 inhabitants. This negative population change (-0.02% per year) contrasts with the positive population growth across European (0.02%) and OECD (0.6%) countries. Poland’s population decrease is associated with negative natural population growth (lower number of births relative to deaths), which is not compensated by the net migration rates into the country (which is positive but low).
In fact, Poland’s fertility rate (1.4 children per women) ranks among the tenth- and sixth-lowest across OECD and European countries respectively (OECD, 2020[6]). The country’s fertility is far below the minimum replacement rate to keep natural population growth positive (2.3). This is partially explained by changes in individual lifestyle preferences (e.g. willingness to start a family) and higher female participation in the labour market. For countries like Poland, the former factors couple with the transformations brought about by the introduction of the market economy after 1989 (e.g. weakened social function of the state and unemployment rate) (OECD, 2020[6]; Kurek, 2011[7]). The European Commission estimates that Poland’s population will decrease from 38 million to 32.8 million by 2060, a decline of almost 16% (Eurostat, 2020[8]).
Poland’s population is increasingly concentrated in large FUAs
Poland’s trend of natural population decline represents a double impact for non-metropolitan regions, as it couples with a growing outmigration towards FUAs. In the last two decades, non-metropolitan regions in Poland have experienced an acute drop in population (-2.5% from 2001 to 2019), which contrasts with a slight increase in metropolitan regions (0.95% of the same period). Particularly, large metropolitan regions have experienced the highest population growth (1.4%) across all types of regions, exceeding growth in small/medium metropolitan regions (0.8%).
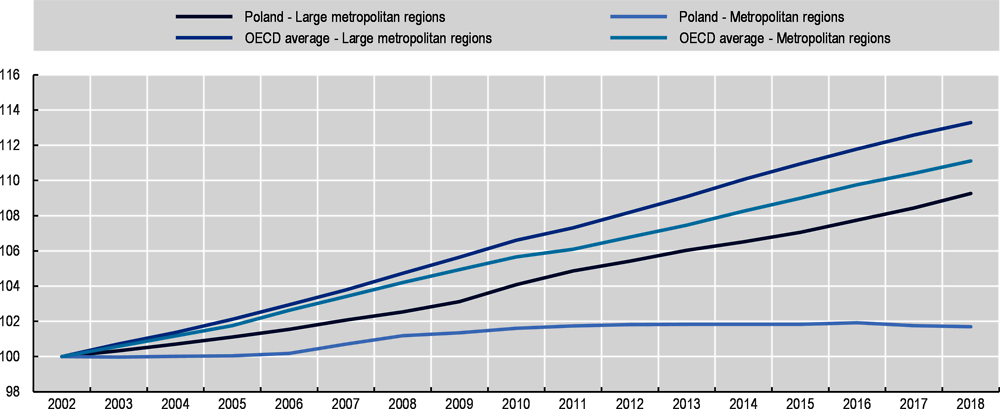
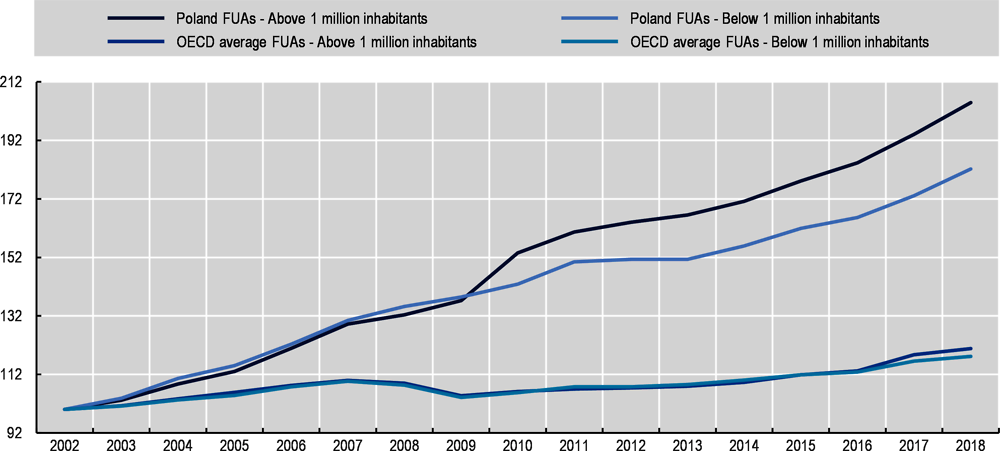
The population in Poland is increasingly concentrated in large FUAs (more than 1 million inhabitants), which registered a population growth (0.2% annual average between 2002 and 2018) far above the one recorded for small/medium FUAs (0.03%). Poland’s population growth in large FUAs accelerated during the aftermath of the 2008 economic crisis, partially explained by an increasing migration of young people from non-metropolitan regions looking for job and education opportunities (see next section). Yet, Poland’s population growth in all FUA sizes is low when comparing with the OECD average (Figure 1.3). Such a relatively slower urbanisation trend can be an opportunity for Poland as it provides municipalities with more time to develop and adapt to changes in settlement patterns and better plan intercity infrastructures and social arrangements.
Small municipalities inside FUAs are attracting most of Poland’s population
At the municipal level, small municipalities inside FUAs experience the largest population growth in the country (0.5% per year between 2000 and 2018), although most of Poland’s population still live in big municipalities inside FUAs (42%) (Figure 1.4). This contrasts with a declining population in all municipalities outside FUAs. Since 2000, municipalities outside FUAs with low accessibility have experienced the largest drop in population (-3.7% between 2000 and 2018 or -0.2% annual average), followed by big municipalities outside FUAs with high accessibility (-1.8%).
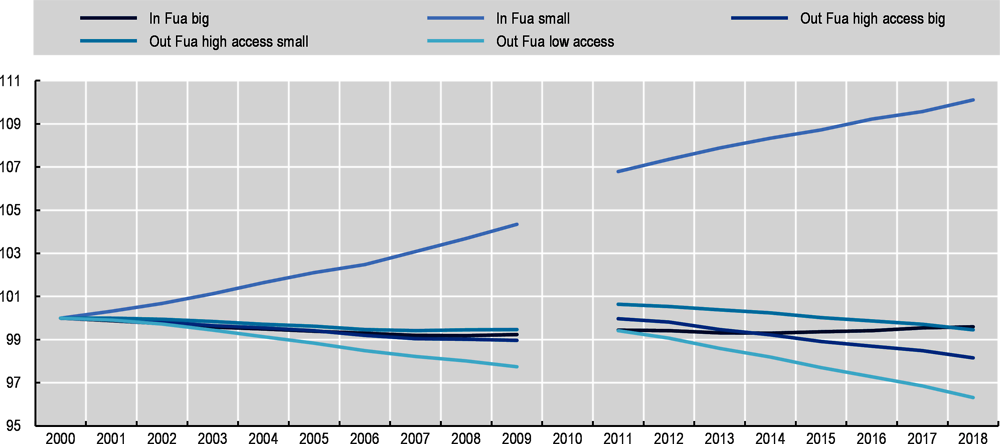
Note: 100=2000. Access refers to access to FUAs. Changes in the data series do not enable to provide data for the year 2010.
Source: Statistics Poland (2020[10]), Regional Statistics, https://stat.gov.pl/en/regional-statistics/ (accessed on 15 November 2020).
Population growth in municipalities inside FUAs is mainly driven by a high inflow of people from other municipalities (Figure 1.5). Between 2000 and 2018, municipalities inside FUAs were the net receivers of the population in Poland, with a total net migration (outflows - inflows) of 430 230 people (1.9% of the population in these municipalities). Of the people arriving to municipalities in FUAs, 60% are female, whose inflow trend picked up after the 2008 crisis (from an average migration of 10 627 women between 2000 and 2008 to 15 201 between 2009 and 2018).
In contrast, all three types of municipalities outside FUAs experienced net outflows of population. Between 2000 and 2018, municipalities outside FUAs registered 616 439 people out-migrating (3.6% of the population in this type of municipality), mostly women (58%). During the same period of time, municipalities outside FUAs with low accessibility experienced the largest net outflow of people (in total 6% of their population in 2018), followed by big municipalities outside FUAs with high accessibility (4.3% of their population). It is worth nothing that the amount of people leaving municipalities outside FUAs with high accessibility has accelerated in recent years. In fact, 2018 was the year with the largest amount of people (18 322) leaving small municipalities outside FUAs with high accessibility since 2000.
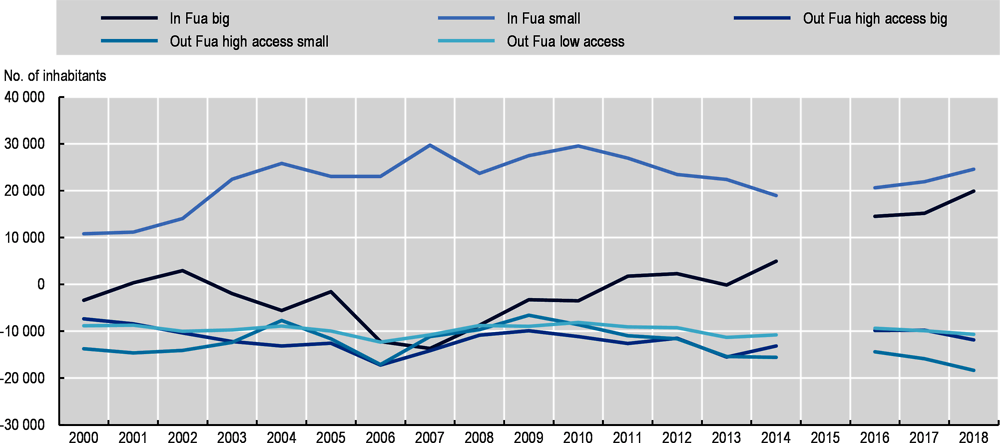
Note: Data from 2015 is not published due to insufficient quality of data for this year. Data on migration includes internal and international migration, based on the registration of permanent residency in each municipality. Access refers to access to FUAs.
Source: Statistics Poland (2020[10]), Regional Statistics, https://stat.gov.pl/en/regional-statistics/ (accessed on 15 November 2020).
If well managed, Poland’s concentration trend in FUAs can be beneficial as countries with higher GDP per capita tend to be more urbanised, especially in terms of metropolitan population (OECD/EC, 2020[11]). Generally, the concentration of firms and people in specific areas yield important economic advantages such as economies of scale, better matching and functioning labour markets, spill-over effects and greater exchange of ideas that promotes innovation (OECD/EC, 2020[11]). However, very dense FUAs also bring challenges for development including congestion, urban sprawl, higher land prices, larger environmental cost (pollution) and inequalities (OECD, 2015[12]). While benefits from urbanisation are mainly driven by market forces, costs must be mitigated by public policy, which requires LSGU co-ordination. Policies to enhance co-ordination and address challenges in FUAs are addressed in the next chapters of this report.
A combination of rapid ageing and low youth population replacement threatens Poland’s age premium
Along with the decreasing population, Poland is experiencing rapid population ageing due to the combination of high life expectancy, lower fertility rates and outmigration. With the current trend of youth population replacement, Poland is expected to be the sixth OECD country with the highest ageing rate (OECD, 2019[13]).
The elderly population in Poland is similarly distributed between metropolitan and non-metropolitan regions (25.1% and 25.4% respectively). It contrasts with the average trend across OECD countries, where non-metropolitan regions tend to hold higher shares of elderly population than metropolitan regions (OECD, 2020[4]). As mentioned before, Poland currently benefits from a relatively low elderly dependency ratio by international comparison, especially in non-metropolitan regions, whose rate ranks among the fifth-lowest across OECD countries (Figure 1.6). This phenomenon can be associated with higher birth rates in non-metropolitan regions in Poland (10.3 births per 1 000 inhabitants) than urban ones (9.4), which reflects greater changes in individual lifestyle preferences and housing accessibility constraints in FUAs as well as higher labour participation of women in urban areas (OECD, 2018[1]; Kurek, 2011[7]). When comparing among non-metropolitan regions in Poland, the ones with/near a small FUA have the lowest share of elderly dependency ratio population in Poland (25.4%), while regions near a large FUA record the largest elderly dependency ratio in the country (25.5%).

Note: NM stands for Non-metropolitan.
Source: OECD (2020[5]), OECD Regional Statistics (database), https://doi.org/10.1787/region-data-en.
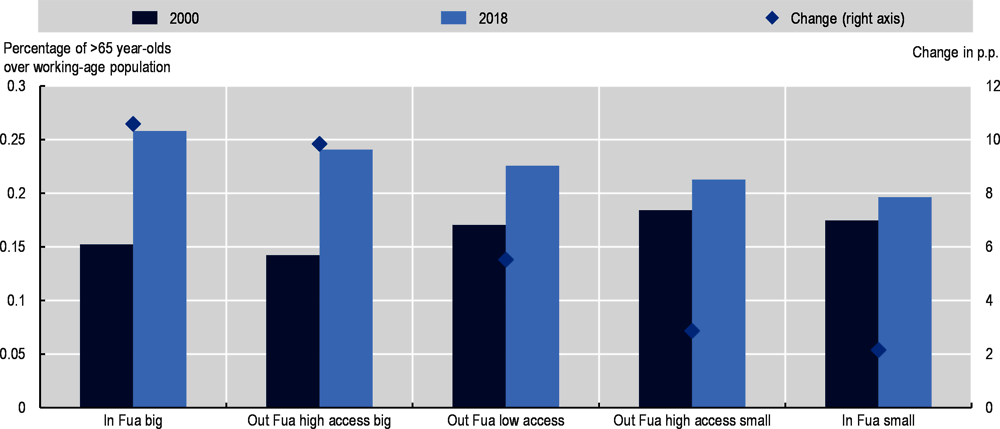
Across Polish municipalities, big municipalities inside FUAs hold the largest elderly dependency ratios (26% in 2018) and perceive the fastest growth of the elderly population (from an elderly dependency ratio of 15.2% in 2000 to 25.8% in 2018) (Figure 1.7). In contrast, small municipalities inside FUAs have the lowest elderly population ratio (20%) and the lowest growth of this ratio among all types of municipalities (from 17.5% in 2000 to 19.6% in 2018). Increasing old-age dependency ratios will put local budgets under pressure, as governments need to finance higher amounts of pensions, health and long-term care, while the tax base reduces.
The share of youth population in Polish FUAs is relatively low
The youth dependency ratio of FUAs in Poland (23%) is relatively low in comparison to the OECD average (27%). The share of the youth population in FUAs decreased during the first decade of the 2000s, driven by the international migration of young people (OECD, 2018[1]). Since the end of the 2008 economic crisis, the share of the youth population in FUAs in Poland has recovered its growth pace, passing from an average of 20.6% between 2002 and 2009 to 21.7% between 2009 and 2018. This rise contrasts with the declining trend of the youth population in OECD FUAs, which drop from 28.8% between 2002 and 2009 to 27.3% between 2009 and 2018.
Despite the recovery after 2008 in FUAs, the net result in the last two decades (since 2000) is a drop in the youth population share across all municipalities (Figure 1.8). This negative change is particularly high in municipalities outside FUAs with low accessibility (from 29.2% in 2000 to 9.2% in 2018), followed by small municipalities outside FUAs with high accessibility. In contrast, big municipalities inside FUAs recorded a lower drop in the youth population share (-1.3 percentage points). This trend uncovers the increasing outmigration of the youth population to FUAs.

Poland holds a relatively high share of the working-age population but it is rapidly shrinking, especially in big municipalities outside FUAs
The population structure of Poland currently ensures a relatively large stock of working-age population (15-64 year-olds). This demographic asset can leverage economic growth, attract international companies and lead to greater business creation. Most of Poland’s working-age population is concentrated in metropolitan regions with medium- and small-sized FUAs (35.3%), well above the concentration of the same type of region across OECD countries (28.7%). In contrast, large metropolitan regions experience a relatively low share of the labour force (14.8%) in comparison with OECD levels (44.1%). As the next section will describe, it underlines the increasing challenges of the ageing population that large metropolitan regions in Poland have to face.
Within non-metropolitan regions, those with or near a small FUA register the second-largest share of working-age population in the country (30.2%), far above the average figures for the same type of region across OECD countries (9.3%). Likewise, remote regions in Poland hold higher working-age population shares than similar regions across OECD countries. In contrast, non-metropolitan regions close to large FUAs register a lower labour force than the OECD average. At the municipal level, big municipalities inside FUAs concentrate most of Poland’s working-age population (41%), followed by small municipalities outside FUAs with high accessibility (24%). Poland’s workforce is balanced in terms of gender (similar proportion between male and female).
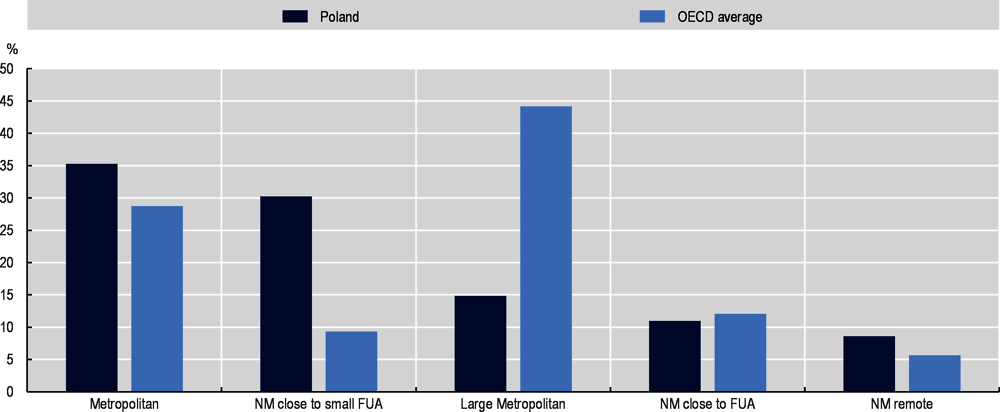
Note: For a better visualisation of the figure, NM stands for Non-metropolitan.
Source: OECD (2020[5]), OECD Regional Statistics (database), https://doi.org/10.1787/region-data-en.
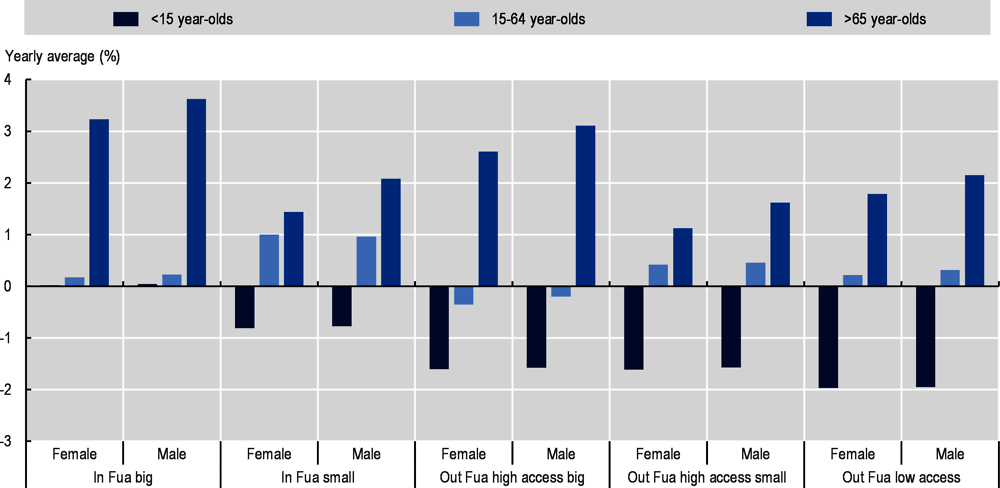
However, the high share of the elderly population along with a decreasing youth population has led to a shrinking workforce across all municipalities in the country. Poland is the fourth OECD country with the largest projected decrease in the working-age population between 2020 and 2060, below Korea, Latvia and Lithuania (OECD, 2019[13]). At the municipal level, the big municipalities outside FUAs with high accessibility experience the largest decrease in the workforce (-0.3% yearly average between 2000 and 2018), with a particularly high drop in the female workforce (-0.4% yearly average). In contrast, small municipalities inside FUAs are the ones that register the largest workforce growth in the country (Figure 1.10).
Interestingly, municipalities outside FUAs with low accessibility have experienced a growth of labour force share (1.9%) but this trend masks important differences. For example, in 2018, 3 municipalities with low accessibility (Czyże, Dubicze Cerkiewne and Orla) rank as having the lowest share of the working-age population (around 54%) in the country, while other low-accessibility municipalities like Cisna, Kolno and Lutowiska ranked among the 15 largest shares in the country (72%).
Workforce decline and ageing are major issues to maintain vibrant economies at the local level. It limits growth for local business, reduces the local market size and the entrepreneurship of the economy. It can lead to negative shocks for local income revenue, which in turn threatens the quality of public services delivery and pushes the local community to a trap of low-growth scenarios. Addressing the demographic challenges, particularly in rural municipalities, means increasing attractiveness for young people and new companies and workers to come, including immigration strategies. It is not a straightforward task, as it requires long-term strategies and budgets along with local self-government capacity and close work with the local community to agree and ensure the implementation of growth objectives. The next chapters of this review will offer some solutions to these challenges from the governance perspective.
In conclusion
Poland has a dispersed territorial population with a low geographic concentration across regions. The country stands out for having a high share of population living in non-metropolitan regions, relative to the OECD average. The two regions concentrating most of Poland’s population are metropolitan (35%) and non-metropolitan regions near or with a small FUA (30%). At the local level, big municipalities inside FUAs (42%) and small municipalities outside FUAs with high accessibility (24%) host most of the population. Poland still benefits from a relatively young age structure, by OECD comparison, which has partially explained the country’s economic growth in recent decades (see next section). Most of this working force is today located in metropolitan regions with medium-sized FUAs (35.4%) and Poland’s non-metropolitan regions stand out for having the fifth-lowest elderly dependency ratio (25.4%) across OECD in similar regions.
Nevertheless, the balanced population distribution in the territory is set to change, as FUAs increasingly attract most of Poland’s population and non-metropolitan regions (low accessibility) face rapid population decline. Since 2015, Poland has consecutively ranked among the ten countries with the highest population decline across the OECD. Municipalities outside FUAs, particularly those with low accessibility, are the ones facing the largest population drop, while small municipalities inside FUAs experience the greatest population growth in the country. Likewise, Poland’s workforce is increasingly shrinking. Municipalities outside FUAs, particularly big ones with high accessibility, register the largest decrease in the country, with a high decline in the female workforce. In contrast, small municipalities inside FUAs stand out for having the largest workforce growth and a relatively low elderly population ratio. This concentration of population in FUAs reveals the growing rural-urban migration, especially from non-metropolitan youth.
Poland’s concentration trend in FUAs is happening at a low pace, which can be beneficial for planning purposes. Municipalities, particularly those with access to big FUAs, can benefit from a relatively low urbanisation growth to develop long-term plans that harness the benefits of agglomeration economies (e.g. economies of scale and knowledge exchange) while addressing the negative externalities. High-density FUAs can bring challenges for people and businesses, including congestion, higher housing prices and longer commuting times. As Chapters 2 and 3 of this review will outline, addressing these issues requires co-ordination among levels of government and types of sectoral policies (e.g. transport and housing).
The still balanced population distribution has led to pockets of density outside large FUAs, which can represent an opportunity for Poland to unlock important development hubs. Mobilising growth around these hubs requires strengthening rural-urban interactions, especially around small FUAs, in order to create poles for the non-metropolitan hinterland. For this, local self-government needs to enhance collaboration in planning and investment with a territorial perspective (recognising municipal characteristics) as well as in monitoring and evaluation mechanisms that help adapt strategies to demographic changes. Strategies on this will be further developed in the next chapters of this review (especially Chapters 2, 3 and 5).
Finally, the decreasing and ageing population, especially in municipalities outside FUAs, is an increasing challenge for Poland. Without the right policy and planning in place, this can lead to a number of negative impacts including a shortage of labour to support economic growth, increasing cost of public service provision and a reduced tax base. Addressing this challenge can include policies to support population growth, including good access to childcare facilities or reducing the initial cost of having a child, without discouraging female labour supply. As the next chapters will explore, LSGUs should also co-ordinate policies to avoid competition for labour at the local level and retain the youth population, attract new residents and develop targeted immigration programmes. Enhancing labour participation and education can also help LSGUs to leverage economic growth and attract firms.
Since the country’s accession to the EU (2004), Poland’s economy has taken off, lifting GDP per capita levels and lowering unemployment rates. In fact, Poland was the only EU member state to avoid recession during the global financial crisis of 2008 and 2009 and has kept closing the income gap in advanced economies. However, the increase in wealth has not been equally distributed across the territory and the country’s productivity remains far below the OECD average. Likewise, economic performance has occurred in the midst of a decreasing population driven by a phenomenon of outmigration to other European countries.
The economic impact of the COVID-19 crisis in 2020 hit the Polish economy hard, leading to its first recession since the 1990s (two consecutive quarters of contraction). Recovering the economy should involve close support to LSGUs in Poland in order to mitigate greater income inequalities across the territory and leverage on territorial characteristics to boost growth. Under this context, this section will outline main economic trends in regions, FUAs and municipalities across Poland and will identify the main strengths and bottlenecks to attain sustained and balanced growth across the territory.
Poland continues to close the income gap with OECD economies but its income level is still relatively low
In the last two decades, Poland has closed the income gap with advanced economies driven by a strong labour productivity growth (OECD, 2019[14]) as a result of sectoral restructuring and foreign technology absorption. This positive performance has led to a record low level of unemployment (18.4% in 2001 to 3.3% in 2019) accompanied by signs of accelerating wages. After a contraction in 2016, investment increased again in 2017, supported by low real interest rates and a rebound in public investment as EU structural funds were back in the spotlight (OECD, 2018[15]).
Yet, despite the strong growth performance, Poland recorded in 2019 the seventh-lowest GDP per capita across the OECD and employment rates remain below the OECD average, particularly for women and older workers (OECD, 2019[14]). At the regional level, all types of region in Poland, non-metropolitan and metropolitan, still rank among the lowest income levels across OECD regions (Figure 1.11). Metropolitan and non-metropolitan regions in Poland have, on average, the fourth-lowest GDP per capita across OECD countries. However, within non-metropolitan regions, those close to large FUAs have the worst performance relative to OECD levels, ranking as the second lowest GDP per capita across the same type of OECD regions. This can be partially explained by a relatively lower share of the workforce, as these regions are the only type of non-metropolitan regions that have a lower workforce share than the OECD level and record the highest ageing population share in the country. Additionally, as per their proximity to large FUAs, new settlers in these regions might keep registering and paying their taxes in the FUA, which reduces the income level registered in these areas.
Poland’s economy has a high concentration in services activities but its value-added is lower than the OECD average. The tertiary sector (services) provides most of the valued-added to Poland’s economy (63.6% in 2017), followed by industry (33.7%) and the primary sector (2.7%). While the value-added from industry exceeds OECD levels (26.7%), the contribution from services is below the OECD average (70.8%). The primary sector, composed of a large share of agricultural activities on top of a small share of forestry and fishing activities, generates a relatively similar level of value-added than the OECD average (2.5%) but absorbs a far larger share of employment (11%) than the OECD (5%) (OECD, 2018[1]). It underlines the relatively low productivity of the primary sector and an opportunity to further support income in non-metropolitan economies.
Note: In USD purchasing power parity (PPP). NM stands for Non-metropolitan.
Source: OECD (2020[5]), OECD Regional Statistics (database), https://doi.org/10.1787/region-data-en.
The increase in wealth has not been equally distributed across TL3 regions in Poland
After the 2008 financial crisis, regional inequality increased in almost all OECD countries (OECD, 2018[16]). Increased regional inequalities across the OECD are driven by top regions raising their GDP per capita levels faster than the rest (OECD, 2020[4]). Poland is not an exception; in fact, between 2008 and 2017, it recorded the second-highest growth in regional income inequality across OECD countries (Figure 1.12), ranking as the fifth OECD country with the highest regional economic disparity (OECD, 2018[16]). Income disparities across regions are positively correlated with disparities among people and can lead to social unrest and costly social policies (OECD, 2018[1]).
Without policy intervention, the recent economic crisis brought by the COVID-19 pandemic has the potential to worsen Poland’s current regional disparity trend, as was the case in the aftermath of the 2008 financial crisis. Efforts to bridge the income gap are especially significant in times of crisis, as low-income and less economically diversified regions are more vulnerable to external shocks (OECD, 2020[4]). As the next chapters will depict, improving governance processes on social, fiscal and investment matters is an important tool to diminish the negative impacts on local income disparity from the COVID-19 crisis.
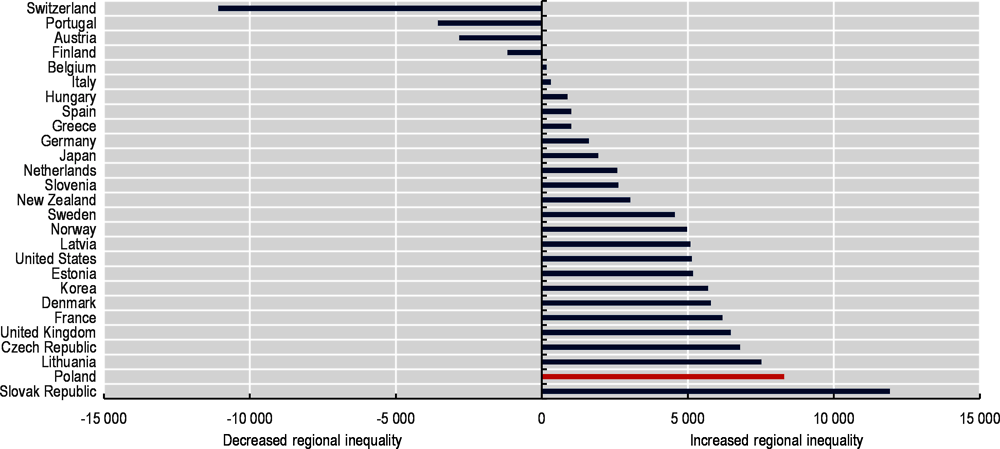
Note: 2017 extrapolated values for France and Japan based on 2001-16 regional growth rates. Based on available data for 1 629 TL3 regions. Unlabelled cases are better off (top or bottom). Top (bottom) refers to top (bottom) 20% regions with the highest (lowest) GDP per capita levels (PPP) with populations adding up to at least 20% of the national population.
Source: OECD (2020[5]), OECD Regional Statistics (database), https://doi.org/10.1787/region-data-en.
Metropolitan regions benefit from a greater income than non-metropolitan regions
Poland’s high regional income disparity is partially driven by an increasing concentration of people and wealth in metropolitan regions, especially in Warsaw (OECD, 2018[1]). The city of Warsaw (TL3 large metropolitan region) has the largest GDP per capita in Poland (USD PPP 85 542 in 2017), 49% above the second richest TL3 region (Poznań) and three times higher than the average of the country (USD PPP 26 213 in 2017).
The majority of the top 10% richest regions in Poland are metropolitan regions (82%), while all 10% of the poorest regions are non-metropolitan ones. Overall, GDP per capita in metropolitan regions is 10% greater than the national average and 60% larger than in non-metropolitan regions. This trend is also observed across OECD countries, where densely populated areas experience larger income levels due to greater economies of scale and attraction of firms and workers (OECD/EC, 2020[11]). While inequalities among the country’s capital and other regions are not a unique characteristic of Poland, a growing disparity trend can indeed lead to social issues.
Within non-metropolitan regions, remote areas have the lowest GDP per capita in the country (USD 19 303), equivalent to 61% of national income (or 74% of average regional income). Non-metropolitan regions with or near a small FUA have a slightly higher per capita GDP than those near a big FUA (0.27% higher), which contrasts with the average trend across OECD, where regions close to a big FUA outperform the rest of non-metropolitan regions. As explained before, this phenomenon reveals a greater working force decline in these regions and can be affected by the registration of income and taxes of residents that still work in the big FUA. It raises the need for better co-ordination at the local level to identify why some of these regions close to FUAs do not benefit from the positive externalities of being close to larger markets as much as similar regions across OECD countries. LSGU collaboration has scope to improve policies on job accessibility, the attraction of new companies, knowledge transfer among large FUAs and their surrounding non-metropolitan regions (see Chapters 2 and 6).
It is worth noting that the type of economic specialisation also spurs income disparities among non-metropolitan regions in Poland. Legnicko-Glogowski and Płock, non-metropolitan regions close to a small FUA, rank among the ten richest TL3 regions in Poland, partially due to the income from extractive-related industries (country’s largest oil refinery in Płock and silver and copper production Legnicko-Glogowski).

Note: For a better visualisation of the figure, NM stands for Non-metropolitan.
Source: OECD (2020[5]), OECD Regional Statistics (database), https://doi.org/10.1787/region-data-en.
Income in FUAs in Poland has increased faster than the OECD average, particularly in large FUAs
FUAs of all sizes in Poland have experienced greater economic growth than the average of OECD countries. In particular, large FUAs (Gdańsk, Katowice, Kraków and Warsaw) have driven national income growth (Figure 1.14). Between 2002 and 2018, the income per capita growth in Poland’s large FUAs (4.6% average annual growth) was more than 4 times higher than the average of OECD FUAs (1.2%). Likewise, income per capita of Poland’s medium- and small-sized FUAs grew above (3.6%) the average of the same type of OECD FUAs (1.0%). Since the 2008 financial crisis, income growth of the capital accelerated against the rest of the country. Between 2008 and 2018, Warsaw registered an average GDP per capita growth (5.6%) far above Kraków (3.5%), Gdańsk (3.4%), Katowice (2.7%) and the average growth in small/medium size FUAs (2.8%).
Economic growth of FUAs in Poland has led to lower unemployment rates than in municipalities outside FUAs
Unemployment in FUAs has decreased faster than the average of OECD FUAs. The decrease in unemployment across FUAs in Polandci accelerated in the aftermath of EU accession, driven by the outmigration of unemployed people to other EU countries (Fihel and Kaczmarczyk, 2013[17]). Large and small/medium FUAs in Poland have a much lower unemployment rate (2.7% and 4.3% in 2018) than similar FUAs in the OECD (5.2% and 5.0%). Likewise, at the municipal level, municipalities in FUAs register the lowest unemployment rate (2.9% in big and 3.7% in small) across all types of municipalities. In contrast, municipalities outside FUAs with low accessibility record the largest unemployment rates (5.5%), yet with a positive experience of catching up, as they have registered the greatest unemployment reduction between 2008 and 2018 (Figure 1.15).
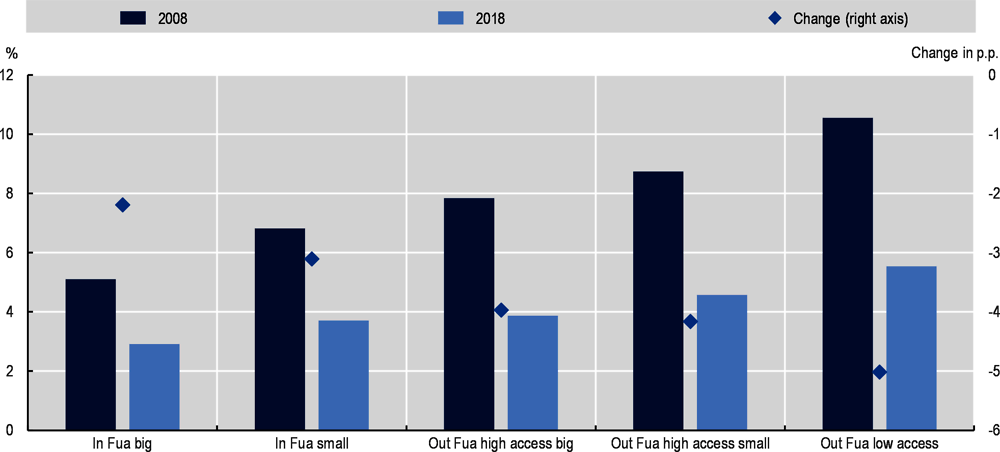
Note: p.p.: percentage points. Access refers to access to FUAs.
Source: Statistics Poland (2020[18]), Regional statistics, https://stat.gov.pl/en/regional-statistics/ (accessed on November 2020).
High income in metropolitan regions in Poland is associated with higher levels of value-added and labour productivity
Metropolitan regions generate the bulk of Poland’s economic wealth. Metropolitan regions account for 56% of total national gross value-added (GVA), compared to 44% of non-metropolitan GVA. Unlike the OECD trend, large metropolitan regions in Poland account for a higher GVA share than metropolitan regions. It underlines the increasing economic absorption capacity of large FUAs in Poland and the productivity challenge in small/medium FUAs. In line with OECD trends, remote regions provide the lowest contribution to the national economy and their contribution is relatively lower than the same type of regions across OECD.
Metropolitan regions’ greater contribution to the national economy is partially explained by higher labour productivity (GVA per employee) (Figure 1.16). Labour productivity in large metropolitan regions is on average 17% higher than the level of metropolitan regions and 35% higher than non-metropolitan regions. While productivity in all Polish regions is far below the level of the same type of OECD regions, this gap with OECD countries is higher in non-metropolitan regions (32.3% below OECD levels), particularly in remote ones (40.1%). Rising labour productivity in non-metropolitan regions in Poland should be a national policy objective to enhance national well-being and keep closing the income gap with OECD countries. As the next section will depict, much of such low productivity is associated with the type of economic structure in non-metropolitan economies.

Note: Share calculated as the ratio of GVA by employee. USD PPP base year 2015.
Source: OECD (2020[5]), OECD Regional Statistics (database), https://doi.org/10.1787/region-data-en.
Non-metropolitan regions specialise in primary activities, while metropolitan regions focus on services
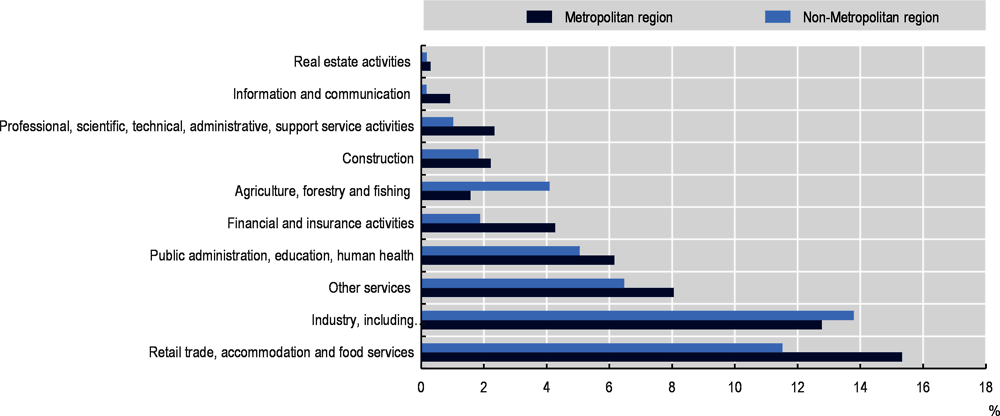
As in most OECD countries, metropolitan regions in Poland concentrate the largest share of people working in high-value-added service activities (e.g. financial and insurance, professional and scientific, information and communications). In contrast, non-metropolitan regions hold a larger share of workers in primary activities (agriculture and forestry) (Figure 1.17). This difference in economic specialisation largely explains the greater productivity and income in FUAs. The productivity of services tends to increase in large FUAs as it benefits from access to a pool of specialised labour and knowledge networks (OECD, 2020[4]). It is worth noting, that both types of TL3 region have a high concentration of workers in the retail and industry sectors. However, industry is slightly more concentrated in non-metropolitan regions, particularly in those close to small/medium FUAs (Figure 1.18), with a high share of industrial activities associated with processing natural resources (refineries, food processing).
Non-metropolitan regions in general have a relatively large job concentration in few lower-value-added activities (public administration), in many cases more exposed to international competition (agriculture). TL3 Regions close to a large FUA in Poland slightly differ from the rest of non-metropolitan regions as they hold a larger share in the services sector (Figure 1.18). In fact, these TL3 regions concentrate most of the non-metropolitan workers in the information and communication sector (86%), which reveal some benefits from the proximity to agglomeration economies. In contrast, remote regions are mostly dedicated to the agriculture, forestry and fishing sector (17.6% of workers in non-metropolitan regions), followed by construction (7.5%) and public administration (7.4%). This concentration in tradeable activities and highly procyclical sectors (construction) make these TL3 regions more vulnerable to external shocks. Policies to diversify non-metropolitan economies, especially remote regions and those close to small FUAs, coupled with strategies to increase the value-added of their products could help them attain greater resilience and sustainable income.
Note: Share of the ratio of workers by sector over the national number of employees by sector.
Source: OECD (2020[5]), OECD Regional Statistics (database), https://doi.org/10.1787/region-data-en.

Note: Share calculated as the ratio of workers by sector to the total of workers from non-metropolitan regions. NM stands for Non-metropolitan.
Source: OECD (2020[5]), OECD Regional Statistics (database), https://doi.org/10.1787/region-data-en.
Most business establishments in Poland are located in municipalities inside FUAs
In line with the income distribution across Poland, municipalities inside FUAs concentrate most of the business establishments in the country (66%). Particularly, big municipalities inside FUAs host the large majority of establishments (54%), followed by small municipalities outside FUAs with high accessibility (16%). Yet, the relatively high growth of establishments in small municipalities inside FUAs underlines their economic dynamism and population growth. As the next chapters of this review will underline, placed-based policies on business development should acknowledge this differentiated picture across the territory by providing targeted support to small- and medium-sized enterprises (SMEs) and entrepreneurship as well as a good business environment for large companies in the right places.
The great majority are micro-business establishments
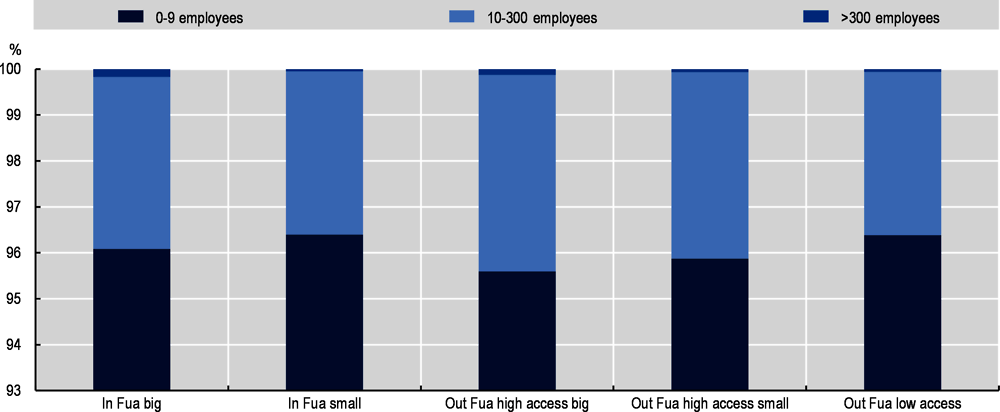
Business establishments with a maximum of 9 employees are the most common type of establishment across all Polish municipalities (96.1% of total business establishments). In the last decade, as in most OECD countries, Poland has experienced a reduction in large establishments (-1.3% annual average between 2009 and 2018), particularly across municipalities outside FUAs with low accessibility (-2%). Small municipalities inside FUAs and outside FUAs with low accessibility hold the largest share of micro-business establishments (96.4%). In contrast, big municipalities in FUAs and outside FUAs with high accessibility concentrate a relatively higher share of large establishments (over 300 employees) (Figure 1.19).
Note: Access refers to access to FUAs.
Source: Statistics Poland (2020[10]), Regional Statistics, https://stat.gov.pl/en/regional-statistics/ (accessed on 15 November 2020).
Small municipalities experience the largest growth of business establishments
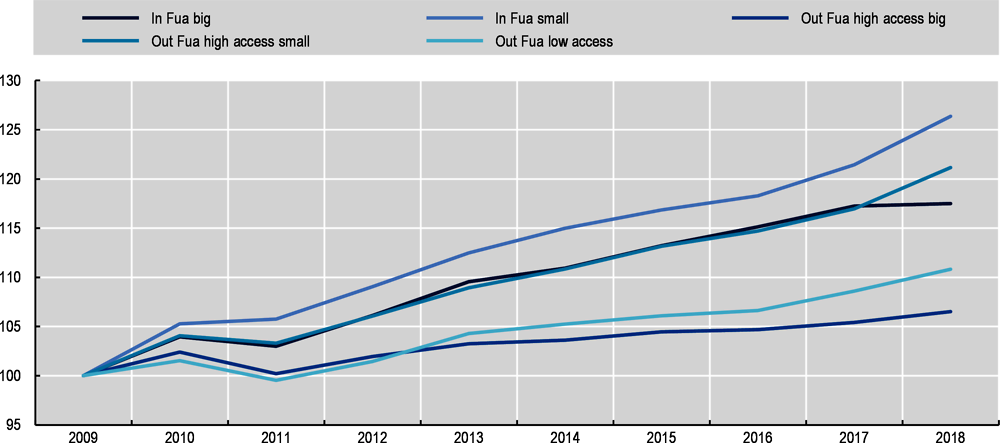
In the last decade, small municipalities both inside and outside FUAs with high access have experienced the largest growth in business establishments across Poland (Figure 1.20). Between 2009 and 2018, small municipalities in FUAs experienced the largest growth in the number of business establishments (14% annual average), followed by small municipalities outside FUAs with high accessibility (10%).
The business demography in Polish municipalities reveals the relevance of small and micro enterprises for the local economy. Co-ordinated policies to enhance growth and reduce the vulnerability of small and micro companies should be a priority to support municipal economies. It is particularly relevant for municipalities outside FUAs with low accessibility, where links to external markets is limited and the local economy is shrinking due to the depopulation trend. As the current crisis has shown, small companies are largely vulnerable to external shocks and require specific policies to facilitate access to capital and markets, and upscale capacity (OECD, 2020[19]).
Note: 100=2009. Access refers to access to FUAs.
Source: Statistics Poland (2020[10]), Regional Statistics, https://stat.gov.pl/en/regional-statistics/ (accessed on 15 November 2020).
In conclusion
Poland has experienced great economic improvement after it acceded to the EU (2004), which raised income and reduced unemployment at the local level. Productivity, particularly in FUAs, and the demographic premium have supported Poland’s GDP per capita growth in the last two decades. Nevertheless, Poland’s economic performance masks high regional inequalities, which accelerated during the recovery phase of the 2008 financial crisis, led by an increasing concentration of income and population in large FUAs, particularly in Warsaw. This process has placed Poland as the second country with the largest regional inequality growth across OECD, between 2008 and 2017.
Economic structure across TL3 regions explains most of the divergences in productivity and growth. Productivity in all TL3 regions in Poland remains below the average of OECD regions, especially in the case of remote regions in Poland, which stand out for their low level (40% below OECD figures). Indeed, metropolitan regions concentrate most of the total national GVA and the highest labour productivity in the country. Such a high productivity level in metropolitan regions is associated with greater specialisation in high-value-added service activities. In contrasts, non-metropolitan economies, particularly those of remote regions, are highly specialised in primary activities (agriculture and forestry).
Size and geographical location also play an important role in economic performance across municipalities. Those inside FUAs have lower levels of unemployment than municipalities outside FUAs and small municipalities inside FUAs stand out for their level of business creation. The distance penalty in business demography is noticeable across municipalities outside FUAs. Those outside FUAs with high accessibility experience higher growth in business establishments (1.4% annual average) than the municipalities outside FUAs with low accessibility (1.2%).
While the economic performance of FUAs has driven much of Poland’s economic growth, increasing regional inequalities can bring social unrest, boost the cost of social policies and preclude opportunities to unlock growth across the territory. Policy strategies to increase productivity in non-metropolitan economies can translate into greater national income and local fiscal revenues to improve the provision of public services. As the next section will depict, supporting development across the whole territory relies on improving basic conditions and services at the local level, including access to health, education and quality infrastructure (broadband and roads).
Addressing the regional inequalities and low-growth rates of non-metropolitan regions requires LSGU co-ordination. Long-term growth strategies designed and implemented in isolation obviate synergies among neighbouring economies and association opportunities to reach greater economies of scale. Shared policies targeting entrepreneurship and SMEs in municipalities outside FUAs, as well as strategies to enhance the links among providers and large companies within sound local value chains, can improve Poland’s business ecosystems, boost knowledge transfer and create competitive industries. A number of strategies to improve such co-ordination will be discussed in the following chapters.
A snapshot of quality of life in Poland
Quality of life is important for LSGUs in Poland, in particular for retaining and attracting people and businesses. Due to the lack of data availability to compare well-being internationally at the municipal level, the analysis presented in this section describes the well-being at the regional level by adopting the OECD Regional Well-Being framework to compare quality of life in TL2 regions (voivodeships) in Poland to the OECD TL2 region average (Box 1.1).
The OECD framework for measuring regional well-being focuses on informing about people’s lives rather than on means (inputs) or ends (outputs). In this way, policies are directed to well-being features that can be improved by policies. Helping evaluate how well-being differs across TL2 regions, regional well-being indicators are multi-dimensional (material and quality of life dimensions). They also recognise the role of citizenship, institutions and governance in shaping policies and outcomes.
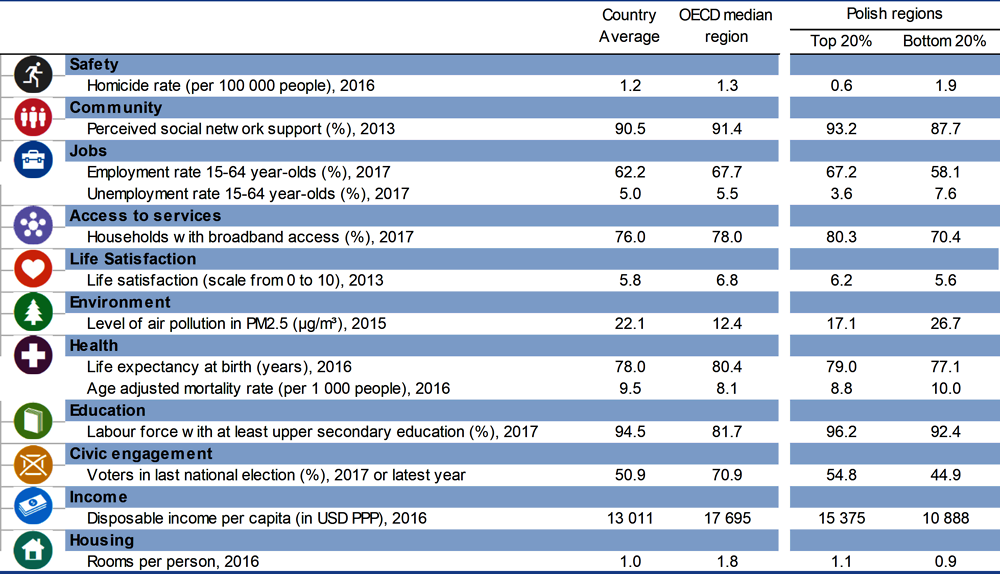
Although well-being dimensions are measured separately, the regional well-being framework aims to allow for comparisons and interactions across multiple dimensions. Regional well-being in Poland is measured along 11 well-being dimensions (Figure 1.21) – for which there are comparable statistics at the regional level.
Source: OECD (2018[20]), OECD Regional Well-Being (database), www.oecdregionalwellbeing.org (accessed on 10 June 2020)
Poland’s economy has converged towards OECD average income levels since EU accession, which translated into significant economic and social improvements. TL2 regions in Poland stand out in two OECD well-being dimensions across OECD countries – safety and education – and rank at similar levels with the OECD average on three dimensions: accessibility to services, community network and jobs. However, the effects of economic growth have not been similar across all types of regions and TL2 regions in Poland still lag in a number of well-being areas against the OECD average: housing, civic engagement, life satisfaction, health and income (Figure 1.22).

Note: Relative ranking in the regions with the best and worst outcomes in the 11 well-being dimensions with respect to all 402 OECD regions. The 11 dimensions are ordered by decreasing regional disparities in Poland.
Source: OECD (2018[20]), OECD Regional Well-Being (database), www.oecdregionalwellbeing.org (accessed on 10 June 2020)
TL2 regions in Poland, on average, outperform OECD regions in the following dimensions:
Safety. The average homicide rate (per 100 000 inhabitants) in TL2 regions in Poland (1.2 in 2017) is almost half the average level across the OECD (2.2). Małopolskie (0.5) and Wielkopolskie (0.6) have the lowest homicide rate in the country and rank among the top 20% OECD regions with better outcomes in this dimension.
Education. Thanks to a longstanding tertiary education boom, Poland has a highly qualified workforce that has successfully integrated into global trade and placed the country as an outsourcing destination for high-value-added business services (OECD, 2019[14]). All 17 TL2 regions in Poland rank among the top 25% of OECD regions in terms of share of the labour force with at least secondary education. Śląskie (96.2%) and Małopolskie (96.1%) are the best performing TL2 regions in the country, ranking among the top 5% of OECD regions.
In contrast, the three well-being dimensions where TL2 regions in Poland present a lower performance than OECD regions are:
Housing availably. Polish households spend a higher share of their incomes on housing, including utility costs and maintenance, than the OECD average (OECD, 2018[15]). TL2 regions in Poland face difficulties in offering enough housing to people and all TL2 regions rank among the bottom 20% of OECD regions in terms of the number of rooms per person (1 vs. 2 in OECD countries).
Civic engagement. TL2 regions in Poland have a lower share voter turnout (62% in the parliamentary election of 2019) than the OECD average (69%). Citizen participation in public policy design has scope for improvement, particularly when it comes to participation in the elaboration of spatial plans or strategy building (OECD, 2018[1]). Volunteering through an organisation (termed “formal volunteering”) is also less common in Poland (19.4% of the working-age population reporting a formal engagement in volunteering) than across OECD countries (34.2%) (OECD, 2018[1]).
Health. TL2 regions in Poland face a high level of air pollution (level of PM2.5 at 22.1 µg/m³) and have a lower life expectancy (78 years old) than OECD regions (13.3 µg/m³ and 81 years old of life expectancy). In 2015, more than 28 000 people died prematurely as a result of outdoor air pollution, which as a share of the population is higher than almost anywhere else in the OECD (OECD, 2018[15]). Access to quality health is also an issue as health services in sparsely populated municipalities are usually provided by one general practitioner and a nurse, with some areas only having branches of public healthcare centres (OECD, 2018[1]).
Municipalities outside FUAs have the lowest rate of education enrolment
Despite relatively high levels of education in the Polish workforce, there exist some disparities at the municipal level in terms of access to primary and secondary education. Municipalities outside FUAs with low accessibility have the lowest enrolment rate in primary school (85% in 2017). Surprisingly, small municipalities in FUAs also experience a low enrolment rate (85%) compared to other types of municipality, revealing a gap in education access within FUAs. The picture is similar when it comes to enrolment rates in secondary school, where the same types of municipalities face higher challenges on secondary enrolment (Figure 1.23. ).

Note: Access refers to access to FUAs.
Source: Statistics Poland (2020[10]), Regional Statistics, https://stat.gov.pl/en/regional-statistics/ (accessed on 15 November 2020).
Infrastructure has scope for improvement
Investment in infrastructure improves accessibility to local, national and international foreign markets, facilitates public service delivery and reduces the cost of the flow of technology and movement of labour. In Poland, investing in quality infrastructure and accessibility is not only a matter of economic outcome but is linked with the need to improve well-being and reduce the regional income disparity.
TL2 regions in Poland need to increase broadband accessibility
The share of households connected to broadband in Poland (78% in 2017) is below the OECD (81%) and European (85%) averages (Figure 1.24). Poland has an important disparity in terms of broadband access across TL2 regions. By 2017, 15 out of the16 TL2 regions, with data in Poland for that year, had lower broadband connectivity than the OECD average. While Podkarpackie and Pomorskie regions had more than 80% of their households connected to the Internet, almost 9 TL2 regions experience connectivity rates below 75%. Increasing the connectivity across all types of TL2 regions is thus a pressing need for Poland as it is nowadays a basic infrastructure to access markets, services and unlocks new job opportunities (OECD, 2018[21]).
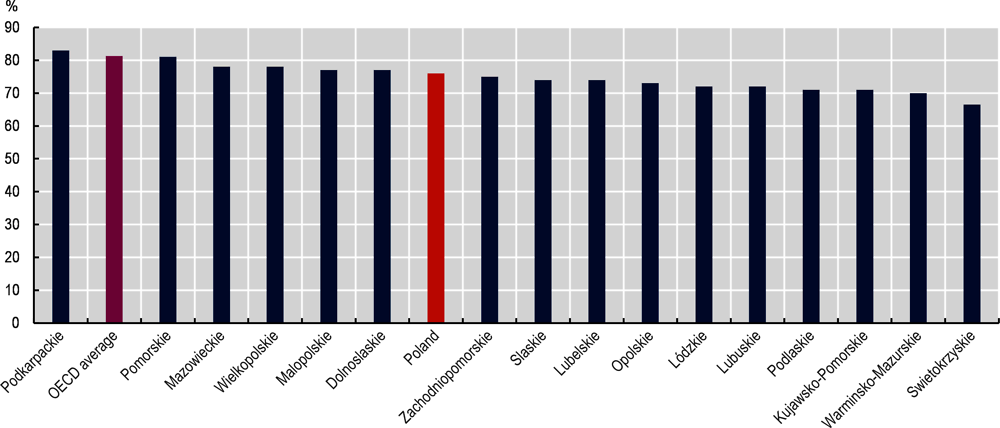
Note: Since 2018, Mazowieckie Voivodeship was statistically divided into 2 TL2 regions, creating 17 TL2 regions in the country for statistical purposes. Data of broadband is is from 2017 to include all OECD countries.
Source: OECD (2018[20]), OECD Regional Well-Being (database), www.oecdregionalwellbeing.org; Eurostat (2020[8]), Regional Information Society Statistics.
Transport infrastructure
Poland has a lower share of road and motorways in the territory for European standards. Similarly to the trend in European countries, most people in Poland commute by car (77% in 2016 vs. 80% in EU28) (Statistics Poland, 2020[22]). The motorway density in the country (5 km of motorway per 1 000 km2) is far below the European average (21 km). Municipal roads represent 59% of Poland’s road network (measured in length of km), followed by county roads (29.5%) and regional roads (6.9%).
Poland has scope to enhance quality infrastructure as the country ranks among the bottom ten at the European level in terms of road quality (EC, 2018[23]). By 2017, only 58.1% of the national roads were in a good condition, with many in poor condition with resistance issues (Statistics Poland, 2020[22]). While most public roads have a hard surface (paved) (71.0%), a remaining share is still unpaved/soil surfaces (29%).
There is a territorial disparity in terms of road quality in Poland. Municipal roads exhibit the greatest share of unpaved roads (54.8% in 2017), in comparison with counties (8% of soil roads) and regional (0.1%) roads. At the regional level, the TL2 regions in Poland with the best road conditions in the country, Śląskie (176.8 km of paved roads per 100 km2) and Małopolskie (170.6 km), have more than double the share of paved roads of the worst-off TL2 regions Warmińsko-mazurskie (56.4) and Zachodniopomorskie (61.2) (Statistics Poland, 2020[22]). At the TL3 level, 26 out of the 73 TL3 regions in Poland have more than 50% of their road network unsurfaced. Most of them are non-metropolitan regions located in the north of the country (Figure 1.25).
Access to all types of transport infrastructure is also unequally distributed across the territory. As identified by the OECD (2018[1]), approximately 38.2% of the population has access to a major highway and railway stations within a 30-minute drive and an airport within a 60-minute drive, while 17.1% has no access to any of these transport modes within the 30-minute (or 60-minute for air) interval. The remaining share of the population has access to only one type of transport mode in the defined timespan. The voivodeships with the highest percentage of people with access to all 3 modes are Pomorskie and Śląskie, with about 63%. On the other hand, in three voivodeships (Dolnośląskie, Podlaskie and Warmińsko-Mazurskie), the population does not have access to any of three transport modes within the given time limits.
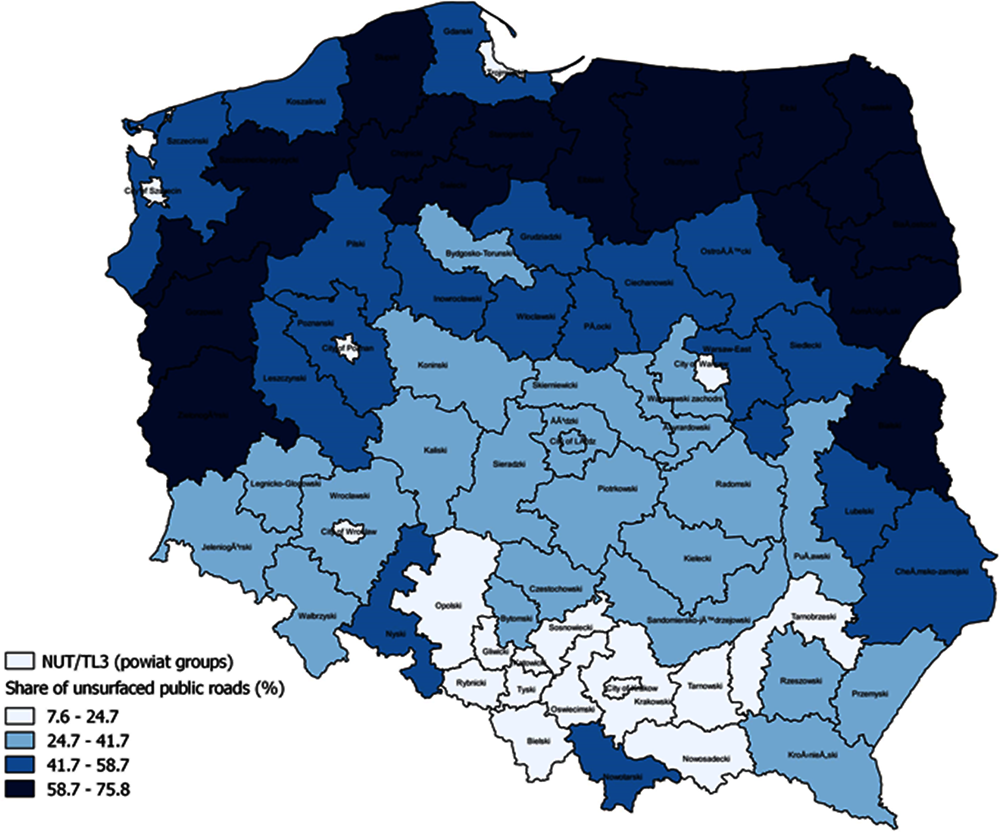
Source: Statistics Poland (n.d.[24]), Transport and Communications, https://bdl.stat.gov.pl/BDL/dane/podgrup/temat (accessed on 15 July 2020).
In conclusion
The convergence of Poland’s economy towards OECD average levels has boosted quality of life in the country. On one hand, the effects from economic gains have not been homogenous across the territory and TL2 regions in Poland still lag in a number of well-being areas in comparison to other OECD countries. On the other hand, TL2 regions in Poland stand out across OECD countries for their safety and workforce education levels. Yet, access to education presents disparities at the municipal level, with municipalities outside FUAs experiencing the lowest rates of enrolment in primary and secondary schools.
Several factors collectively shape welfare and a large number of them are under-performing in TL2 regions in Poland compared to OECD countries: housing availability, civic participation, health, life satisfaction and income. Polish households spend a higher share of their income on housing (utility costs and maintenance) than the OECD average (OECD, 2018[15]). In terms of civic engagement, TL2 regions in Poland have a relatively lower share of voter turnout in comparison to the OECD average. Citizen participation in public policy design also has scope for improvement when it comes to participation in the elaboration of spatial plans (OECD, 2018[1]). In terms of health, TL2 regions in Poland face a high level of air pollution (PM2.5 at 22.1 µg/m³) and have a lower life expectancy (78 years old) than OECD regions (13.3 µg/m³ and 81 years old). Likewise, Poland has the scope to improve and reduce regional disparity in broadband accessibility and road quality.
Improving quality of life for all municipalities in Poland requires a co-ordinated approach to provide housing solutions and quality health services for the population. Harmonisation among municipalities of plans on public services is even more relevant in a context of population decline, where finding economies of scale for those investments is a pressing issue. Similarly important is the co-ordination with national strategies to enhance broadband and transport infrastructure, particularly for municipalities outside FUAs.
Poland is the sixth-largest country in the European Union (EU27) in land area (312 679 km2) and fifth largest by population (38.4 million). Poland’s population density (123 inhabitants/km2) is however below European countries with a similar land area (Germany: 232 inhabitants/km2 or Italy: 200) and its settlement patterns exhibit a relatively low geographic concentration across TL2 regions in comparison to countries of the EU and the OECD. Poland’s territorial administrative structure is relatively new (in force since 1999) with a 3-tier self-government administration system composed of 16 voivodeships (regional self-government units), 380 counties (LSGUs including 314 counties and 66 cities with county status) and 2 477 municipalities including rural, urban and urban-rural municipalities).
Following a new OECD typology to classify municipalities in Poland, based on economic criteria and functional characteristics such as geographic location (inside and outside FUAs), population size (big and small) and degree of accessibility, among other things, to enable comparison across OECD member states, the report’s first chapter identifies important findings for TL2 and TL3 regions in Poland, FUAs and municipalities.
Unlike most OECD countries, Poland has a rather balanced population distribution across TL3 regions, which can lead to important development hubs for the country. According to the OECD regional typology, the share of Poland’s population in non-metropolitan regions (49%) is far above the average across OECD countries (29%). At the local level, big municipalities inside FUAs (42%) and small municipalities outside FUAs with high accessibility (24%) host most of the population. While develoment hubs creates challenges in terms of economies of scale and delivery of public service, it can also bring benefits to unlock development poles for non-metropolitan hinterland and promote national growth through rural-urban linkages. Mobilising these opportunities and addressing the challenges of a dispersed population requires strong co-ordination among LSGUs in investment and planning, with a territorial approach, as well as across and between types of government. Taking advantage of these opportunities also requires harmonised monitoring and evaluation mechanisms to adapt strategies to future demographic changes.
Poland’s relatively large stock of working-age population has supported the country’s economic performance in recent decades. Most of the workforce is currently concentrated in metropolitan regions with medium- and small-sized FUAs (35.4%),1 which underlines the relative dispersion of population in the country and contrasts with the OECD average in which large metropolitan region concentrate most of the working-age population. Poland’s non-metropolitan regions stand out for having the fifth-lowest elderly dependency ratio (25.4%) across OECD non-metropolitan regions. At the local level, big municipalities in FUAs host the largest share of the country’s working-age population (41%), followed by small municipalities outside FUAs with high accessibility.
Nevertheless, the balanced population distribution is set to change, as FUAs increasingly attract most of Poland’s population and non-metropolitan regions (especially remote ones) face a sharp population decline. Since 2015, Poland has consecutively ranked among the ten countries with the highest population decline across the OECD. Poland’s population decrease is associated with a negative natural population growth (lower number of births relative to deaths), which is not compensated by the net migration rates into the country (positive but low). In fact, Poland’s fertility rate (1.4 children per women) ranks among the tenth- and sixth-lowest across OECD and EU countries respectively.
The largest drop in population occurred, on average, in non-metropolitan regions (-2.5% from 2001 to 2019), while metropolitan regions have recorded a slight increase (0.95% for the same period). At the municipal level, municipalities outside FUAs, particularly those with low accessibility,2 are the ones facing the largest population decrease. In contrast, small municipalities inside FUAs experience the greatest population growth in the country (0.5% per year), mainly driven by the inflow of people from other municipalities. Between 2000 and 2018, municipalities inside FUAs were the net receivers of the population in Poland, while all municipalities outside FUAs experienced net population outflows, mainly from women (58%).
Poland’s population concentration trend in FUAs is taking place at a low pace, which can be beneficial for planning purposes. In particular, municipalities in FUAs, both counties and municipalities, can benefit from the relatively slow urbanisation growth in order to develop long-term plans that harness the benefits from agglomeration economies (e.g. economies of scale and knowledge exchange), while addressing negative externalities (i.e. congestion, higher housing prices and longer commuting times). As Chapters 2, 3 and 6 of the report outline, addressing these issues requires co-ordination among levels of government and among types of sectoral policy (e.g. transport and housing).
Along with outmigration, a combination of rapid ageing and low levels of youth population replacement threaten the age premium of Poland’s workforce. Unlike the OECD average trend, Poland’s elderly dependency ratio is similarly distributed between metropolitan and non-metropolitan regions. Big municipalities inside FUAs record the largest elderly dependency ratio in the country (26% in 2018) with the fastest growth in the country. In contrasts, small municipalities inside FUAs have the lowest elderly dependency ratio (20%) and the lowest growth of this ratio among all types of municipalities.
Poland also faces a relatively small workforce replacement with a lower share of youth population (12%) than the OECD average (15%). Likewise, FUAs in Poland have a lower youth dependency ratio (23%) than the OECD average (27%). The net result in the last two decades (since 2000) is a drop in the youth population share across all municipalities, especially in those outside FUAs with low accessibility.
The decreasing and ageing population, especially in municipalities outside FUAs, represents an important policy and governance challenge for Poland. Without the right policy, planning and governance arrangements in place, this demographic trend can lead to a number of negative impacts for local economies, including a shortage of labour to support economic growth, increasing cost of public service provision and a reduced tax base. Addressing this challenge should include co-ordinating policies to support population growth (e.g. access and affordability of childcare facilities and reducing the initial cost of having a child) without discouraging female labour supply, coupled with strategies to increase immigration. As the report explores in detail, municipalities should also co-ordinate policies, including targeted immigration programmes, to avoid labour competition at the local level, to retain youth and attract new residents. Enhancing enabling factors for development, labour participation and education can also help municipalities to leverage economic growth.
Poland has been closing the income gap with OECD countries, yet wealth has not been equally distributed across TL3 regions in Poland. Poland has experienced great economic improvement after its accession to the EU (2004), which raised income and reduced unemployment at the local level. Productivity, particularly in FUAs, and demographic premium have supported Poland’s GDP per capita growth during the last two decades.
Nevertheless, Poland ranks among the top five OECD countries with the greatest regional economic disparity, which, as in other OECD countries, further increased after the 2008 economic crisis. Between 2008 and 2017, Poland registered the second-highest growth rates in regional disparity within the OECD. The majority of the top 10% of richest TL3 regions in Poland are large and metropolitan regions (82%), while all regions within the country’s poorest 10% are non-metropolitan.
Metropolitan regions have the greatest labour productivity in Poland. As in several OECD countries, the bulk of Poland’s national economic wealth is found in metropolitan regions (56% of total national GVA). Divergence in productivity is partially associated with the type of economic structure in non-metropolitan economies in Poland. While metropolitan regions have a larger specialisation in service activities, non-metropolitan economies have a larger share of workers in primary activities (i.e. agriculture and forestry). This phenomenon underlines the need to increase productivity in non-metropolitan economies in Poland, especially in the agriculture sector.
At the local level, municipalities inside FUAs have attracted most firms and employed most of the population in Poland. Big municipalities in FUAs register the lowest unemployment rate (2.9%) across all types of municipality, followed by small municipalities in FUAs (3.7%). Likewise, most business establishments in Poland concentrate in big municipalities inside FUAs (54%). Yet, during the last decade, small municipalities both inside and outside FUAs with high accessibility have experienced the largest growth in business establishments across Poland.
While the economic performance of FUAs has driven much of Poland’s economic growth, increasing regional inequalities can bring social unrest, boost the cost of social policies and ultimately slow national economic growth. Policy and governance strategies to increase productivity in non-metropolitan economies can translate into greater national income and local fiscal revenues. Addressing regional inequalities and the low-growth rates of some non-metropolitan regions requires LSGU co-ordination around long-term growth strategies designed and implemented to boost synergies among neighbouring economies to reach greater economies of scale. Shared policies that target SMEs in municipalities outside FUAs aim to enhance the links between providers of resources, products and services and large enterprises. A number of strategies to improve such co-ordination are discussed in the next thematic chapters.
The Polish economy’s catching-up process has translated into improvements in some well-being dimensions across TL2 regions in Poland, particularly education and safety. Poland has experienced a boom in tertiary education, which has led to a highly qualified workforce, successfully integrated into global trade. All TL3 regions in Poland rank among the top 25% of OECD regions in terms of the share of the labour force with at least secondary education. Yet, disparities remain across municipalities, with those outside FUAs with low accessibility experiencing the lowest enrolment rate in primary and secondary schooling.
TL2 regions in Poland have scope to improve a number of well-being dimensions. This includes housing (lower accessibility than the OECD regional average), civic engagement (lower voter turnover than the OECD average) and health (higher level of air pollution and lower life expectancy than OECD regions on average). Particular attention should be given to improving the quality of and access to transport and ICT infrastructure as well as public transportation across all types of TL2 region. The quality of Poland’s roads is among the bottom 10 countries in Europe and the share of households connected to broadband in Poland (78% in 2017) is below the OECD (81%) and EU (85%) averages. The COVID-19 crisis has highlighted how crucial countries’ telecommunication networks are, with broadband being particularly relevant due to the increase in teleworking in several economic sectors.
Improving quality of life in all municipalities in Poland requires governance arrangements that strengthen a co-ordinated approach to provide housing solutions and quality health services for the population, among others. The harmonisation of plans and alignment of priorities on public services between LSGUs is even more relevant in a context of population decline, where finding economies of scale for those types of investments is a pressing issue. Similarly, the COVID-19 crisis has demonstrated the importance of co-ordination with national strategies to enhance broadband and transport infrastructure, particularly for municipalities outside FUAs, and is of particular importance to improve access to markets, services and unlock new job opportunities through better connectivity.
References
[23] EC (2018), World Economic Forum Global Competitiveness Report, European Commission.
[8] Eurostat (2020), Regional Information Society Statistics.
[25] Fadic, M. et al. (2019), Classifying small (TL3) regions based on metropolitan population, low density and remoteness, OECD Publishing, Paris, https://doi.org/10.1787/b902cc00-en.
[17] Fihel, A. and P. Kaczmarczyk (2013), Migracja a polski rynek pracy (Migration and the Polish Labour Market).
[7] Kurek, S. (2011), “Population changes in Poland: A second demographic transition view”, Procedia - Social and Behavioral Sciences, Vol. 19, pp. 389-396, https://doi.org/10.1016/j.sbspro.2011.05.146.
[19] OECD (2020), “Coronavirus (COVID-19): SME policy responses”, OECD Policy Responses to Coronavirus (COVID-19), OECD, Paris, http://www.oecd.org/coronavirus/policy-responses/coronavirus-covid-19-sme-policy-responses-04440101/.
[6] OECD (2020), OECD Labour Force Statistics, OECD Publishing, Paris, https://doi.org/10.1787/5842cc7f-en.
[9] OECD (2020), OECD Metropolitan Statistics (database), OECD, Paris.
[5] OECD (2020), OECD Regional Statistics (database), OECD, Paris, https://doi.org/10.1787/region-data-en.
[2] OECD (2020), “Regional demography”, OECD Regional Statistics (database), https://doi.org/10.1787/a8f15243-en.
[18] OECD (2020), Regional Statistics, OECD, Paris, https://stat.gov.pl/en/regional-statistics/ (accessed on 15 November 2020).
[4] OECD (2020), Rural Well-being: Geography of Opportunities, OECD Publishing, Paris, https://doi.org/10.1787/d25cef80-en.
[14] OECD (2019), Economic Policy Reforms 2019: Going for Growth, OECD Publishing, Paris, https://doi.org/10.1787/aec5b059-en.
[3] OECD (2019), OECD Survey - Polish Municipalities, OECD, Paris.
[13] OECD (2019), Pensions at a Glance 2019: OECD and G20 Indicators, OECD Publishing, Paris, https://dx.doi.org/10.1787/b6d3dcfc-en.
[21] OECD (2018), “Bridging the rural digital divide”, OECD Digital Economy Papers, No. 265, OECD Publishing, Paris, https://doi.org/10.1787/852bd3b9-en.
[15] OECD (2018), OECD Economic Surveys: Poland 2018, OECD Publishing, Paris, https://dx.doi.org/10.1787/eco_surveys-pol-2018-en.
[20] OECD (2018), OECD Regional Well-Being (database), OECD, Paris, http://www.oecdregionalwellbeing.org (accessed on 10 June 2020).
[16] OECD (2018), OECD Regions and Cities at a Glance 2018, OECD Publishing, Paris, https://dx.doi.org/10.1787/reg_cit_glance-2018-en.
[1] OECD (2018), OECD Rural Policy Reviews: Poland 2018, OECD Rural Policy Reviews, OECD Publishing, Paris, https://dx.doi.org/10.1787/9789264289925-en.
[12] OECD (2015), The Metropolitan Century: Understanding Urbanisation and its Consequences, OECD Publishing, Paris, https://dx.doi.org/10.1787/9789264228733-en.
[11] OECD/EC (2020), Cities in the World: A New Perspective on Urbanisation, OECD Urban Studies, OECD Publishing, Paris, https://dx.doi.org/10.1787/d0efcbda-en.
[10] Statistics Poland (2020), Regional Statistics, https://stat.gov.pl/en/regional-statistics/ (accessed on 15 November 2020).
[22] Statistics Poland (2020), Road Transport in Poland in the Years 2016 and 2017, Centre for Transport and Communications Statistics.
[24] Statistics Poland (n.d.), Transport and communications, https://bdl.stat.gov.pl/BDL/dane/podgrup/temat (accessed on 15 July 2020).
Notes
← 1. Metropolitan regions are TL3 regions where 50% of the population live in a FUA of more than 250 000 inhabitants and fewer than 1.5 million inhabitants (e.g. Bielsk, Kraków or Poznań). These regions differ from large metropolitan regions, which refer to TL3 regions where more than 50% of the population live in a FUA of at least 1.5 million inhabitants (e.g. Katowice, city of Warszawa).
← 2. Accessibility is measured as the distance from the municipality to a FUA. If more than 60 minutes are required to drive to a FUA, then it is considered low accessibility. Otherwise, if a municipality outside a FUA is less than a 60-minute drive from a FUA, it is considered high accessibility.