copy the linklink copied!Life expectancy
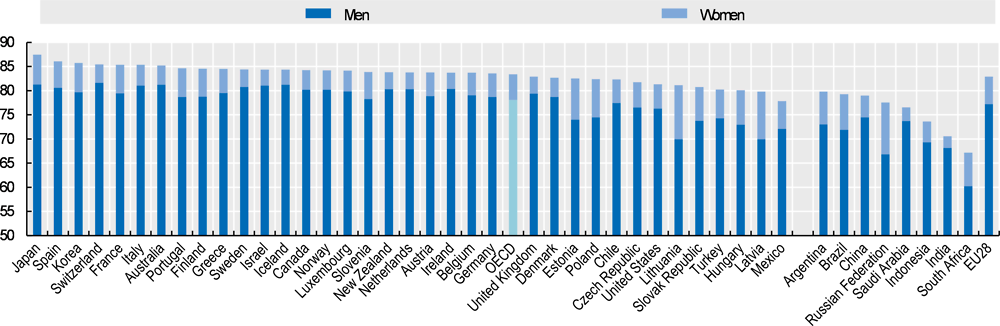
The remarkable increase in life expectancy is one of the greatest achievements of the last century. Lives continue to get longer, and this trend is predicted to continue although the pace of improvement in old age has slowed slightly. In 2015-20, life expectancy at birth averaged 78.1 years for men and 83.4 years for women. Among women, the figure was highest in Japan (87.5 years) and lowest in Mexico (77.8 years). For men, life expectancy at birth was highest in Switzerland (81.6 years) and lowest in Latvia and Lithuania (69.9 and 70.0 years, respectively). On average across OECD countries, remaining life expectancy at age 65 is projected to increase by 3.9 years among women and 4.5 years among men by 2065.
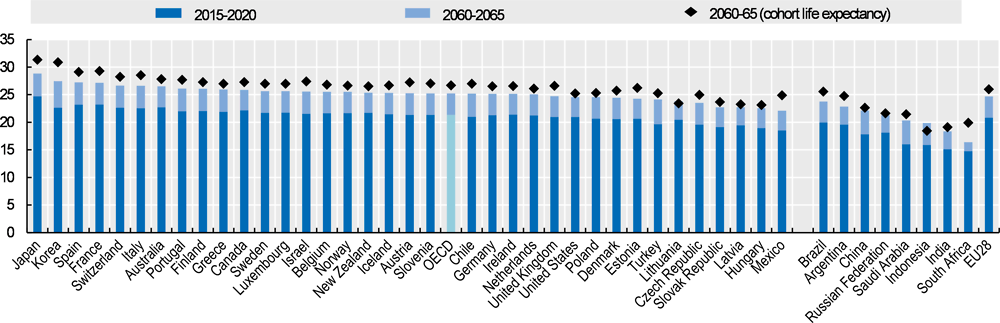
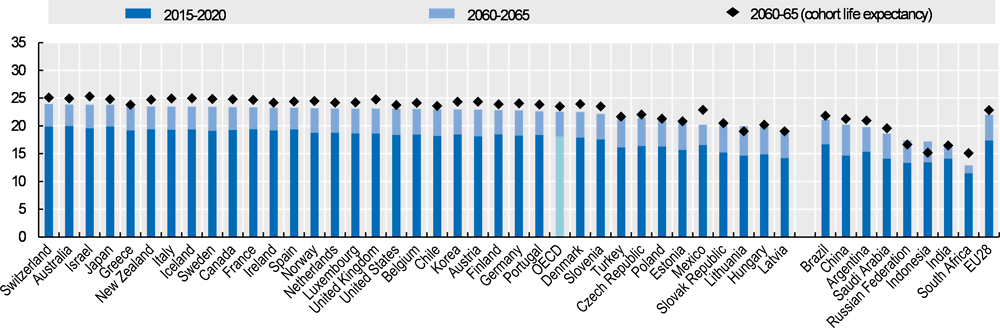
Remaining life expectancy at 65 significantly contributes to wellbeing at older ages. It also influences the finances of retirement-income systems. In 2015-20, on average in OECD countries, women aged 65 could expect to live an additional 21.3 years, which is forecast to increase to 25.2 years by 2060-65. Men of the same age could expect to live 18.1 more years in 2015-20, with a projected increase of 4.5 years by 2060-65 to reach about 22.5 years. Gender gaps are therefore expected to decrease slightly over the next 45 years (from 3.3 to 2.7 years on average in OECD countries). The improvement in remaining life expectancy at age 65 will slow a little. It increased from 13.7 years in 1955-1960 to 15.9 years in 1985-1990 before accelerating to 19.8 years in 2015-2020 in the OECD on average. It is expected to rise further to 22.6 years in 2045-2050 (Figure 1.4, Panel A in Chapter 1).
There is considerable variation between OECD countries in life expectancy at older ages. Women in Japan are predicted to live another 28.8 years on reaching age 65 in 2060-65, followed by Korea (27.4 years). In contrast, women in Mexico are expected to live an extra 22.1 years.
For men there is less variation between countries than there is for women. Switzerland will have the longest life expectancy at age 65 in 2060-65 (23.9 years), followed by Australia, Israel and Japan (23.8 years). By contrast, Latvia (19.2), Lithuania and Hungary (both 19.9) are ranked at the bottom.
The gender gap in life expectancy at age 65 is predicted to be between almost two and four years in favour of women in nearly all OECD countries in 2060-65. Larger gender gaps of 4.5 to 5 years are observed in both Japan and Korea. The smallest gender gap are forecasted for the United States and the United Kingdom at 1.5 and 1.7 years respectively.
Given this trend, many OECD countries have increased or legislated to increase their pension benefit eligibility ages: see Chapter 1 on “Recent Pension Reforms”. Others have introduced elements into their retirement-income provision that will automatically adjust the level of pensions as people live longer. Overall longevity gains are due to rising living standards, but also greater access to quality health services.
Turning to the non-OECD major economies, life expectancy is generally lower than the OECD average. Life expectancy at birth is by far the lowest in South Africa at 60.2 years for men and 67.1 years for women. The highest life expectancy at birth is found in Argentina for women at 79.8 years and in China at 74.5 years for men. Life expectancy at 65 is the lowest for South African women (14.7 years) and men (11.5 years). By 2060-65 those aged 65 will live longest in Brazil at 23.7 years for women and 21.1 years for men.
The above numbers refer to period life expectancy, which measures life expectancy (current or projected) based on mortality rates for people of different ages at a given time (2015-20 or 2060-65 here) that hence belong to different birth cohorts. By contrast, cohort life expectancy is based on the projected mortality rates that would apply to the same birth cohort at different ages. It thus takes account of continuing improvements (after 2015-20 or 2060-65) that would benefit a given birth cohort. On average, these cohort estimates add 1.5 years for women aged 65 in 2060-65 and 1.0 years for men.
Definition and measurement
Life expectancy is defined as the average number of years that people of a particular age could expect to live if they experienced the age- and sex-specific mortality rates prevalent in a given country in a particular year: in this case, 2015-20 and 2060-65. Since the determinants of longevity change slowly, life expectancy is best analysed over a long time horizon. Cohort life expectancy takes account of the projected changes in mortality estimates for a given cohort.
Further Reading
OECD (2017), Preventing Ageing Unequally, OECD Publishing, Paris, https://doi.org/10.1787/231747416062.
Whitehouse, E.R. (2007), "Life-expectancy Risk and Pensions: Who Bears the Burden?", OECD Social, Employment and Migration Working Paper No. 60, OECD Publishing, Paris, https://doi.org/10.1787/060025254440.
Note: Shown is period life expectancy that is based on mortality rates in a specific period, here 2015-2020, rather than to a specific birth cohort.
Source: United Nations, Department of Economic and Social Affairs, (2019). World Population Prospects 2019, Online Edition.
Source: United Nations, Department of Economic and Social Affairs, (2019). World Population Prospects 2019, Online Edition.
Source: United Nations, Department of Economic and Social Affairs, (2019). World Population Prospects 2019, Online Edition.
Metadata, Legal and Rights
https://doi.org/10.1787/b6d3dcfc-en
© OECD 2019
The use of this work, whether digital or print, is governed by the Terms and Conditions to be found at http://www.oecd.org/termsandconditions.