Chapter 1. Tackling Italy’s social and regional divide
Disparities in income and well-being in Italy are large, and follow regional lines more closely than in most OECD countries. Differences in employment rates, especially among women, explain much of regional disparities, while differences in labour productivity play a smaller but not negligible role.
These problems, long-standing and deep-rooted, are partly attributable to tax and benefit policies and labour market institutions, which discourage employment, especially of second earners in regions where wages and productivity are lower. The labour income tax wedge is high, curbing job creation, especially of low income jobs. At the same time, benefit policies offer little protection against poverty and labour market risks for many people. To redress this, the guaranteed minimum income scheme implemented in 2017 and 2018 and strengthened in 2019 through the Citizen’s Income is an important and welcome step. However, the success of this initiative will hinge on greatly enhancing job-search and training policies along with other social inclusion services. Fiscally sustainable reforms to tax and benefit policies should aim at maintaining progressivity, better supporting poor households, and encouraging labour force participation especially of low income workers, thus benefitting lagging regions.
Ineffective regional development policies and low efficiency of local public administrations in poorer regions contribute to regional disparities. Rationalising and improving coordination among the different bodies involved in regional development would make regional development policies more effective. Funds for regional development policies need to add to and not to substitute for those of ordinary administration. More effective regional development policies need to be flanked by initiatives aiming at raising the effectiveness of poorer performing local public administrations, thus enhancing the local provision of public goods and services, and better supporting disadvantaged households.
Italy’s large disparities in income and well-being follow regional lines
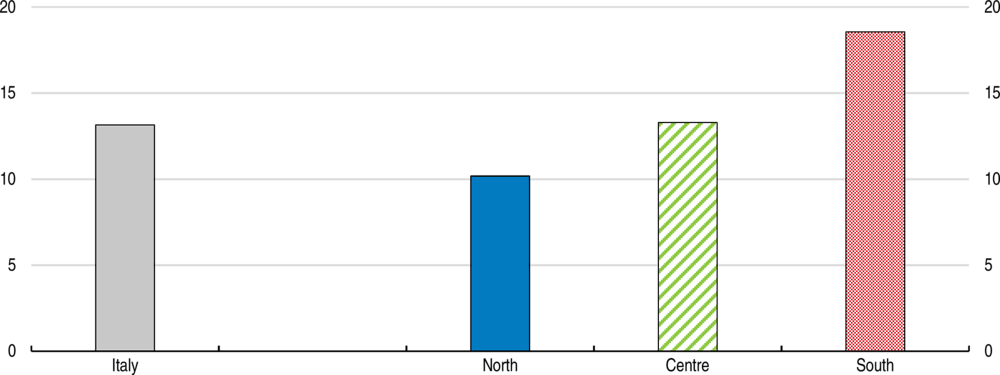
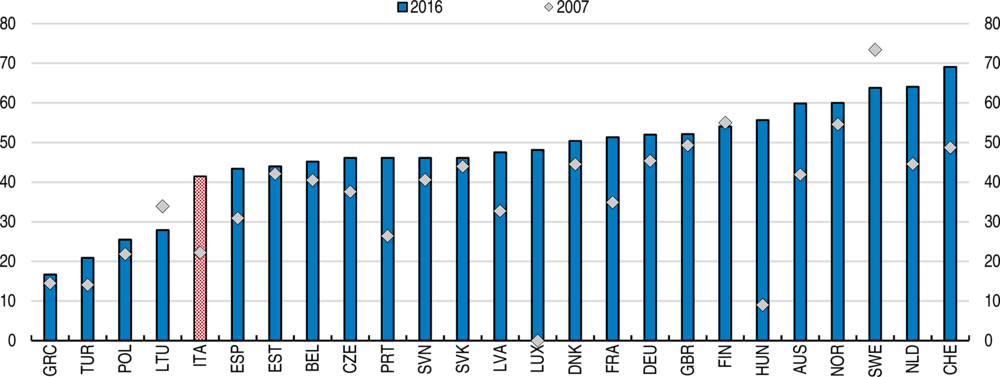
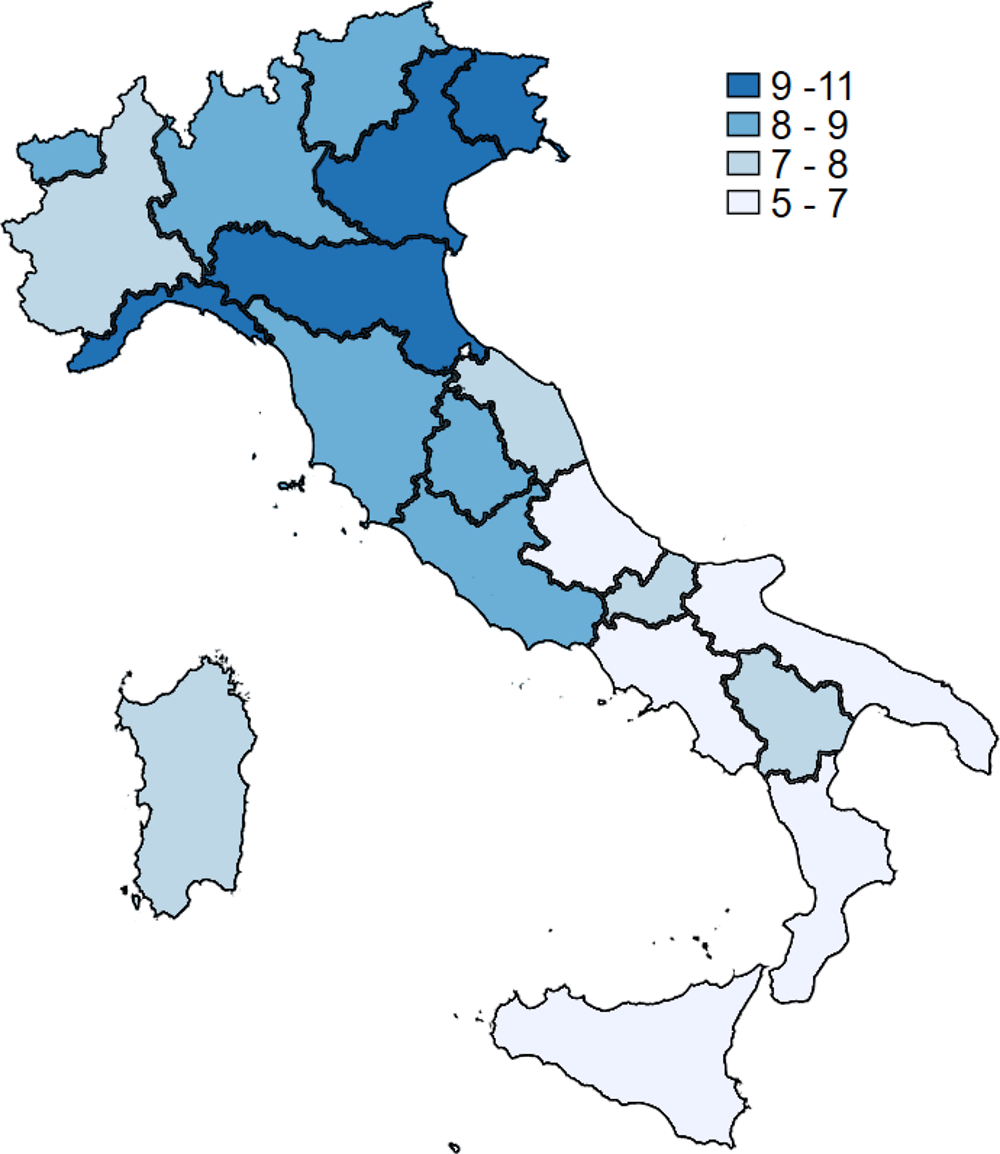
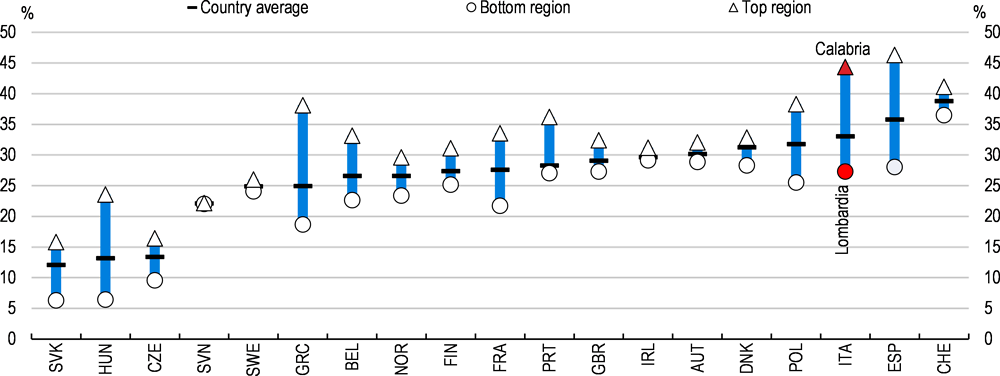
Italy’s social disparities are large. Italy’s well-being outcomes lag other OECD countries in several dimensions, as was presented in the Key Policy Insights. In Italy, social and economic disparities follow regional lines more closely than in other OECD countries (Figure 1.1). Regional disparities are especially marked for employment and income as well as safety, the environment and civic engagement. Regional disparities follow the historical north-south divide (Figure 1.2). Some regions in the South have among the lowest well-being outcomes across the OECD, while the best performing regions in the North are among the best performers in the OECD (Figure 1.3). Regional disparities are entrenched and in some dimensions, such as employment rates and relative poverty, they have widened over time (Figure 1.4).
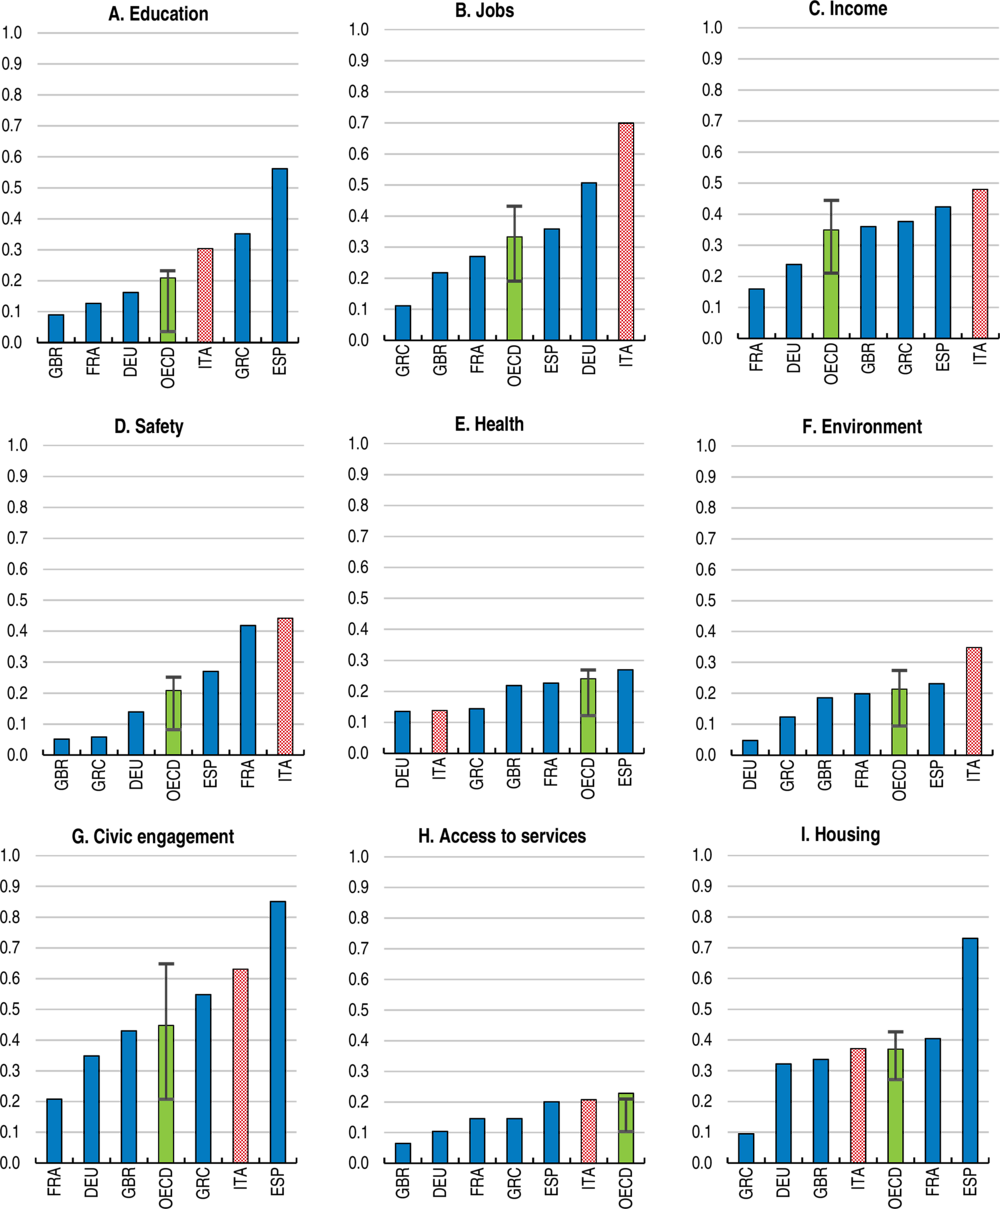
Note: The indicator measures the dispersion in components of the well-being index across regions within a country. For each dimension, countries with the lowest and the highest dispersion levels in the OECD take values 0 and 1 respectively. The value for OECD is an unweighted average across the 31 available countries. The 25th and the 75th percentiles of the distribution are also indicated.
Source: Calculations based on OECD Regional Well-being database.
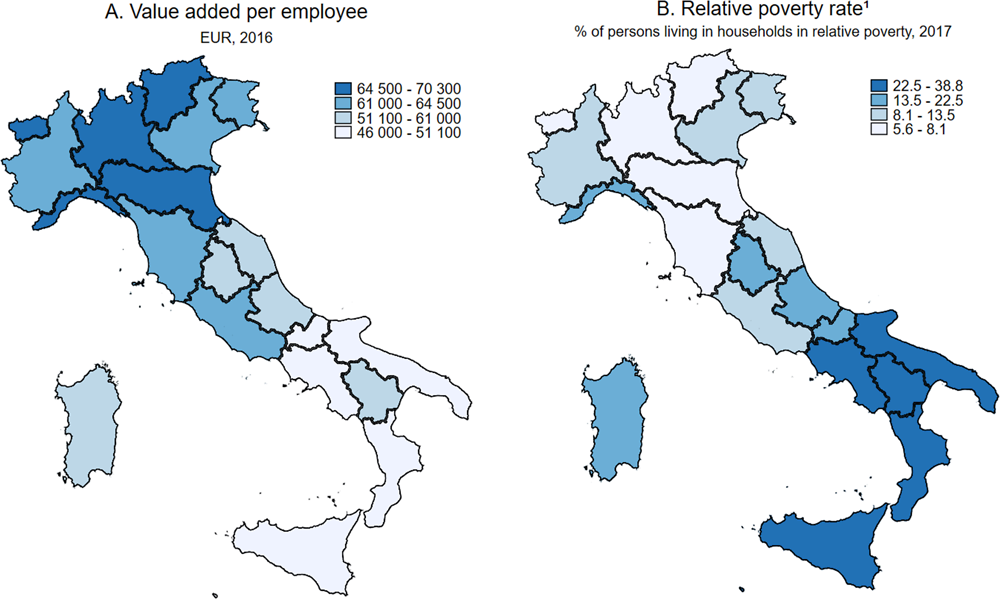
1. The ISTAT relative poverty rate is based on the International Standard Poverty Line. ISTAT uses the Carbonaro equivalence scale to adjust household size. The rate is the ratio between the number of individuals living in households in poverty and the number of resident individuals.
Source: ISTAT Regional database.
Note: Latest available year shown, either 2017, 2016 or 2015. The severe material deprivation rate is the proportion of the population living in households unable to afford at least four of the following items: unexpected expenses, a one-week annual holiday away from home, a meal involving meat, chicken or fish every second day, the adequate heating of a dwelling, durable goods like a washing machine, colour television, telephone or car, or are confronted with payment arrears.
Source: Eurostat Statistics on Income and Living Conditions database.
1. The ISTAT relative poverty rate is based on the International Standard Poverty Line. ISTAT uses the Carbonaro equivalence scale to adjust household size. The rate is the ratio between the number of individuals living in households in poverty and the number of resident individuals.
Source: ISTAT Regional database.
Improving prospects for disadvantaged social groups and lagging regions would generate large gains in national income and well-being. High and persistent regional inequalities in economic, social and well-being dimensions coupled with the lack of prospects and opportunities in lagging regions weaken social cohesion, fostering resentment and creating political tensions. This chapter identifies reform priorities of Italy’s tax and benefit system and regional development policies to foster access to jobs in the formal economy, boost work incentives and reduce poverty.
Regional dispersion in well-being is markedly higher than in income alone, (Figure 1.5). Using subjective measures of well-being, individuals in the South report lower well-being than those with the same income living in the Centre and North (D’Alessio, 2017[1]). This gap between regional dispersion measures of income and of well-being is larger in Italy than in most other OECD countries for which data are available (Veneri and Murtin, 2016[2]). All this points to the strong role played by factors other than income in determining large regional disparities in the quality of life in Italy.
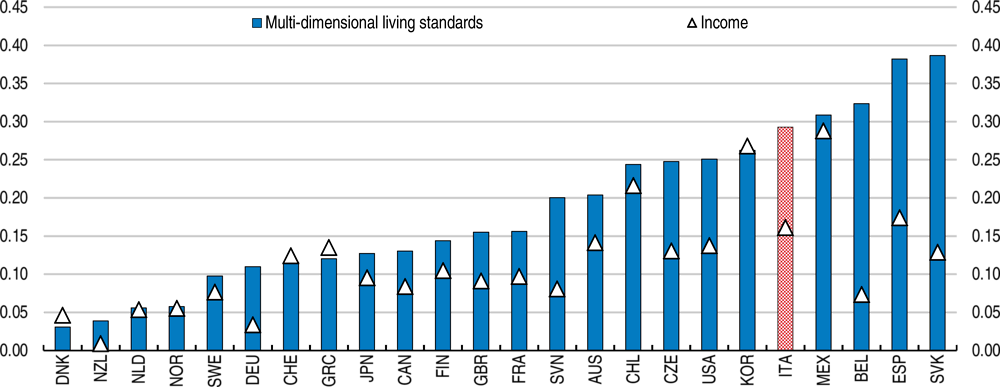
Note: Higher values mean larger disparities. The multi-dimensional living standards measure is a composite measure of regional income, unemployment and health.
Source: Veneri, P. and F. Murtin (2016), “Where is inclusive growth happening? Mapping multi-dimensional living standards in OECD regions”, OECD Statistics Working Papers, No. 2016/01
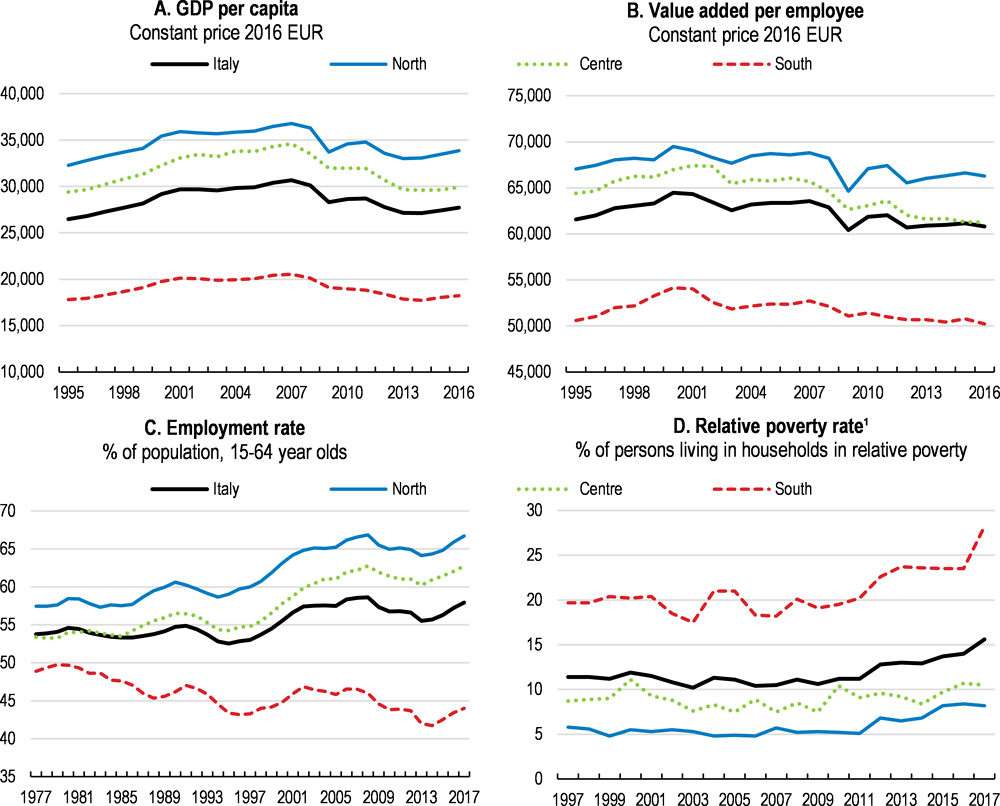
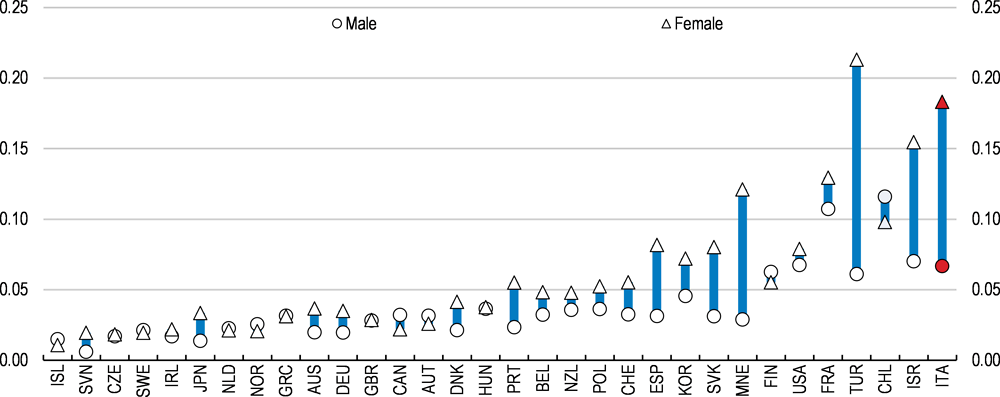
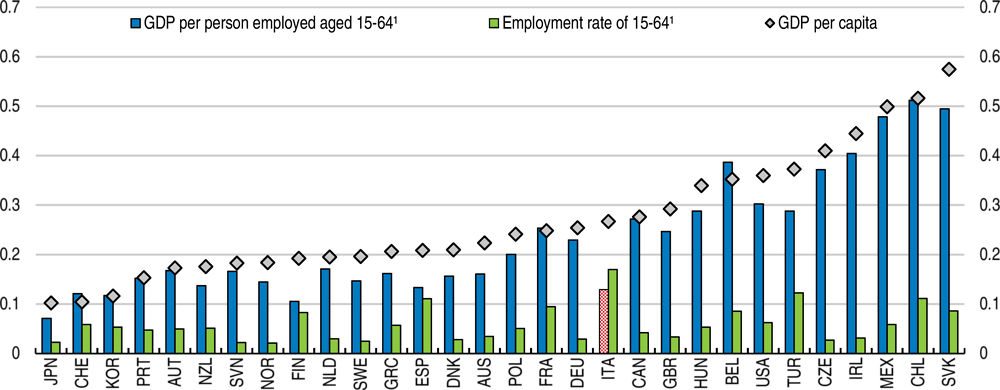
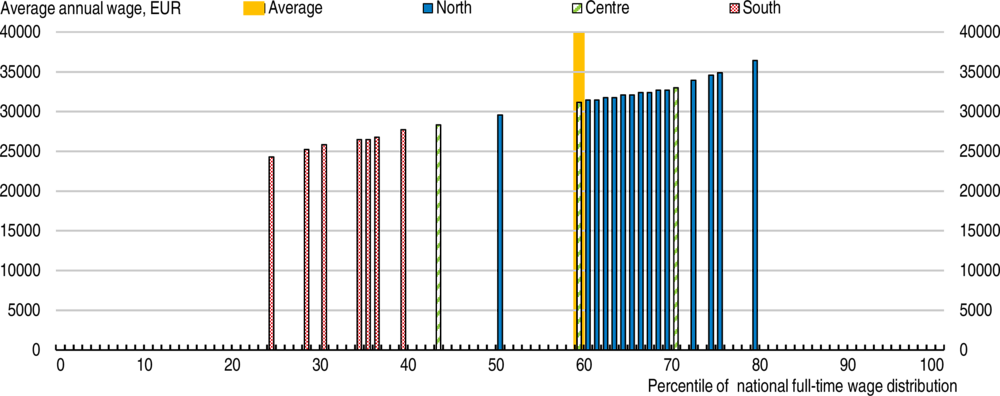
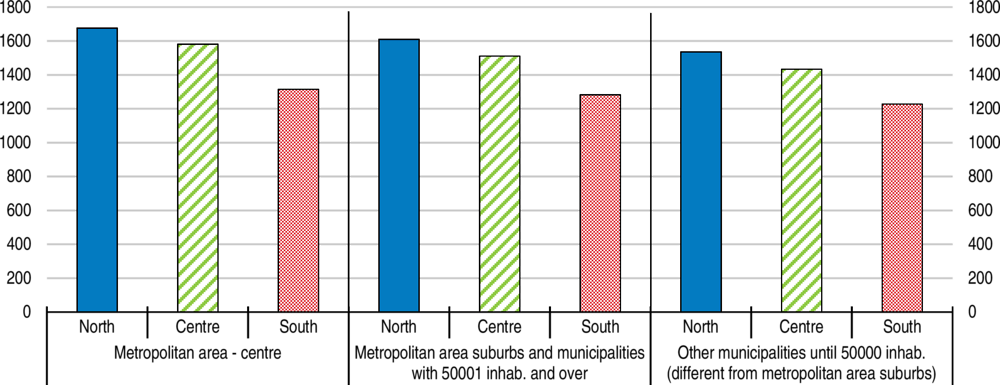
Regional differences in GDP per capita in Italy primarily reflect differences in employment rates, especially among women (Figure 1.6). This is unlike most OECD countries where productivity disparities play a much larger role in explaining differences between regions in GDP per capita (Figure 1.7). Moreover, wages in Italian lagging regions are lower than in more advanced ones. In southern regions, average wages are around 14% below the national average, while labour productivity is 20% lower, while in the North-west wages are 8% above the national average and labour productivity is 12% higher. The average wage in southern regions is around the 30-40th percentiles of the national full-time wage distribution while the average wage in most northern regions are near the 60-80th percentile (Figure 1.8).
Lower wages combined with low employment rates lead to lower household earnings in lagging regions. Though a large share of workers in lagging regions gain some income from informal work (Figure 1.9), such jobs are often associated with lower productivity and poorer working conditions and income.
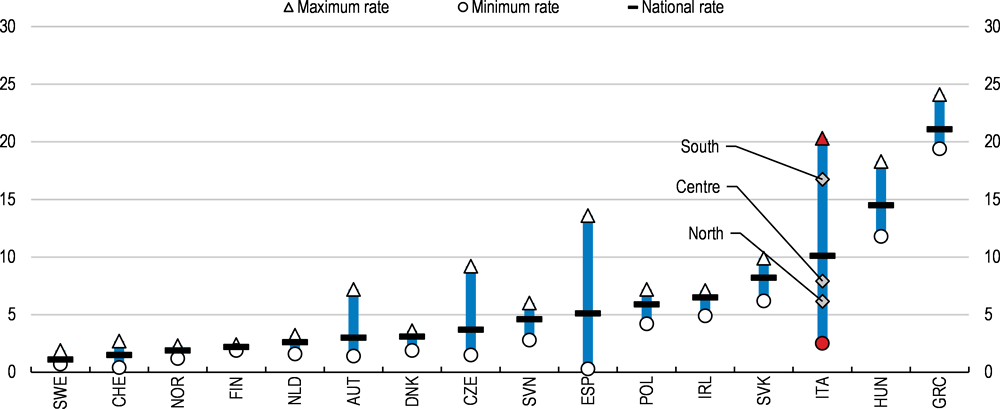
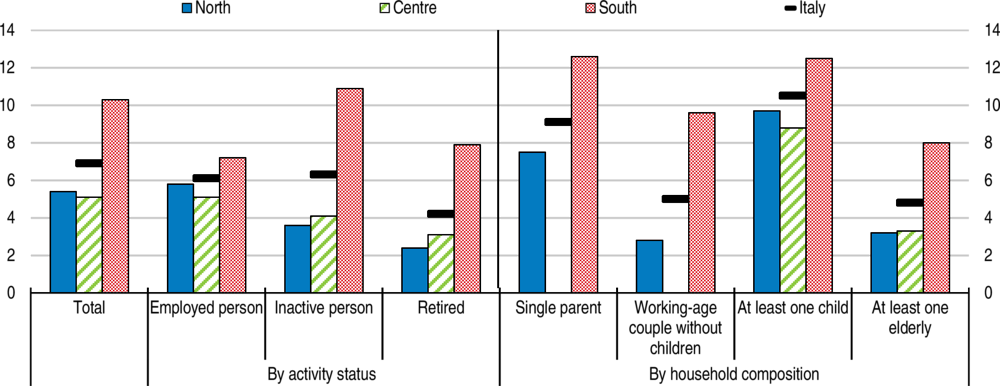
Poverty rates vary widely among Italy’s regions and across socio-demographic groups (Figure 1.10). Disparities in poverty follow the north-south divide as poverty rates – in both absolute and relative terms – are generally higher in southern than in central and northern regions across all household types. Southern regions have among the highest poverty rates across all regions in OECD countries at the NUTS-2 level, while some northern regions are well below the OECD average (Figure 1.3). Poverty is especially high for families with children and increases with the number of children, while it is lowest among retirees. Though poverty rates are highest among the unemployed, at about 25%, in-work poverty has also risen (Figure 1.11).
Note: Countries are sorted by the coefficient of variation of total employment. The coefficient of variation is the ratio of the standard deviation to the mean across regions at NUTS 2 level. For the United States, relates to persons aged 15 and over.
Source: OECD Regional Statistics database. Eurostat data for France.
Note: The coefficient of variation is the ratio of the standard deviation to the mean across regions at NUTS 2 level. GDP data for each regions are expressed in USD PPP at constant prices.
1. For the United States, concerns persons aged 15 and over.
Source: OECD Regional Statistics database.
Source: ISTAT Regional database and OECD calculations.
Source: ISTAT Regional database.
Note: ISTAT absolute poverty measure reports the share of individuals living in households with overall consumption expenditure below a socially necessary minimum, adjusting for the number and age of household members and price levels given the household’s location.
Source: ISTAT Poverty database.
Source: Eurostat
Reducing Italy’s social disparities requires addressing its large regional inequalities by improving welfare and supporting sustained growth. This chapter identifies reform priorities of Italy’s tax and benefit system and regional development policies to boost growth and share more equitably its gains by fostering inclusive access to good quality jobs in the formal economy, strengthening work incentives and reducing poverty. These ambitions and policy measures apply the OECD’s Framework for Policy Action on Inclusive Growth (Box 1.1) (OECD, 2018[3]).
In 2018 the OECD Ministerial Council adopted a Framework for Policy Action on Inclusive Growth, to guide policies to better achieve growth that benefits all and that allow for people, regions and business to fulfil their potential. The framework is not prescriptive, instead emphasising specific policy options that can adapt to Italy’s circumstances. It is centred on three broad principles (Figure 1.12):
-
1. Invest in people and places that have been left behind through (i) targeted quality childcare, early education and life-long acquisition of skills; (ii) effective access to quality healthcare, justice, housing, infrastructures; and (iii) optimal natural resource management for sustainable growth.
-
2. Support business dynamism and inclusive labour markets through (i) broad-based innovation and technology diffusion; (ii) strong competition and vibrant entrepreneurship; (iii) access to good quality jobs, especially for women and underrepresented groups; and (iv) enhanced resilience and adaptation to the future of work.
-
3. Build efficient and responsive governments through (i) aligned policy packages across the whole of government; (ii) integration of distributional aspects upfront in the design of policy; and (iii) assessing policies for their impact on inclusiveness and growth.
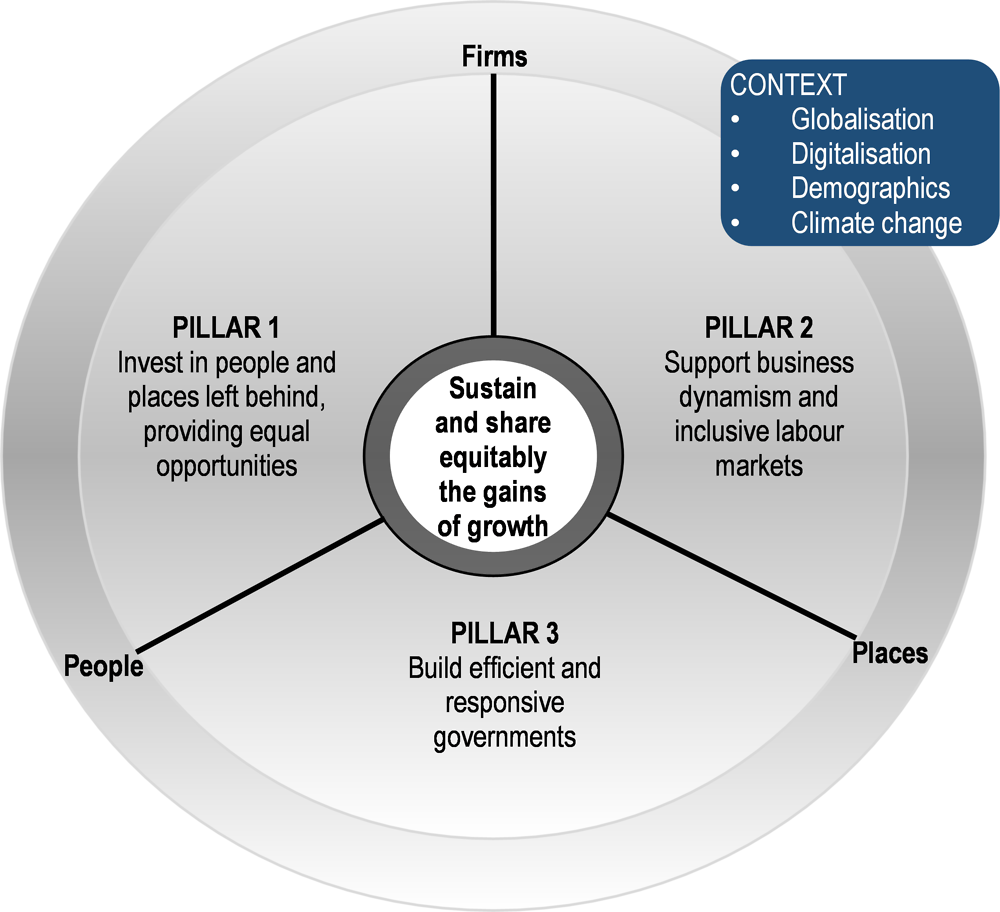
Source: (OECD, 2018[3])
Italy’s tax and benefit system can do more to support employment and to lower poverty
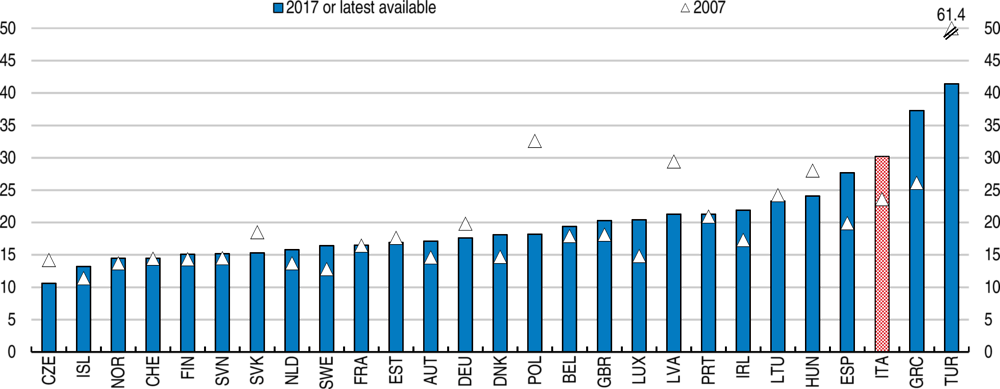
In Italy, inequality and poverty are above the OECD average (Figure 1.13). Italy’s indicators of disposable income inequality in Italy are below those of the United Kingdom but significantly higher than those of France or Germany. This reflects the large inequality in market income (the fourth highest among OECD countries), which the tax and benefit system only partly offsets. After taxes and transfers, Italy’s poverty rate remains among the top half of OECD countries. Italy’s high pension spending and limited social protection favours older people ahead of the young. As discussed below, well-designed reforms of the personal income tax and social benefit system would improve jobseekers’ ability to find work and better protect young and working age people from poverty.
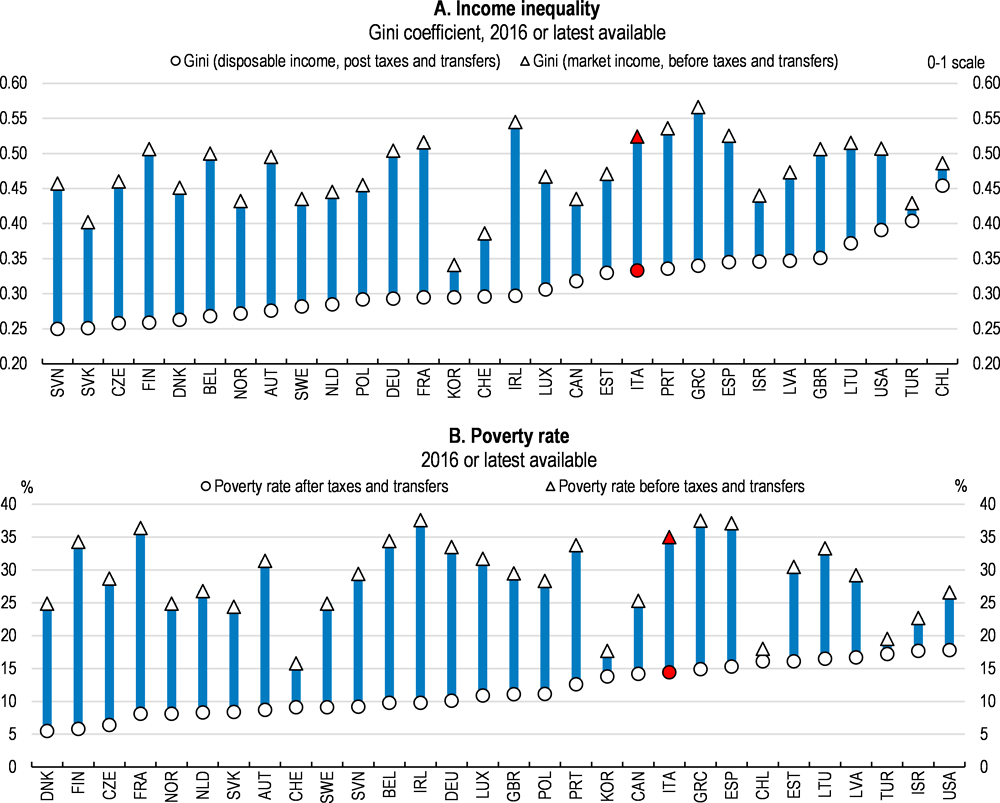
Note: Poverty line is at 50% of the median equivalised income.
Source: OECD Income Distribution database.
Italy’s tax and benefit system discourages work
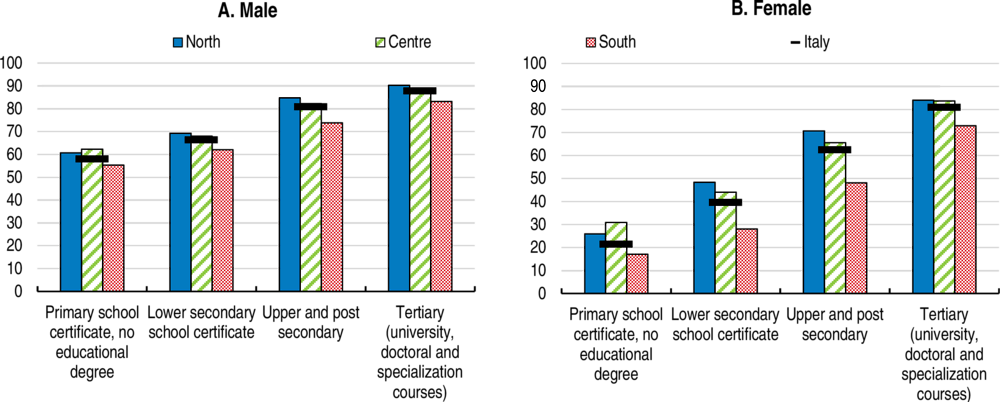
The size and structure of Italy’s tax and benefit system discourage employment, especially among low wage earners and second earners in couples. This is especially problematic in lagging regions where wages tend to be lower than in more developed ones. The shares of single men and women who work in Italy are similar to other European countries. However, among members of a couple, Italy’s employment rates fall below European averages, especially among women and in households with caring needs (Figure 1.14). Second earners’ decisions to seek employment tend to be more sensitive to work incentives and expected disposable income than primary earners (OECD, 2011[4]), especially in Italy (Bargain and Peichl, 2013[5]; Bargain, Orsini and Peichl, 2013[6]; Immervoll et al., 2011[7]). As the female spouse is usually the second earner in Italy, like in most OECD countries (Thomas and O’Reilly, 2016[8]), weak work incentives and low expected income discourage employment among women. Employment rates are markedly lower among women with less education and in regions with lower average wages (Figure 1.15).
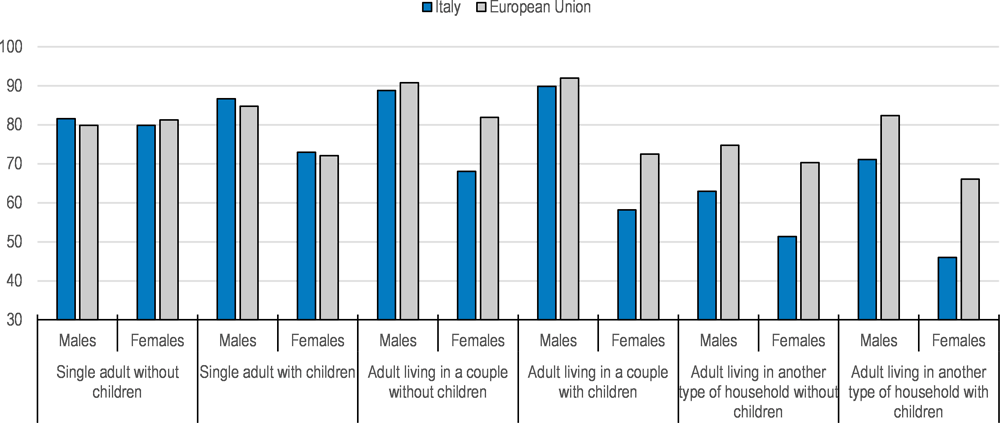
Source: Eurostat.
Italy’s tax share is among the highest relative to GDP across OECD countries (Figure 1.16, Panel A). Personal income taxes and social security contributions amounted to 24% of GDP in 2016. Corporate income and indirect taxes generate smaller shares of overall revenues than in most OECD countries, even if they too are large relative to GDP. High employer social security contributions and personal income taxes make Italy’s labour income tax wedge one of the widest of any OECD country (Figure 1.16, Panel B). This curbs labour demand especially in low productivity areas.
Source: ISTAT Regional database.
Temporary cuts in employer social security contributions over 2015-2018 for new permanent contracts and for targeted workers, such as the young, boosted job creation over this period (Table 1.1). The 2019 Budget introduces corporate income tax breaks for firms expanding employment. However, these tax breaks are likely to have a narrower effect in encouraging employment than a cut in social security contributions as only firms liable to pay corporate income tax will benefit from these tax breaks. Permanently reducing employer social security contribution rates, particularly for low income jobs, would better improve Italy’s competitiveness and boost job creation for a given reduction in revenues (Johansson, 2016[9]; De Mooij and Keen, 2012[10]).
Italy’s statutory personal income tax rates are also high (Figure 1.17). Taxpayers with very low incomes are liable to income tax, unlike many OECD countries where they benefit from a zero tax rate. Instead, in Italy low-income taxpayers and taxpayers supporting dependants benefit from tax credits, transfers and allowances. This system limits tax liabilities for very low income households without dependent children, largely through family tax benefits, and supports very low income households with dependent children through family benefits and transfers (Figure 1.18 and Table 1.2).
The various benefits, credits and transfers mean that in Italy an individual’s effective tax rate depends on their household’s composition and income. The current system penalises households with a second earner and poor households with children by excluding low income households from some tax credits, resulting in higher average effective tax rates (Figure 1.18). The difference in household tax burdens among household types is larger at lower incomes than at higher incomes. Other OECD countries, whether they assess tax liabilities against individual or household income, also adjust effective tax rates according to household composition. How these adjustments are made brings trade-offs between equity and efficiency. In general, the more dependent an individual’s effective tax liability is on other household members’ incomes, the greater the disincentive for the second earners to seek employment (Box 1.2).
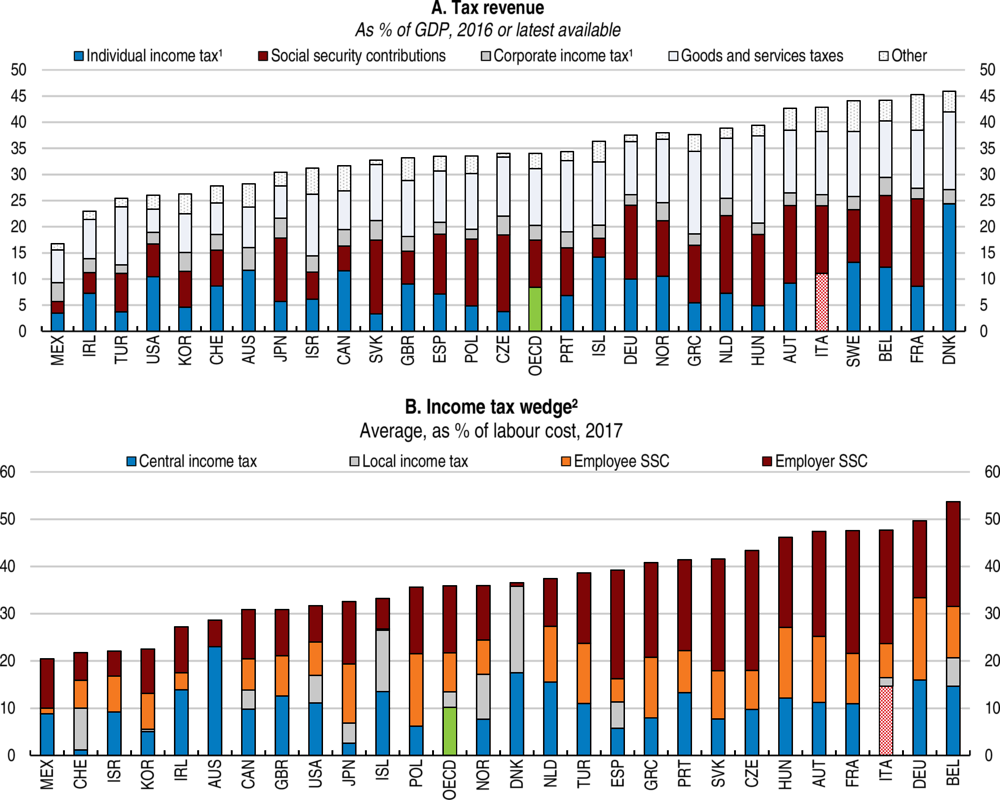
1. Includes taxes on profits and capital gains.
2. The tax wedge is personal income tax, employer and employee social security contributions and payroll taxes less benefits relative to labour costs, for a single childless worker earning 100% of average earnings. Labour costs include the employee’s gross wages plus employer social security contributions and, where relevant, payroll taxes.
Source: OECD Revenue Statistics database; and OECD Taxing Wages database.
In Italy, earners lose eligibility for many tax credits, allowances and transfers when their incomes are at relatively low levels, raising their effective marginal tax rate (Table 1.2). For example, the in-work benefit of EUR 80 per month phases in at moderate wage levels (higher than the wage rates of the working poor) and then phases out sharply as incomes rise from EUR 24 600 to EUR 26 600, raising the marginal effective tax rates markedly. In lagging regions, where more jobs are paid at lower wages, a larger share of households face these high effective marginal tax rates, which weakens work incentives (Figure 1.19). The tapering in the effective tax rate is not smooth, as households gain and then lose eligibility for specific transfers or benefits as their income rises through thresholds that differ between different tax credits and transfers (Figure 1.19, Panel B). This can create inconsistencies between otherwise similar households.
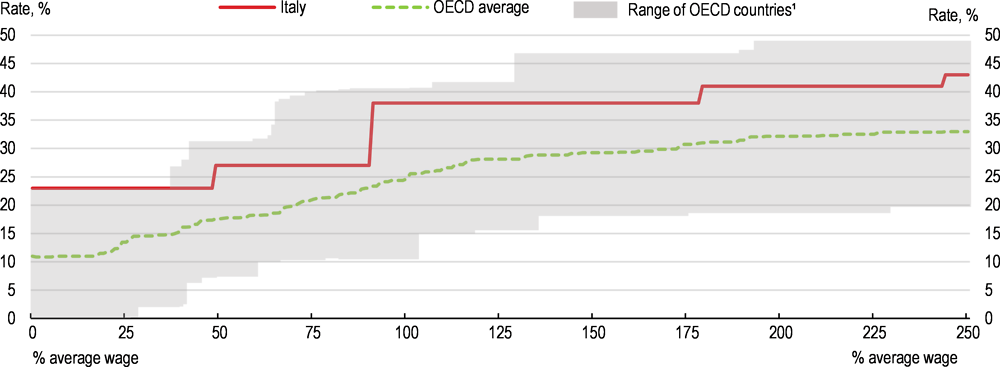
1. The tax rates are the basic central government statutory marginal tax rate that applies to a given level of taxable income, with the level of taxable income expressed as a percent of the average wage. The OECD range illustrates 10th to 90th percentile of statutory marginal tax rates across OECD countries.
Source: OECD calculations based on OECD Tax database; and OECD (2018), Taxing Wages 2018, OECD Publishing, Paris.
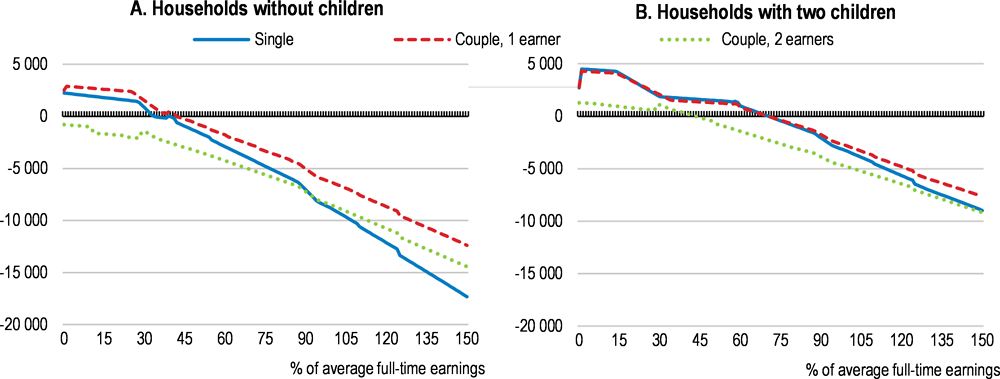
Note: The horizontal axis shows the wage of the primary earner as % of the average full-time earnings. Second-earner’s earnings is fixed at 50% of the average earnings. Total household income is adjusted for household size by the OECD equivalence scale, i.e., divided by 1.4 for a couple, 2 for a couple with 2 children, and 1.7 for a single adult with 2 children.
Source: Calculations based on OECD Tax-benefit model.
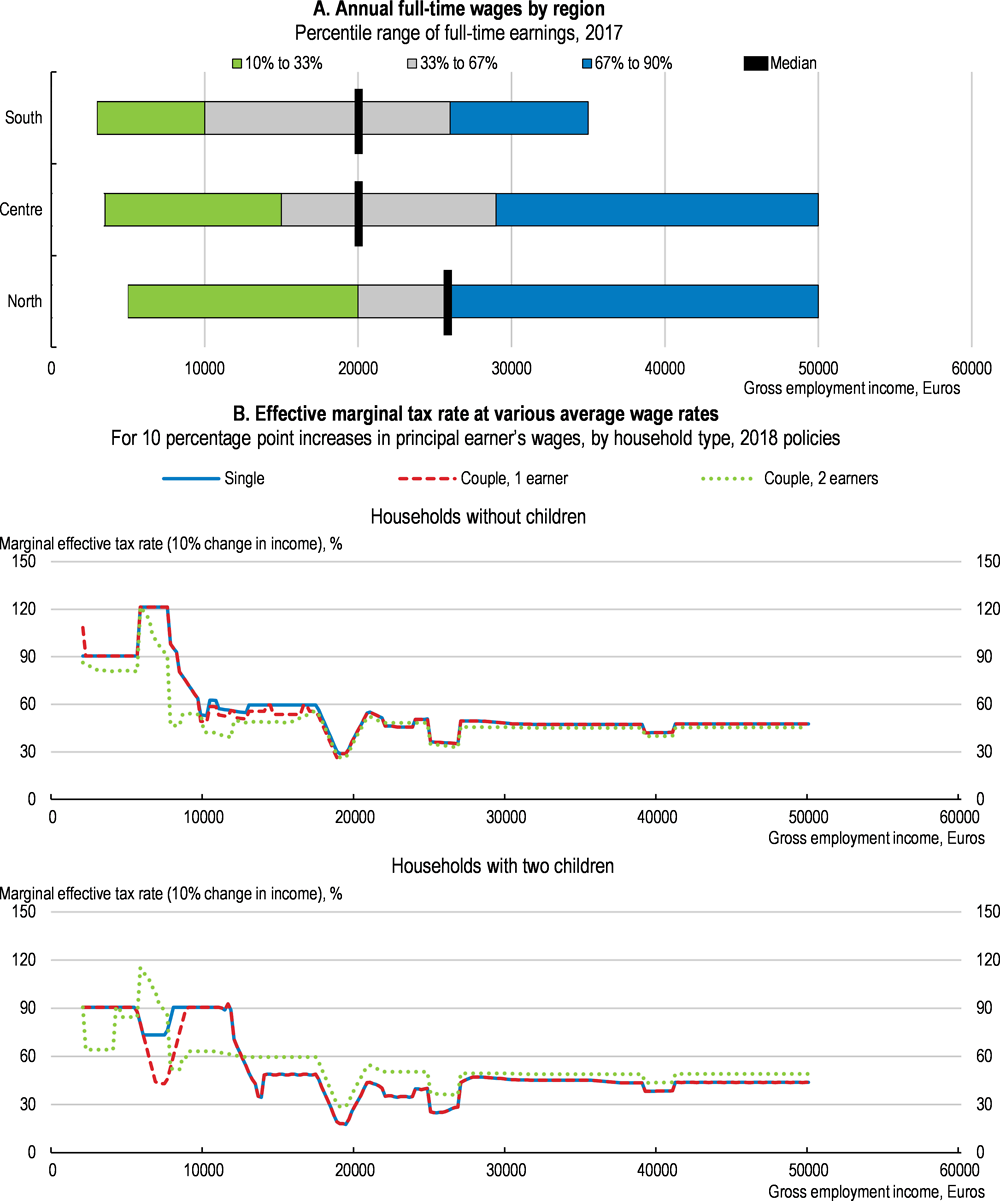
Note: In Panel B the vertical axis shows the effective marginal tax rate in % for 10 percentage point increases in principal earner’s wages at various gross employment income levels. The second earner’s wage in two-earner couples is assumed to be 50% of the average wage.
Source: OECD calculations from OECD Tax-benefit model, OECD Tax and benefit database, and ISTAT Regional database.
In 29 out of 36 OECD countries, personal income tax (PIT) is assessed against an individual’s income. Seven countries require and another four give taxpayers the option of assessing their PIT on a couple’s joint income, or even on the income of all members of the household. Some countries, including Italy, with personal income assessments in practice have a hybrid system, as they provide tax relief or allowances based on joint or household income or provide credits that can be transferred between spouses.
The choice of tax unit entails a trade-off between equity between families, equity between family structures (e.g., singles relative to couples), marriage neutrality (not providing an incentive or penalty when two individuals marry) and progressivity across income levels. No tax structure can simultaneously achieve all objectives.
Whether the individual or the couple is the tax unit affects the neutrality of the tax and benefit system between singles and couples, and the incentives for the second earner in a couple to enter work. When the couple or family is the tax unit, families earning similar total income pay similar levels of taxes, regardless of how earnings are distributed within the couple, improving horizontal equity across families. However assessing income jointly combined with progressive tax rates discourages second earners, as the second earner will face a marginal tax rate equal to that of the primary earner, which is likely to be higher than if the second earner was assessed independently. A larger difference between spouses’ incomes will amplify this disincentive.
Tax and benefit systems that assess income individually but provide tax credits, allowances and transfers on the basis of joint or household incomes, such as Italy, generate high marginal participation tax rates for the household as the second earner enters employment, especially in low-income families that benefit from these allowances.
Similar trade-offs apply to the design of working or earned income tax credits, such as in Italy’s system. These supplement incomes when employment pay is low. Eligibility thresholds that are based on total household income and circumstances can discourage second earners from entering low-income work, as the additional income may reduce the tax credit paid to the household. Eligibility criteria based solely on the individual’s income would avoid this disincentive, but may lead to individuals in high-income households benefiting from the transfer.
Family policies can offset the employment disincentives for second earners of family-based tax assessment systems. For example, in France, income tax is assessed jointly and then adjusted for the number of family members, lowering marginal rates as family size grows. To encourage spouses to enter employment, the French government provides capped allowances, tax credits and subsidies for childcare and household assistance. Social benefits, such as subsidised access to childcare or children’s meals, can further reduce work disincentives.
Sources: (Thomas and O’Reilly, 2016[8]; Colonna and Marcassa, 2015[12]; Luca, Rossetti and Vuri, 2014[13]; Alm, 2005[14])
The structure and withdrawal of family tax credits favours households with an inactive second earner, especially when the second earner can only access low wage work. A household with one earner receiving the average full-time salary is entitled to a tax credit of EUR 710 if the second earner’s annual income is below EUR 2 840. The household becomes ineligible for this credit once the second earner’s income rises above this level, leading to high effective tax rates for the household as the second earner enters work at low wages or part-time. This loss of the tax credit adds to other costs faced by the household as the second earner starts working, such as childcare (discussed below). This further discourages labour force participation of second earners especially in lagging regions where wages are lower. In contrast, in many other OECD tax systems the second earner faces a lower effective tax rate than the first earner at most wage rates.
The benefit system inadequately addresses poverty and social disparities among the young and the working age population
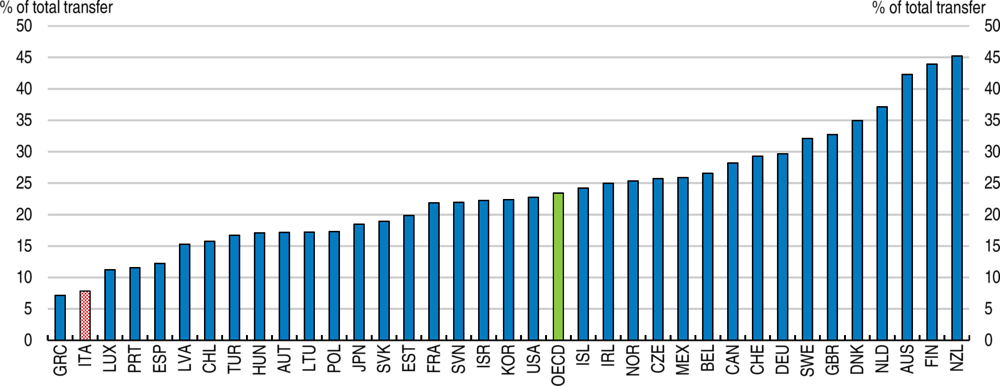
Pensions account for about half of total social protection spending, a higher share than in most OECD countries (Figure 1.20). As a result, spending as a share of GDP on family benefits, active labour market, disability and housing programmes is lower than elsewhere (Figure 1.20). Furthermore, social transfers to the working age population are poorly targeted as only a small share of them reach the poorer households (Figure 1.21).
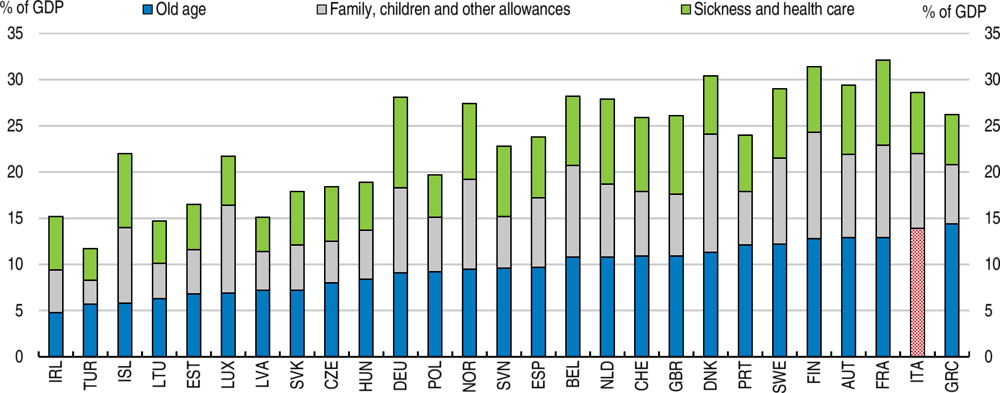
Note: Social protection encompasses interventions from public or private bodies intended to relieve households and individuals of the burden of a defined set of risks or needs, provided that there is neither a simultaneous reciprocal nor an individual arrangement involved. The eight main risks or needs are: old age, sickness/healthcare, survivors, disability, family/children, unemployment, housing, and social exclusion not elsewhere classified (n.e.c). 2014 data for Poland and Turkey. The category family, children and allowances includes social expenditure on unemployment, housing and social exclusion n.e.c.
Source: Eurostat Social Protection Statistics database.
Social spending does little to reduce regional disparities. Municipal authorities are responsible for implementing social protection programmes but capacity and resources vary with the prosperity of the region (Figure 1.22). Lagging regions have larger populations with social needs, but fewer resources and less capacity to address these (Frazer and Marlier, 2009[15]).
Note: Public social transfers received (from public social security) by working-age individuals in low-income groups (equivalised disposable income). Age group 18-65, 18-62 in France.
Source: OECD calculations based on the OECD Income Distribution database.
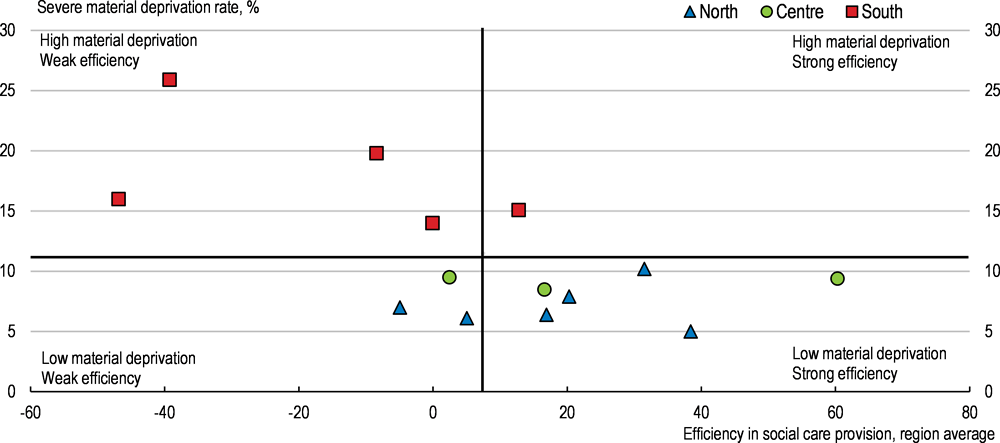
Note: The social care provision index is the percentage difference between spending needs given a region’s characteristics and actual spending in the region. The index is computed considering spending per capita at municipal level and computing the arithmetic averages by region.
Source: ISTAT; Eurostat; OpenCivitas; and OECD calculations.
Italy’s pension spending is high and new policies will raise it further
Italy’s pension spending is the highest across OECD countries and absorbs more than half of Italy’s total social spending (Figure 1.20). Reforms since the mid-1990s have helped to contain rising pension spending, slowing it to below nominal GDP growth. The 2012 Fornero reform extended contribution periods by increasing the retirement age of women to that of men, accelerated the transition to a notional defined contributions system, delayed when a worker would be eligible for pensions and strengthened the link of retirement age to life expectancy. Following this reform, older workers extended their working lives, although they are still shorter on average than in most OECD countries. According to the European Commission, without considering the effect of the retirement policy changes introduced with the 2019 budget, pension spending will rise by 2040, because of the fast ageing process, to the highest level of any European country at any point in the European Commission’s 50-year projection framework, before falling to below 2016 levels by 2060 (European Commission, 2018[16]).
The changes to retirement rules provided in the 2019 budget will lower the effective retirement age. Workers who are aged at least 62 and with at least 38 years of contributions will be allowed to retire with a reduced pension. The changes also weaken the link between life expectancy and retirement age by discontinuing until to 2026 the link between the updates of early retirement contribution requirements and developments in life expectancy. The 2019 reforms also expand access to early retirement for women. These changes reforms follow 2016 reforms that allowed workers to retire earlier by borrowing against future pension benefits (Iudicone, 2017[17]; Ministry of Economy and Finance, 2017[18]).
The 2019 changes to retirement rules are expected to result in up to 300 000 additional retirees in 2019, 330 000 in 2020 and 355 000 in 2021. Pension spending will rise by up to EUR 4 billion (about 0.2% of GDP in 2019) and by about EUR 8 billion yearly in 2020 and 2021, depending on how many eligible workers take-up the scheme. A worker accessing early retirement may lose between 2% and 16% of their standard pension.
Closing the early retirement scheme that the 2019 Budget introduced and reallocating the financial resources to growth-enhancing and social inclusion policies, such as the in-work benefit scheme discussed below, innovation policies and education would preserve the sustainability of the pension system and lead to a faster debt reduction. The sustainability of the pension system crucially also depends on raising the employment rate towards the EU average, and on stronger productivity growth. A sustained increase of 0.4 percentage points in total factor productivity growth would reduce pension spending by 1.1% of GDP from 2050.
Reforming tax and benefit policies to better fight poverty, encourage employment and improve inclusiveness
Over the past few years, introducing a guaranteed minimum income has become a priority of Italian governments (Sacchi, 2018[19]), in line with past OECD Surveys’ recommendations (OECD, 2013[20]; OECD, 2015[21]; OECD, 2017[22]). Guaranteed minimum income schemes act as last-resort safety nets for very low-income and-low wealth households. Design choices for guaranteed minimum income schemes centre eligibility thresholds and transfer amounts as well as the associated requirements of engaging in job-search, training, and other social programmes. As benefits are generally low and well below national poverty lines, such schemes by themselves reduce the depth of poverty, rather than lifting households out of poverty. That eligibility to guaranteed minimum income schemes is conditional on actively seeking work or joining training programmes and that benefits are often limited in time distinguishes guaranteed minimum income from universal basic income schemes, which are universal and unconditional (Box 1.3).
Sustained employment is the best antidote to poverty (Causa, Hermansen and Ruiz, 2016[23]). While the income transfers provided by guaranteed minimum income schemes can be effective in the short term in alleviating poverty, there is a trade-off between the transfer generosity and the incentive for beneficiaries to find work. To help beneficiaries move into employment, many guaranteed minimum income schemes require beneficiaries to actively seek work or take part in training or other social support programmes. To ensure that work pays for beneficiaries, some schemes reduce transfer amounts gradually as beneficiaries start gaining employment income, and a growing number of OECD countries provide in-work benefits to top-up the incomes of low-wage earners.
This section assesses three scenarios based on planned and hypothetical tax and benefit policy reforms in Italy to reduce poverty and expand employment. The reform options are compared with Italy’s tax and benefit policies at the end of 2018, following the July 2018 expansion of the Inclusive Income Scheme (REI). The reform scenarios are:
-
1. Citizen’s Income scenario. The Citizen’s Income (Reddito di Cittadinanza) will be introduced from April 2019 and will replace the REI. Its transfers and eligibility thresholds will be more generous than those of the REI. Overall, the Citizen’s Income could lower poverty rates and the poverty gap substantially. Beneficiaries will only retain a small share of any gains in employment income, and only for the length of an existing Citizen’s Income agreement. This, interacting with other aspects of the tax and benefit system, risks discouraging recipients from obtaining full-time employment in the formal sector. Job search and other obligations of Citizen’s Income beneficiaries are intended to offset these disincentives but will need improved capacity.
-
2. Citizen’s Income and hypothetical flattened personal income tax rates scenario. Flatter personal income tax rates and reduced steps have been discussed for some time in Italy and have been considered by the current government. The effects of a flatter income tax rate schedule in conjunction with the Citizen’s Income warrant assessing, as these measures are likely to be highly costly. Without changes in deductions and allowances to maintain the progressivity of personal income tax, flatter income tax schedules will largely benefit high income households without improving work incentives for low-income households.
-
3. Recommended reform package. This would consist of a guaranteed minimum income, together with in-work benefits for low-wage earners, and a simpler system of personal income tax rates and credits. This system may better protect households from poverty and encourage formal sector employment, especially among second earners, at a moderate net cost for public finances. This policy mix draws on many countries’ approaches to addressing the same objectives.
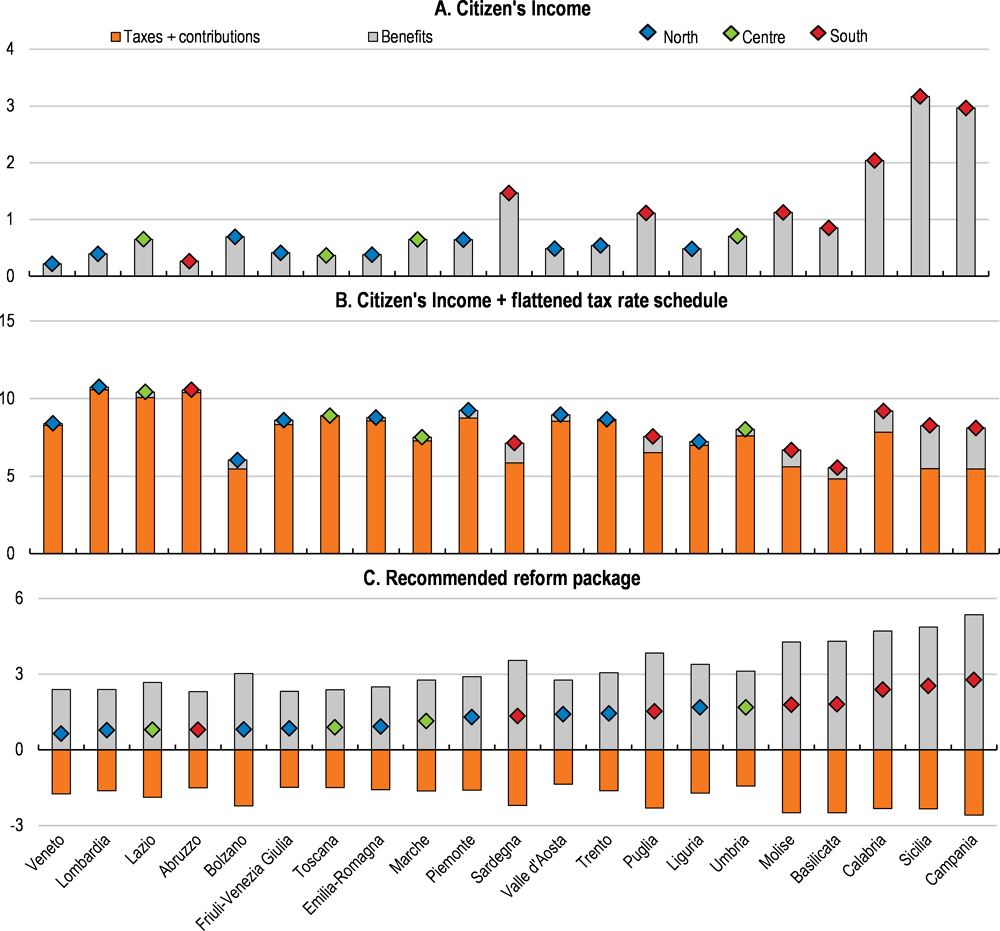
Reforming Italy’s tax and benefit policies will affect households’ incomes and work incentives in addition to social and regional disparities, and public finances. The policy scenarios are modelled using the OECD’s Tax-Benefit model (Bulman et al., 2019, forthcoming[94]; Browne et al., 2019, forthcoming[95]). Simulations of the direct household-level effects are aggregated to regional and national level with the EUROMOD model. EUROMOD incorporates the population’s characteristics (Sutherland and Figari, 2013[26]) and enables to estimate the direct effect of the reform scenarios on tax revenues and benefit spending. All EUROMOD simulations take into account only the immediate effect of policy reforms given households’ existing compositions and characteristics, and do not allow for behavioural responses. In the longer-term, policy reforms may lead to behavioural changes, for example as reduced effective tax rates lead individuals to start working, which can effect employment rates, income and spending.
Universal basic income (UBI) schemes provide a uniform benefit to all, regardless of individual earnings, labour-market status or family or other circumstances. In contrast, guaranteed minimum income (GMI) benefits are conditional on recipients’ income and assets being below a certain limit and recipients are typically required to engage in job search and training programmes.
By being universal and unconditional, UBI recipients do not lose benefits as they gain income, limiting effective tax rates at low incomes as they start working. However being universal means that the UBI transfers are not targeted to those in greater need. This means that UBI schemes require much greater resources than GMIs to ensure that poor households can access a minimum income. Raising these funds requires much higher tax rates or very substantial cuts to existing social benefits (Browne and Immervoll, 2017[27]).
UBI proposals generally envisage transforming existing social payments and tax credits into a flat payment to all adults. The size of benefits is debated. Simulations find that transforming the existing GMI provided in most countries into a UBI, while ending existing social protection programmes would require large increases in tax revenues, and may lead in many countries to higher poverty rates as targeted benefits are converted to a universal income available to all.
UBIs have gained greater attention in recent years. Many see them as the right response to changing forms of employment that break down traditional, long-term employer-employee relationships, to fears of automation causing large-scale job losses, and to greater recognition of gaps in existing social protection systems’ coverage. UBIs have the attractions of being simpler than traditional tax and benefit systems and of avoiding high effective marginal tax rates as means-tested benefits are withdrawn as income rises.
The Netherlands and Finland have trialled UBI-like programmes, although they have been limited to particular groups – generally the unemployed – or regions – smaller towns (Pareliussen, Hwang and Viitamäki, 2018[28]). Livorno, in central Italy started a small 6-month trial in June 2016, providing 200 of the poorest households with EUR 500 per month, conditional on completing community service and showing that they are actively searching for work.
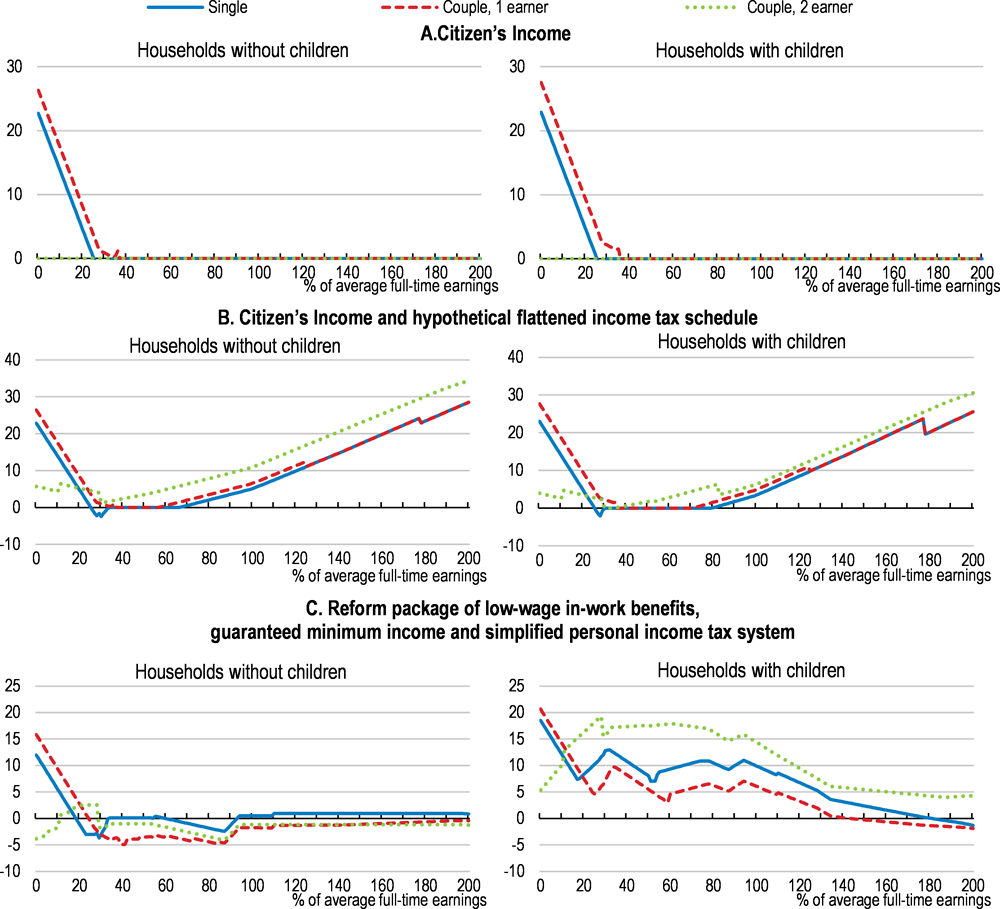
The effects of the three policy scenarios are presented across several Figures and Tables. Table 1.6 reports the effect of the policy scenarios on poverty rates, poverty depth (i.e., the gap between their incomes and the poverty line), inequality, tax rates at various income levels, and the net effect on public finances. Figure 1.23 illustrates the income out-of-work households would receive, relative to the national average full-time wage and compared with other OECD countries, under the 2018 Inclusive Income Scheme (REI), the Citizen’s Income and the recommended reform package’s guaranteed minimum income scheme. Figure 1.25 shows the change in income across the various policy scenarios relative to the 2018 REI for different household types across wage levels. Figure 1.26 illustrates the effects of the various policy scenarios on net earnings, and its components, for families with 2 dependent children and with either one or both adults working at different wage levels. Figure 1.27 shows the participation tax rates of the various policy scenarios of moving into work at different wage levels and household situations, compared with other OECD countries. Figure 1.31 shows the long-run macroeconomic effects of the recommended reform package on labour productivity and activity. Bulman, et al, (2019, forthcoming) provide additional results across a wider range of household types.
The REI introduced a national guaranteed minimum income to Italy
The Inclusive Income Scheme (Reddito di Inclusione, REI) was first introduced in early 2018 and was Italy’s first nationwide guaranteed minimum income scheme. Previously, some Italian municipalities provided local guaranteed minimum income programmes, and the REI had absorbed them. Eligibility to the REI was determined by the household’s income, assets and compositions, as measured by the Equivalent Economic Situation Indicator (ISEE). The ISEE is a synthetic measure of a household’s income and assets adjusted for the household’s composition and whether household members need special care (Box 1.4). As the REI was operating at the end of 2018, it is included in the baseline against which the Citizen’s Income and two hypothetical tax and benefit reform scenarios detailed below are compared.
The REI’s transfers and eligibility thresholds were low relative to other countries (Figure 1.23; Table 1.3). The REI’s cash transfers topped up eligible recipients’ very low incomes. This reduced the depth of poverty they faced – i.e., the gap between their incomes and the poverty line – without raising their incomes above the poverty line (Figure 1.23), similarly to most countries’ guaranteed minimum income programmes. Reflecting its low benefits and strict eligibility thresholds, the budgeted cost of the REI was small, at 0.1% of GDP.
The REI’s low eligibility thresholds and transfers mean it had minimal negative effect on employment incentives. Participation tax rate for beneficiaries moving into low-wage work were among the lowest across the OECD. In addition, REI beneficiaries were required to engage in job-search, training or other social programmes tailored to recipients’ needs.
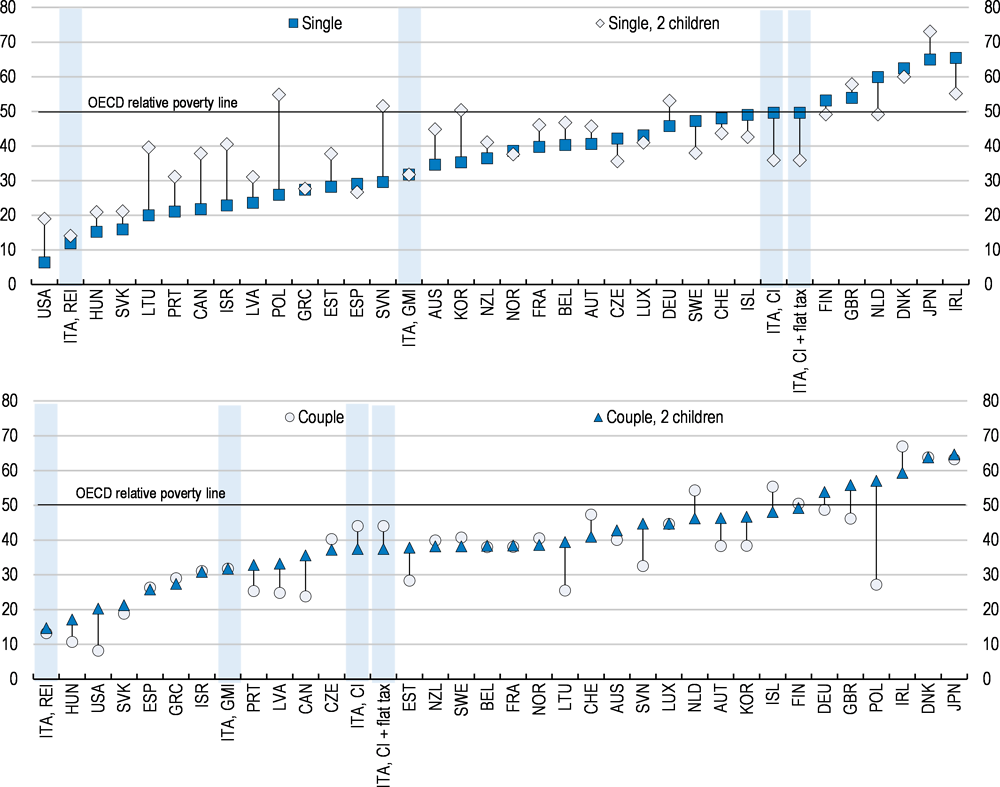
Note: "ITA, REI" shows the policy rules relating to the 2018 "Reddito di inclusione", the guaranteed minimum income implemented in 2018; "ITA, CI" reflects the Citizen's Income policy rules prescribed by the decree of January 2019; and "ITA, GMI" reflects the policy rules relating to the hypothetical ‘Guaranteed minimum income’ in the recommended policy package presented in Table 1.8.
Source: Calculations based on OECD Tax-benefit model.
Italy’s main instrument to means-test eligibility for social benefits is the Equivalent Economic Situation Indicator (ISEE – Indicatore della Situazione economica Equivalente). Households apply to the national social security institute (INPS) for an ISEE value. INPS calculates the ISEE value from information provided by the household and tax authorities. The household’s ISEE value determines whether its members can access non-contributory social benefits, ranging from the REI to subsidised childcare places.
The ISEE calculation is standard across Italy, while eligibility thresholds based on ISEE for specific benefits can vary between regions. Nationally, 23.4% of the population had an ISEE value at the end of 2016, with higher shares in southern than in northern regions, ranging from one-third of the population in Sardinia to 9.8% in Trentino. Requests for ISEE values peaked in 2010 and 2011 during the economic downturn.
The ISEE value for a household is calculated from the household’s income (Income Situation Index, ISR) and assets (Asset Situation Index, ASP), adjusted for the number and characteristics of household members:
ISEE = (ISR + 20% ASP)/(Equivalence scale)
The ISR covers all income sources from all household members, allowing for specific deductions, over the previous 12 months. These deductions include 20% of income from employment or similar sources, including unemployment insurance benefits, up to EUR 3 000, or, alternatively, 20% of the income from non-taxable benefits or pensions up to EUR 1 000. A family’s rental costs can be deducted up to EUR 7 000 per annum and by EUR 500 more for the third and additional children. Income and health expense allowances for each disabled household member can be deducted. These deductions lead to around 10% of households’ ISEE value to be zero in 2016.
The Asset Situation Index sums household wealth, including both movable and immovable properties, subtracting deductions and allowances. These rules favour renters over homeowners, as rent expenses are deductible from income, while home ownership increases the ISEE value.
Household sizes are adjusted to equivalent sizes by scaling the number of members to the power of 0.65, for up to 6 members. From 2019, households with more than two children can make additional deductions from their income and asset values.
A household’s initial ISEE value is calculated from the previous year’s taxable income and assets. An asset-poor household may only be eligible for social protection the year after losing their income. Conversely, the household will remain eligible for ISEE-assessed benefits even as they restart work. Reforms introduced in 2019 allow a household which already holds a current ISEE to request that it be recalculated based on their previous two months’ situation if a household member’s work situation changes and the household’s total ISR falls by at least 25%.
The ISEE has been criticised for how it weighs incomes and assets, and for applying the same equivalence scale to different types of benefits. However, individual benefits may apply specific eligibility thresholds. In practice, regions and local communities may adjust the criteria by applying discretion in valuing and calculating the components.
Sources: Motta (2011[29]); Ghetti (2012[30]).
The Citizen’s Income raises support for low incomes but risks weakening incentives to work
The Citizen’s Income scheme will replace the REI from April 2019. Table 1.3 summarises this scheme. It will provide a transfer to top-up poor households’ income to a minimum level. The income transfer is higher for larger households, although the scaling factor is capped, penalising large households. The Citizen’s Income will also provide transfers to cover rental or mortgage expenses, though this rental or mortgage allowance does not vary with the household’s size. The Citizen’s Income applies to households with working-age members, while a new “Citizen’s Pension” provides a safety net for very low income households made up of only people aged 67 or above. Households will be eligible for the Citizen’s Income if they have been resident in Italy for at least 10 years and continuously for the previous 2 years. The benefit is conditional on participating in municipal works and employment or social inclusion “pacts”. The public employment services will be responsible for administering the scheme. Beneficiaries that fail to provide complete or updated information on their eligibility or to comply with the employment or social inclusion “pacts” risk penalties ranging from retrospective forfeiting of the benefit to up to 6 years’ imprisonment.
The Citizen’s Income transfers will be considerably more generous than the REI. For smaller households, it will be more generous than similar schemes in most other OECD countries relative to the national average income (Figure 1.23). Simulations suggest that the direct effects of the Citizen’s Income will reduce the depth of poverty by 25%, the poverty rate by 2.8% (when poverty is measured against a national relative poverty line), and inequality by 8.9% (when measured in terms of the ratio between the 80th and the 20th income percentiles) (Table 1.6). The income transfer alone is below relative and absolute poverty thresholds, but when the income transfer is combined with the rent or mortgage allowance the total transfer rises above some relative and absolute poverty thresholds for smaller households and those living in low cost areas (Table 1.4). At least one-third of households at risk of relative poverty rent a residence at market rates, while about 16% own their residence with a mortgage (Figure 1.24).
The Citizen’s Income’s transfer rules risk accentuating the tax and benefit system’s disincentives for low-income households to work, and could lead to poverty traps. The transfer is intended to ensure that beneficiaries achieve a minimum income, which is set at EUR 500 per month (without the rental or mortgage allowance). The transfer value is calculated as the difference between this minimum income and the recipient household’s existing income, allowing for some exclusions such as a carer’s allowance. If the household receiving a Citizen’s Income transfer starts earning additional income and remains eligible for the Citizen’s Income, the transfers would be reduced by 80% of the additional income until their Citizen’s Income employment or social inclusion “pact” expires. If they renew their participation in the programme, their transfer amounts would be fully reduced by the gain in income. These withdrawal rates are visible in Figure 1.26 (Panel B) as the net income (solid back line) remains flat as gross earnings rise up to 36% of the average full time gross wage for a single person. It is also evident in the high participatory tax rates at low wages – the effective tax rate from moving into employment (Figure 1.27).
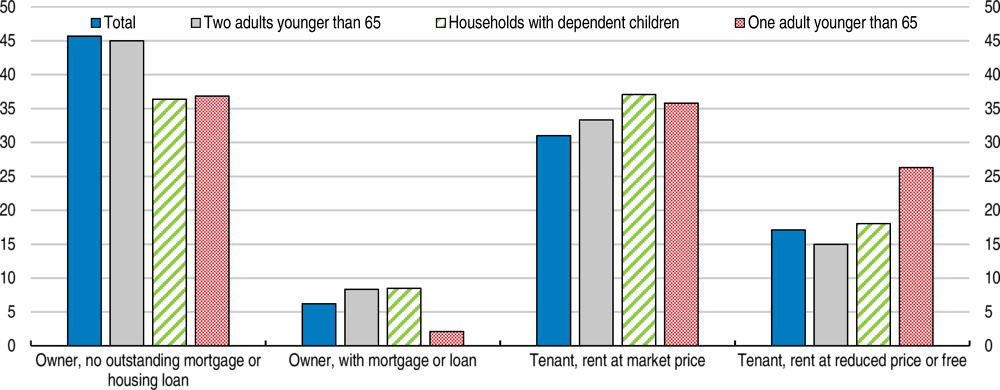
Note: Households eligible for the Citizen’s Income will have lower incomes than the population shown in this graph, who have equalised disposable incomes of up to 60% of the median.
Source: Eurostat and OECD calculations.
The Citizen’s Income risks entrenching regional disparities in employment rates. In lagging regions, a larger share of the population will be eligible for the Citizen’s Income (Figure 1.28), but they face labour market and economic conditions that are likely to discourage them from gaining formal-employment income. Overall, the Social Security Institute (INPS) estimates that 45% of private sector employees in the South earn net labour income below the Citizen’s Income transfers (Commissione 11a del Senato della Repubblica, 2019[31]; Boeri, 2019[32]). For example, almost one-third of jobs in the South pay wages that are below the Citizen’s Income’s income eligibility thresholds of EUR 9 360 for a single person household who rents (Figure 1.8). At the same time, in lagging regions lower living costs (Figure 1.29) boost the purchasing power of Citizen’s Income benefits, in addition to there being more opportunities to supplement transfers with undeclared work.
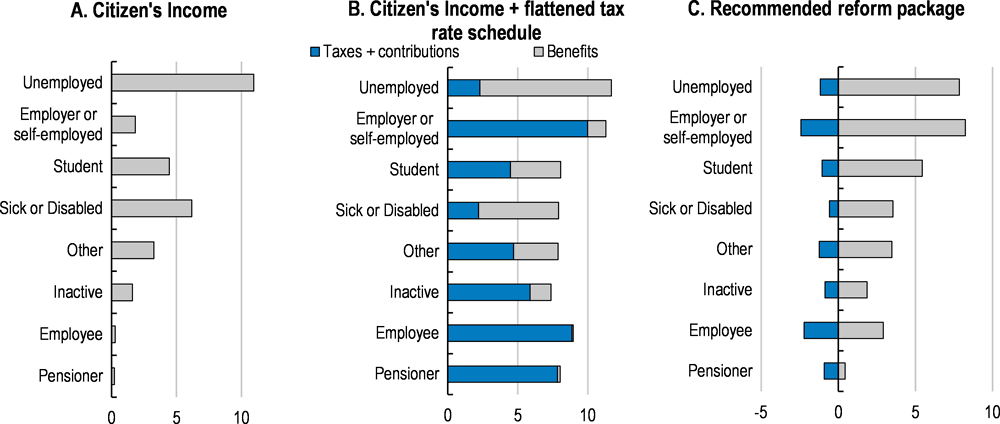
The Citizen’s Income will particularly benefit single-person households, the unemployed and students (Figure 1.30). The Citizen’s Income equivalence scale is capped and below the cap it increases only modestly the benefits and income eligibility thresholds for larger households (Table 1.5). This limits transfers and imposes relatively stricter income-eligibility thresholds for larger households, even though absolute poverty rates are higher among larger households. This low scaling for larger households may encourage households to split, at least for the purposes of their Citizen’s Income applications, though the government is putting in place a system to discourage couples from legally separating to receive higher payments. Greece, which recently introduced a guaranteed minimum income programme similar in many respects to the Citizen’s Income, has experienced an increase in the numbers of households splitting. Greece’s scheme follows the Eurostat equivalence scale, which is somewhat more generous to larger households and does not cap the scaling of benefits. The share of single person households accessing Greece’s programme is 10 percentage points higher than the national average, without other significant differences in the households’ needs. This experience suggests applications from single person households need careful verification. To discourage households from splitting, benefit parameters should be less generous to single households and more generous to larger households (Marini et al., 2019[33]).
Note: Total household income is adjusted for household size by the OECD equivalence scale, i.e., divided by 1.4 for a couple, 2 for a couple with two children, and 1.7 for a single adult with 2 children. In two-earner couples in these simulations, the second earner earns 50% of the average wage.
Source: Calculations based on OECD Tax-benefit model.
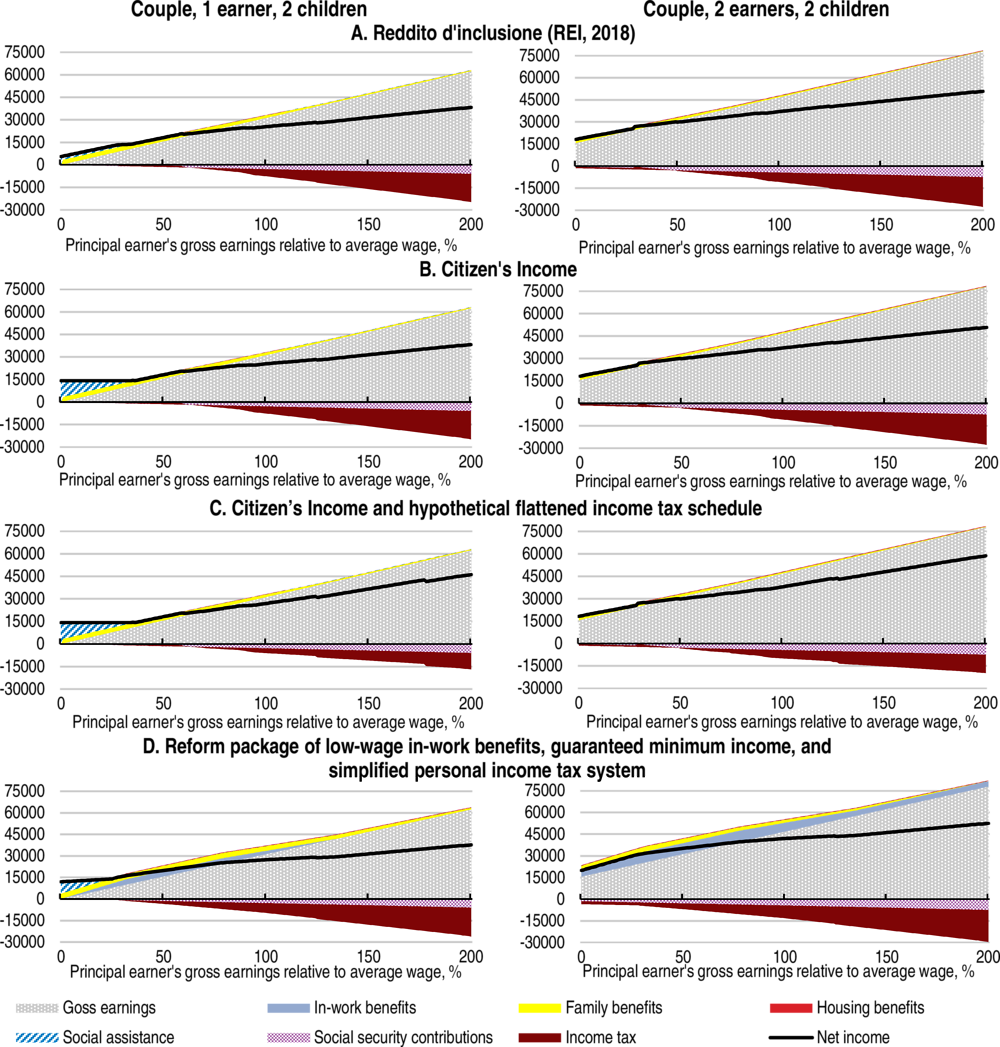
Note: These graphs show the contribution to net income of employment earnings, benefits and deductions from taxes and social security contributions at various percentages of the average wage. The solid black line shows the final net or ‘take home’ earnings. Each row shows the results under a set of policy rules. The columns compare the situation of a couple with two children with one earner (left column) and two earners (right column), where the second earner is assumed to earn 50% of the average wage. The household is assumed to pay a rent of EUR 6 200 / year. The ISEE indicator used for the current REI takes into account the ISEE ‘rent’ and the ‘earnings-related’ deductions provided in the ISEE law. The accompanying working paper (Bulman, et al., 2019, forthcoming) presents simulations of policies on other household types.
Source: Calculations based on OECD Tax-benefit model.
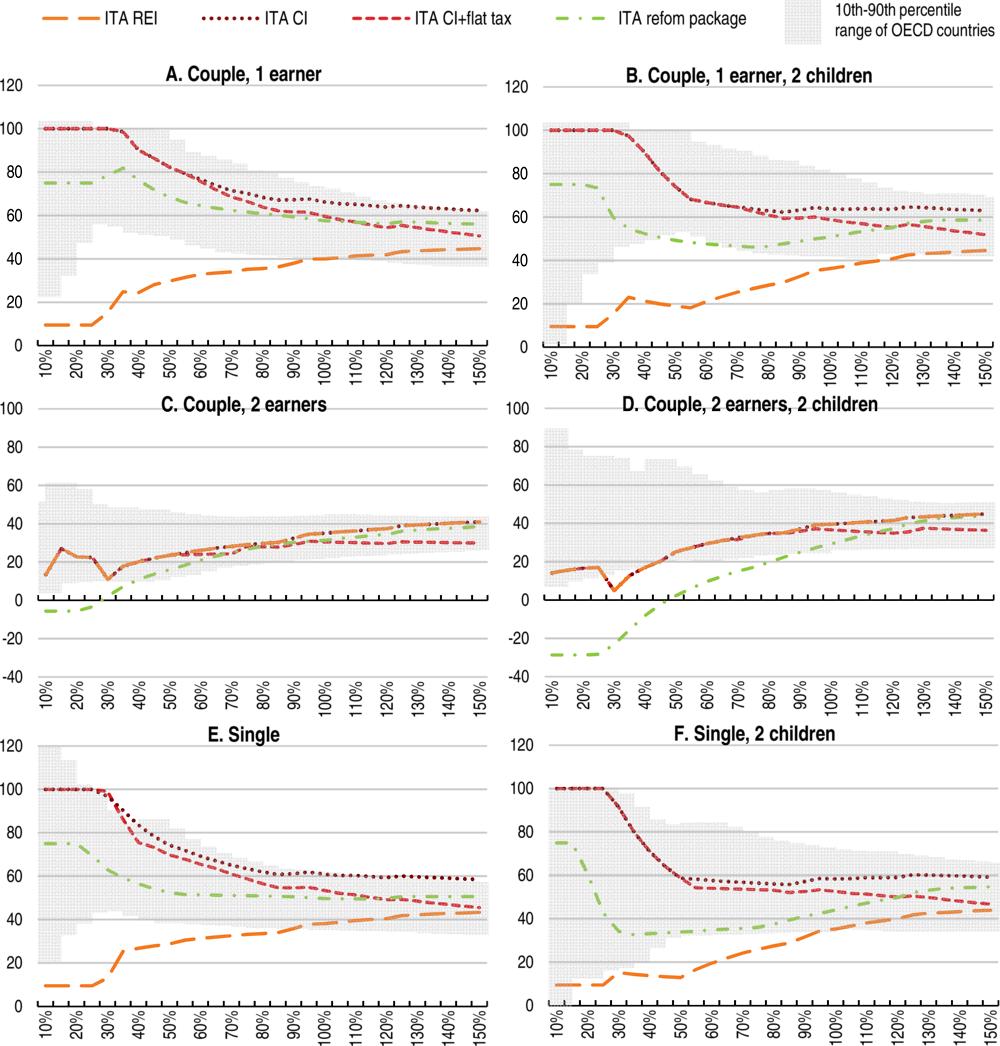
Note: the lines show the overall net effective tax rate as a percent of gross income faced by the earner as they move from no income into work at various wage rates, where those wage rates are expressed as a percent of the average wage. “ITA REI" shows the policy rules relating to the 2018 "Reddito di inclusione", the guaranteed minimum income implemented in 2018; "ITA CI" reflects the Citizen's Income policy rules prescribed by the decree of January 2019; and "ITA, GMI" reflects the policy rules relating to the hypothetical recommended policy package proposed in Table 1.8.
Source: Calculations based on OECD Tax-benefit model.
Note: In the recommended reform package, the earned income tax credit is classified as a benefit. The EUROMOD simulations include all population groups, and households with all members aged 67 or older are assumed to receive the Citizen’s Pension, if eligible.
Source: OECD calculations using EUROMOD, version I1.0+. EUROMOD is maintained, developed and managed by the Institute for Social and Economic Research (ISER) at the University of Essex, in collaboration with national teams from the EU member states. The European Union Programme for Employment and Social Innovation ‘Easi’ (2014-2020) financially supports extending and updating EUROMOD. The results and their interpretation are the authors’ responsibility. The EUROMOD simulations presented here use the Italian version of the EU Statistics on Incomes and Living Conditions made available by Eurostat and ISTAT (166/2015-EU-SILC).
Note: The children are aged between 4 and 10 years and 11 and 17 years.
Source: ISTAT.
Note: In the recommended reform package, the earned income tax credit is classified as a benefit. The EUROMOD simulations include all population groups, and households with all members aged 67 or older are assumed to receive the Citizen’s Pension if eligible.
Source: OECD calculations using EUROMOD. See source notes to Figure 1.28.
Eligibility criteria limit the cost of the Citizen’s Income by excluding some households that would be eligible given their low incomes and assets. Recipients must have ten years’ residency in Italy and have been continuously resident for the two years before their applications. The government estimates that this restriction will exclude 87 000 households (6.5% of the total) that otherwise would be eligible, saving about EUR 0.5 billion from the cost of the programme. This restriction will also exclude these households from benefiting from the Citizen’s Income employment and social support.
Requirements that beneficiaries participate in activation or other social support programmes, and in municipal work, are intended to help beneficiaries move into work and to counter the disincentives to gaining work income. Citizen’s Income beneficiaries will be required to complete an assessment of needs and then to engage in employment or social inclusion “pacts”. This is similar to the REI’s requirements and many other countries’ guaranteed minimum income schemes. Beneficiaries able to work will sign an employment “pact”, requiring them to engage in job search and training activities. They will be obliged to accept one of three “fair” job offers where ‘fairness’ is defined with respect to the job offer’s distance from the beneficiary’s residence. Beneficiaries will also be required to work 8 hours per week for municipalities’ social and development projects. For these requirement to be effective, job search and training programmes need to be effective and accessible (as discussed below).
The Citizen’s Income strict conditions and penalties, intended to encourage beneficiaries to enter work, may discourage take-up among the neediest population. Effective social protection programmes engage all eligible recipients, especially those with high needs, but this is a challenge especially when schemes are complex (Frazer and Marlier, 2009[15]; Bodewig et al., 2016[34]). Attaching punitive conditions to welfare benefits may discourage the households with the greatest needs from applying for or maintaining the benefit. Several assessments found that to be the case with the UK’s ‘Universal Credit’ reforms (Wright et al., 2016[35]; Work and Pensions Committee, 2018[36]). Highly vulnerable beneficiaries have greater difficulties both complying with job search, training and social programmes and demonstrating that they have done so, increasing the risk they either drop out or not apply for the Citizen’s Income (Crepaldi et al., 2017[37]). Following the UK reforms, the beneficiaries with the greatest needs (the homeless, mentally ill and those with poor literacy) were least able to meet benefit conditions, most likely to be sanctioned for failing to do so, and suffered most from those sanctions, even while those engagement conditions can also improve behaviour for other households (Batty et al., 2015[38]). Proactively engaging with potential beneficiaries, such as contacting them directly and guiding them through the programme’s application and requirements can be effective but requires tailored efforts that may be best undertaken by municipalities’ social services.
The cost of the Citizen’s Income is in line with similar schemes in other countries but it risks rising if beneficiaries do not move into employment as expected and the benefit’s take-up improves over time. The 2019 Budget allocates EUR 5.6 billion or about 0.3% of GDP to fund the Citizen’s Income, and between EUR 7.1 billion and EUR 7.4 billion annually from 2020. The REI, itself heavily expanded in July 2018, was allocated 0.1% of GDP in 2018 (European Commission, 2018[11]). The government’s cost estimates of the Citizen’s Income is consistent with OECD simulations using EUROMOD. It is within the range of other European countries’ guaranteed minimum income schemes (Baldini et al., 2018[39]). For example, Greece’s 2017 GMI, similar in many respects to the Citizen’s Income, is projected to cost near 0.4% of GDP when fully implemented (OECD, 2018[40]; European Commission, 2018[41]). The government expects the Citizen’s Income cost to decline in later years as beneficiaries graduate out of the scheme into employment. However, experience in Italy and elsewhere shows that awareness and participation in such schemes take time to grow. For example, in the early 2010s the municipality of Turin trailed a minimum income programme and found that it reached less than two-thirds of the eligible population. A similar share of the anticipated eligible beneficiaries had taken up the REI by January 2019. More than a year after Greece’s guaranteed income scheme was rolled out nationally, 60% of households in the poorest income decile had not applied (Bodewig et al., 2016[34]).
Flattening personal tax rates would benefit high-income households and involve high costs
Reducing taxes on lower incomes is a powerful instrument to achieve inclusive growth. Improving the incentives to work and to earn, particularly for people with lower skills and in lagging regions, requires adjusting the tax systems, along with benefits. Lowering the tax rate for low earners would bring Italy’s tax schedules closer into line with other OECD countries (Figure 1.17). The current government has considered simplifying Italy’s multiple personal income tax rates into two tax rates and rationalise tax expenditures while ensuring the personal income tax system remain progressive. However, the 2019 budget included no such proposals. Table 1.7 presents one hypothetical reform to the personal income system going in this direction and compares it the 2018 system.
The hypothetical flatter income tax, with the Citizen’s Income in place, would raise disposable incomes across household types, especially among high income households (Figure 1.25; Figure 1.26, Panel B). The ratio of the disposable income of well off households (those in the fourth quintile of the income distribution) relative to the less-well off households (those in the first quintile) would increase by 4.4%.
Flattening personal income tax rates would involve large fiscal costs. Simulations suggest a direct cost of EUR 61 billion annually, before accounting for changes in employment rates and productivity that would follow the reforms (Table 1.6). In addition, flattening the personal income tax rates risks entrenching social and regional disparities. For low income households, which may be near eligibility thresholds for the Citizen’s Income, flattening the personal income tax rates would not improve incentives for second earners to move into employment. For high income households, which are not eligible for the Citizen’s Income, reducing marginal tax rates and making them less progressive would further encourage households to increase their already high work hours, such as by second earners entering the workforce.
In-work benefits, a guaranteed minimum income and personal tax income reforms would boost employment and raise poor households’ income
This sub-section proposes a recommended reform package combining in-work benefits for low-income earners, a guaranteed minimum income with gradually decreasing transfers (as beneficiaries start working) and a simplified and progressive income tax system. The recommended reform package would adjust benefit rules and reform the personal income tax rate schedule to address the competing objectives of reducing poverty and encouraging employment within limited fiscal space. Like the Citizen’s Income, households who do not own their residence would receive an allowance for housing costs. Table 1.8 summarises the package. The recommended reform package would reduce income inequality and poverty by 10.5% and 8.6% respectively with respect to 2018 policies, and encourage employment and activity, at a net cost comparable to the Citizen’s Income (Table 1.6).
The in-work benefits included in the recommended reform package would provide additional income for low wage earners and ensure that beneficiaries’ net income rises as they earn greater employment income. This goes further than the existing system of tax credits. Among other benefits and credits, this would replace the existing low income tax credit and the EUR 80 per month fiscal bonus. This is visible in Figure 1.26 (Panel D) where the in-work benefits (light blue area) contribute to raise net income (solid back line) as gross earnings rise from zero to 50% of the average wage, resulting in low participatory tax rates at low wages (Figure 1.27; Box 1.5). This is in contrast with the Citizen’s Income (Figure 1.26, Panels B and C) where the net income rises little as gross employment earnings increase, resulting in high participatory tax rates (Figure 1.27). In-work benefits would raise employment rates and incomes of poor households at lower cost than transfer systems that impose higher participatory tax rates.
In Italy, an in-work benefit programme should assess eligibility on the basis of the individual earner’s salary level rather than their household’s total income. If eligibility is assessed according to household income (such as through the ISEE value) the principal wage earner may lose access to in-work benefits if the second earner starts working, even at low wages. This has been found to reduce work by the second earner, and to reduce the household’s overall employment levels (Brender and Strawczynski, 2018[42]). However, eligibility assessed according to household income would improve the targeting of in-work benefits to low-income households by ensuring that it does not benefit low-wage earners living in households with relatively high total income.
Reducing in-work benefits gradually as incomes rise would also improve incentives for beneficiaries with low incomes to increase their work effort and earn more. This approach would reduce the participation tax rate, the effective marginal tax rate and the tax wedge at lower and middle income levels, benefiting lower and even some middle income earners (Figure 1.26, Panel C). Macroeconomic simulations, based on Guillemette and Turner (2018[43]), suggest that reducing the tax wedge in this way, before taking into account other policies, would raise the employment rate by 2.6% in 2030 relative to 2018 policies, and lead to 2.4% higher GDP, which in turn would support public revenues. Strengthened active labour market policies and support for families would complement the positive effect of the recommended reform programme on employment and activity (Figure 1.31).
The proposed reform package would include a guaranteed minimum income for low income households. The transfers would be greater than those of the REI but somewhat lower than those of the Citizen’s Income for single person households. They would be scaled by more than the Citizen’s Income as household size increases and the scaling would not be capped. Overall transfers would decrease more gradually than under the Citizen’s Income as a beneficiary starts to earn income. Modest benefits that gradually decline as gross earnings rise would better address the trade-off between reducing poverty and encouraging work than the Citizen’s Income. Like the REI and Citizen’s Income, receiving the recommended reform package’s guaranteed minimum income would be conditional on participating in a tailored programme of job search and training programmes or other social support programmes.
The reform package proposes simplifying the tax system, notably by consolidating various tax credits into one that is linked to the individual’s income and the household’s structure. Along with the in-work benefits, the design of this credit would reduce the effective marginal tax rates for many households as they gain employment income at low wage rates. They would particularly reduce to negligible levels the participatory tax rate faced by a second earner moving into low-wage work (Table 1.6). The accompanying working paper (Bulman et al, 2019, forthcoming) presents the participation and effective tax rates. The relative generosity of the simplified family allowance and credit, with the guaranteed minimum income, would allow for the consolidation of other family benefits.
The recommend reform package’s overall fiscal cost is estimated at under EUR 8 billion in the short-term relative to 2018 policies (Table 1.6). This is similar to the 2019 budget estimate of the full-year cost of the Citizen’s Income. Within the recommended reform package, the guaranteed minimum income is estimated to cost about EUR 3 billion less than the Citizen’s Income. This estimate does not account for the boost to revenues entailed by higher employment rates, greater economic activity and improved productivity that the recommended reform package are expected to generate in the long term, underpinning the reform’s fiscal sustainability.
To support low income households while encouraging household members to seek formal employment, a growing number of OECD countries have adopted in-work benefits. These are also known as ‘make work pay’ policies as they provide a net income transfer to individuals or to households working a minimum number of hours and with employment incomes below specified thresholds. Designed correctly, these measures can improve employment rates, support the progressivity of the tax and benefit system, and reduce poverty. They can achieve this at lower cost for public finances than direct transfers to households. They can also be more effective at raising well-being for poorer households than increasing the minimum wage, which may reduce the number of low-wage jobs available.
The effects of the in-work benefits on employment rates and on redistribution are determined by whether eligibility and the size of in-work benefits are assessed against household as opposed to individual income and circumstances. Assessing eligibility against household income ensures that the benefit spending is better targeted towards poorer households. Studies of in-work benefits in various countries find that in-work benefits increase employment levels of primary earners. But assessing benefits against household income can create a high participation tax rate when the second earner starts working, as their income would make all earners in the household ineligible for the benefit. Overall this can lead to lower employment levels among second earners and lower employment for the household overall. Basing eligibility of in-work benefits on individual rather than household’s income and circumstance, as proposed in this Survey, has the advantage of generating stronger work incentives for second earners. This comes at the cost of poorer targeting of the benefit, as second earners who live in rich households and starting to work in low wage jobs would be able to claim the benefit.
Sources: Luca, Rossetti and Vuri (2014[13]), Eissa and Hoynes (2004[44]) Brender and Strawczynski (2018[42]).
Overall this section has shown that Italy can build on recent improvements in its social protection system to redress social and regional disparities by raising employment rates and incomes, and lowering poverty. Achieving this requires a reform package that provides a social safety net to low-income individuals while encouraging rather than penalising beneficiaries for moving into employment. A guaranteed minimum income combined with low-wage in-work benefits and reforms to the personal income tax can achieve this at modest fiscal cost. To be effective, tax and benefit policies need the support of effective administrative systems, capable of providing useful job-search and training policies as well as other social services.
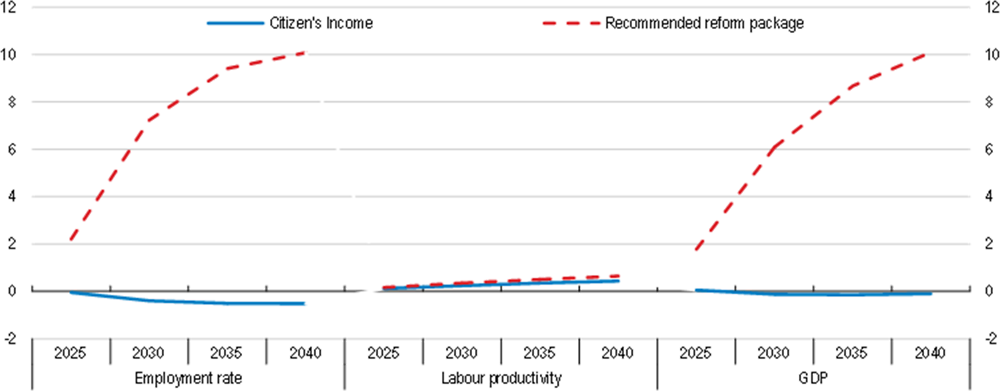
Note: Simulations account for the long-run macroeconomic effects of the Citizen’s Income policy package, and of the recommended reform package on disposable income inequality, on tax wedges at the average wage for singles and for couples with children, additional spending on active labour market programmes, and additional family benefits (see Table 4); they do not account for changes in pension and retirement policies.
Source: OECD simulations based on Guillemette and Turner (2018[43]).
Reforming social policies to support inclusiveness, productivity and growth
Strengthening employment services
Strengthening Italy’s public employment services (PES) is essential to improve job matching and labour market outcomes across the population. This has been made more vital by the PES having the lead role in implementing the Citizen’s Income. The PES play a small role in job matching (Figure 1.32) and lack the capacity and experience to administer a broad social protection programme such as the Citizen’s Income. Recognising these needs, recent government budgets allocated considerable additional resources to strengthen the PES’s capacity, including EUR 950 million over two years in the 2019 budget and rapid reform programmes are being developed. This follows the central government’s transfer in 2018 of EUR 235 million to regions for the PES. The increase in resources allocated to the PES is a positive step but a detailed multi-year plan on how to improve PES is yet to be defined.
Currently, Italy counts 550 public employment service centres, which are managed by regional administrations. Many of these centres, especially in lagging regions, lack the staffing and organisational capacity to fill their core employment service function (Figure 1.32), or to administer a programme as complex as the Citizen’s Income.
Citizen’s Income beneficiaries that enter an employment “pact” and many entering a social inclusion “pact” will be required to have ongoing engagement with the PES. The PES will need to be able to monitor and report on beneficiaries’ participation in their assigned programmes and take action if beneficiaries do not meet their obligations. In contrast, the REI operated through municipal social services, which would call on the PES to provide beneficiaries support with employment services, as part of a broader and package of tailored support. The Citizen’s Income encourages employers seeking staff to use the PES to fill their vacancies. If they hire Citizen’s Income beneficiaries through the PES, the employer will receive a rebate on their social security contributions.
Source: Calculations based on EU-LFS 2014, in Pacifico et al. (2018[45]).
Providing accessible and quality employment services across the country, especially in lagging regions, can contribute to reducing disparities and improving labour market outcomes for all people, including those not eligible for the Citizen’s Income (OECD, 2018[46]). Employment service capacity could expand faster if private employment agencies can complement the PES’ role in job matching. A trial programme provided job seekers with vouchers to use for employment services, including those provided by private agencies. The voucher’s value reflected the difficulty for the job seeker to find work given their characteristics. The Citizen’s Income rules restrict these vouchers to Citizen’s Income beneficiaries, excluding other job seekers, such as unemployment benefit’s recipients, reducing their access to employment services. Providing all unemployment benefit recipients with access to the vouchers may improve their prospects for finding work before their income loss leaves them eligible for the Citizen’s Income.
Improving coordination between ANPAL¸ the central agency responsible for overseeing regional PES, and PES is crucial to ensuing eligible beneficiaries can access the Citizen’s Income and receiving support to move into work. In 2017, regional and central governments agreed on minimum service standards, and regional governments must now provide performance data to ANPAL, which can identify where a region falls short. However, ANPAL lacks the power to enforce such standards as job-search and training policies fall within the remit of regional governments.
ANPAL needs additional power to strengthen regions’ PES services for the Citizen’s Income to produce results. For instance, ANPAL could have the responsibility of developing and implementing special restructuring programmes for those PES that repeatedly fail to reach the agreed standards. Such restructuring programmes could include management changes, structural reorganisation of PES and requalification of personnel. Strengthening accountability and incentives for regional PES to adopt best practice and improve performance would also help. Clarifying who is responsible for what and publishing data on the activities and performance of all PES would go in this direction, strengthening accountability and yardstick competition. Successful strategies also include making sufficient case staff available and disseminating information about the programme, even by directly contacting potential beneficiaries (Frazer and Marlier, 2009[15]).
Improving skills and training to support employment and formalisation
Encouraging on-the-job training is crucial to expanding employment and raising productivity and incomes. It can help workers move into the formal sector, especially when formalisation requires educational qualifications. Italy has achieved rapid expansion in access to adult skill education and training over the past decade. However, average adult workplace skills and training rates remain below many other OECD countries (Figure 1.33), especially in lagging regions (Figure 1.34). Stronger skills are in demand and approximately six out of ten jobs facing skills shortages are in high-skilled occupations (OECD, 2017[47]).
1. Formal and non-formal education and training
Source: Eurostat.
Technological change and automation, and Italy’s ageing population, add pressure to training systems, especially in lagging regions. About 15% of jobs in Italy are at high risk of automation and 35.5% may experience significant changes (Nedelkoska and Quintini, 2018[48]). Low-skill and low-wage jobs are at greater risk from automation (OECD, 2018[49]) and constitute more of the workforce in lagging regions. IT and computer skills are weak across the population. Population ageing leads to shifts in the demand for skills and for workers to adapt their skills as their working lives extend. In Italy, participation of 50-60 year old workers in skill training has risen but is still low.
Source: Eurostat.
The formal sector can invest in workers’ skills and readiness for new tasks and support formal employment by investing in on-the-job training. Strengthening apprenticeships is central, as has been outlined in previous Surveys (OECD, 2015[21]; OECD, 2017[22]). Training is particularly limited at SMEs, despite their skills needs. To improve workers’ readiness for vocational training and re-skilling, the government is implementing new measures to develop adults’ general and vocational skills (Box 1.6).
Italy’s Training Funds (Fondi Interprofessionali) are designed to support in-work professional training and can provide disadvantaged groups with access to training. Training Funds are less well-funded than equivalent schemes in other OECD countries and the government has reduced their resources since the crisis (OECD, 2019[119]). While there remain large gaps between JIPFs training offerings and skills needs, the gap has been closing. JIPFs’ role and management have been clarified by guidelines published in April 2018 by ANPAL.
Extending JIPFs’ purview from employed workers to the unemployed is welcome and can support participants’ entry into formal employment. This measure would be more effective if the quality of the courses and the skills gained by participants were certified, and if JIPFs were consolidated into funds linked with specific economic sectors. Stronger coordination with other stakeholders would better ensure that courses better reflect skills needs, and that programmes meet minimum operating standards.
Provincial Centres for School Education for Adults (CPIAs) were developed from the early 2010s to provide school-level learning to adults, as well as Italian language courses to immigrants. They provide sequential courses and recognise students’ progress through certificates and diplomas, including school-level diplomas. The Centres are usually organised by province and link with local authorities and the local labour market, and with regional educational institutions. 130 CPIAs operated across the country in 2018, and one CPIA in each region is mandated to research and develop adult education. A national monitoring system follows the centres and students, and found strong growth in enrolments, reaching 109 000 students, 14% of whom were aged 50 or older in the 2016/17 school year. Over 2 million Italians aged 25 to 64 have completed only primary school and 11 million have only a lower secondary school certificate.
Source: Benedetti (2018[50])
Lowering labour market informality and precarious employment
Increasing Italy’s share of formal and permanent employment would improve job quality. Workers in non-standard employment generally have lower productivity, lack opportunities to build their human capital, have more volatile incomes and are less protected from labour market risks (OECD, 2018[49]; OECD, 2018[46]).
A relatively large and growing share of workers are employed on temporary contracts and other non-standard arrangements (Figure 1.35). Also, the Italian statistical office estimates that 13.5% of Italian workers were undeclared in 2015, rising to 20% in lagging regions. In addition, about one in five Italian workers is self-employed, above OECD averages although the share has declined since the start of the recession (Jessoula and Pavolini, 2017[51]) About 8% of the workforce were ‘dependent self-employed’ in 2015, among the highest shares of any EU country (Williams and Lapeyre, 2017[52]). These workers who have the legal statue of being self-employed lack many of the employment protection and benefits of employees without enjoying the flexibility or autonomy of self-employment, as they have only one client and no authority to hire staff or take other strategic decisions about their operations.
Inclusiveness, equity and incomes in Italy would be supported by encouraging formalisation and employment in larger firms. Legislation passed in 2017 aims to strengthen protection for dependent self-employed workers, such as measures to improve work/life balance through access to parental leave or protecting workers on sick leave, although it is unclear how enforceable these measures will be in practice (European Commission, 2018[11]). A regulatory environment and tax and benefit reforms that encourage formal dependent employment may be more effective at reducing informality and precarious self-employment than targeted measures. These measures are likely to benefit lagging regions more, given their higher incidence of informal work and self-employment.
Note: Non-standard employment accounts for individuals in temporary contracts (both full- and part-time) and workers in a permanent part-time employment relationship.
Source: OECD (2018), Job Creation and Local Economic Development 2018: Preparing for the Future of Work, OECD Publishing, Paris.
Firms and workers will formalise if they perceive that formalisation brings greater benefits than costs. Italy’s large tax wedge imposes a sizable cost to formalising, by reducing the income that formal employees retain relative to their employment cost, as well as lowering output (Akgun, Cournède and Fournier, 2017[53]). This adds to the costs of the regulatory environment and effectiveness of the public administration (OECD, 2017[22]).
The 2019 budget introduces a disincentive for the self-employed and small firms to grow and become part of larger organisations by decreasing the tax burden for low income self-employed and micro enterprises. The budget enlarges the simplified tax regimes (forfeit regime) available to self-employed and micro enterprises by raising to EUR 65 000 the income threshold taxed at 15%. The lower tax rate is applied to the gross turnover of the SME multiplied by a profitability index which is dependent on the firm’s sector of activity. The 2019 budget also introduces a reduced tax rate at 20% for SMEs with turnover between EUR 65 000 and EUR 100 000, effective from 2020, with the purpose of flattening the marginal tax rates when the turnover rises above the EUR 65 000 threshold. Simplified tax regimes and reduced tax rates for self-employment or small businesses need to be carefully designed to directly address any market failures that affect the intended beneficiaries, otherwise they risk adding to the system’s complexity or unintendedly discouraging businesses’ growth (OECD, 2018[49]).
Greater access to quality childcare would strengthen work incentives and improve wellbeing
Access to care for very young children raises women’s likelihood of seeking work (Olivetti and Petrongolo, 2016[55]; Figari and Narazani, 2017[56]; Tavora, 2012[57]). Also, childcare facilities improve children’s performance through the course of their education and can particularly benefit disadvantaged households (OECD, 2017[58]). When affordable facilities are not accessible, families turn to family members to care for children. This may be less pedagogical, and relying on this care makes relocating to other regions with better employment opportunities more difficult (OECD, 2017[58]).
During the 2013/14 school year, less than a quarter of children under three had access to childcare facilities in Italy, less than in 2005 (OECD, 2017[58]). Far fewer places were available in lagging regions than in higher income regions (ISTAT, 2016[59]). The amount and share of total costs paid by parents vary considerably between regions, as does the total spending per child, which suggests that the quality of care varies considerably. From the age of three, children have access to 40 hours of free pre-primary education per week and all regions record near-universal enrolment.
Italy would benefit from following examples of other European countries which have expanded access to quality and affordable childcare (León and Pavolini, 2014[60]; Tavora, 2012[57]). These countries ensured that childcare places are widely accessible to all households, including those where the spouse is not currently in full-time employment, and that the places offer quality education and care for the children at a cost that is proportionate to the income that parents would gain from entering work (Colonna and Marcassa, 2015[12]). In Italy, a national plan was approved in late 2017 and established a national governing body to support, monitor and evaluate an integrated early childhood education and care system. It provides a small amount of additional funds to regions where enrolment rates are lower than the national average. Building on this step and monitoring its effectiveness are necessary complements to improve early childhood education while supporting families’ participation in the workforce.
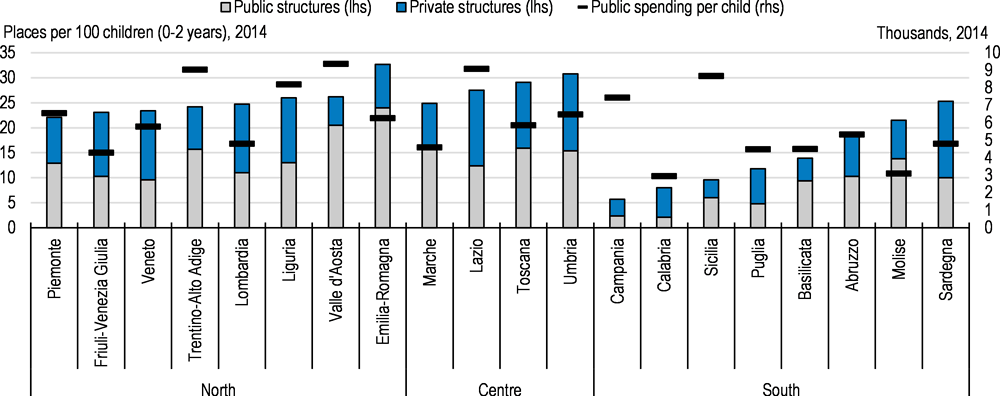
Note: Public spending refers to both the municipal structures and the fees and contributions paid by the municipalities for users of private services. The definition of structure includes traditional nurseries, micronurseries, farm nests and spring sections.
Source: ISTAT (2017), "Nurseries and other socio-educational services for the early childhood", Press Release, 12 December 2017; and OECD calculations.
Making regional development policy more effective to boost economic dynamism
Italy’s regional development policies have not been effective at narrowing the large north-south divide in terms of income and well-being. Lagging regions’ lower quality public administration hinders services for populations with the greatest needs, and impedes investments and productivity improvements. This section proposes possible remedies to tackle regional divides while underlining that increasing the efficiency of the central and local public administrations is a necessary condition for more effective regional policies and to provide the public goods and services that people and firms rightly expect.
Policies have failed to narrow the long-standing and large regional divide
Italy’s geographical inequalities are deeply entrenched and the debate about their causes and remedies is as old as the Italy unitary state (Felice, 2007[61]; Federico et al., 2017[62]). Italian policymakers have attempted to address the “Mezzorgiono problem” since the early 20th century. After World War II, the government allocated substantial resources to southern regions through the Extraordinary Intervention for the South programme. This programme was implemented by the agency “Cassa per il Mezzogiorno” and then AgenSud. It lasted until 1992 (Box 1.7). The 1950s and 1960s was the only period since unification when GDP per capita of southern regions grew substantially faster than in the Centre and the North (Box 1.8).
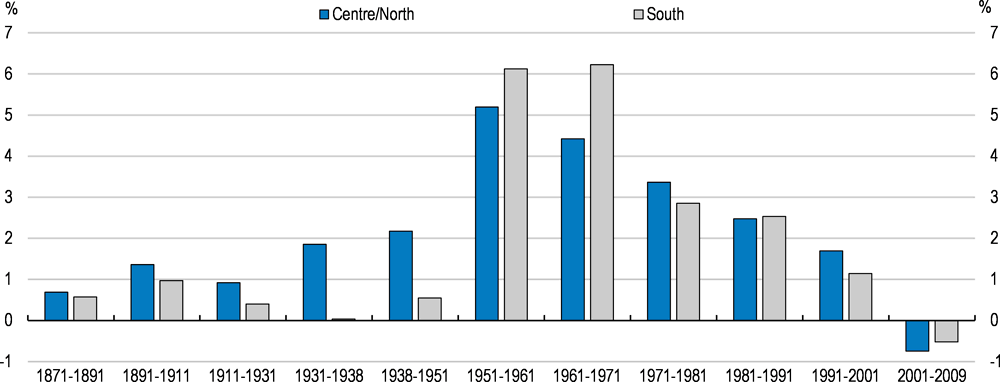
Source: Felice, E. and G. Vecchi (2015[63]), "Italy’s Growth and Decline, 1861–2011", The Journal of Interdisciplinary History, 4(5).
As highlighted in the previous sections, differences in living standards between northern and southern regions are explained mainly by lower employment rates in southern regions. The Extraordinary Intervention for the South (EIS) programme and the “Cassa”, along with AgenSud (discussed in Box 1.7), failed to create the conditions for a self-sustaining convergence process in employment and productivity growth rates. There are two main reasons for this:
-
Firstly, focussing mostly on physical capital accumulation, the EIS failed to develop the technological and institutional capacity of southern regions. This would have required more investment in human and social capital, as well as other soft infrastructure, such as the efficiency of the public administration. Massive physical capital investment in the 1950s and 1960s failed to boost employment rates and entrepreneurship in southern regions (Felice, 2010[64]; Zamagni, 2010[65]).
-
Secondly, from the 1970s onwards, rising political interference and the curtailment of the autonomy of the “Cassa” led to resources being redirected from productive investment to redistributive programmes (Felice and Lepore, 2017[66]; La Spina, 2003[67]), contributing to halting the convergence process (Box 1.7). Moreover, the oil shock greatly diminished the comparative advantage of heavy industries, which was the basis of southern regions’ convergence.
The current institutions managing Italian regional policy were developed in the early 2010s (Box 1.8). Two agencies are responsible for regional development: the “Dipartimento per le Politiche di Coesione” (Department of Cohesion Policies, DCP) and the “Agenzia per la Coesione Territoriale” (Territorial Cohesion Agency, TCA) The DCP plans investment strategies and policies for regional development and convergence, spanning physical infrastructure, social investments, such as education and skills, and wellbeing. It acts through the Territorial Cohesion Agency (TCA), which leads monitoring activities and provides support to ‘managing authorities’ of regional and national development programmes. Also, in 2016 the government created a new political-level coordinating committee within the Prime Minister’s Office to facilitate the coordination of planning and monitoring of regional development funds among central and sub-national governments. Moreover, Invitalia – a company owned by the Ministry of Economy and Finance working in close cooperation with the Industry and Development Ministry – has responsibilities, among other things, to support the public administration for the effective management of EU structural funds. It also supports local cohesion policies developed by the public administration, and leads on public contracts.
Despite these changes, deficient planning and coordination as well as long delays in project execution still hamper the effectiveness of Italian regional policies and the utilisation of EU cohesion and social funds (Figure 1.34). Commitments and payments relating to the 2014-2020 programming period proceed slowly. As at end-2018, for the 2014-2020 programming period commitments amounted to 30.4% of the total allocated funds for the whole country and payments to just 12.2% (Figure 1.38). Southern regions are performing considerably worse than central and northern regions (Figure 1.39). Spending has mostly involved improving processes and institutions to manage projects, not the realisation of projects themselves (SVIMEZ, 2017).
Delays in committing and spending the available funds have several causes. The central governments still lacks much needed coordination powers and capacity to formulate and implement a coherent regional development strategy, as highlighted in the previous Survey (OECD, 2017[22]). This problem partly stems from the constitution (Art 117) as it grants regional governments large powers on issues relating to regional development, such as national energy and transport networks. However, many sub-national governments, especially in lagging regions, still lack the capacity to plan, select and execute projects of high quality and on time. Projects in lagging regions, where public administration is less efficient, suffer from longer delays than in more developed ones (Court of Auditors, 2018[68]). Also, as is shown below, local public administration in lagging regions tend to be less efficient than in more developed regions.
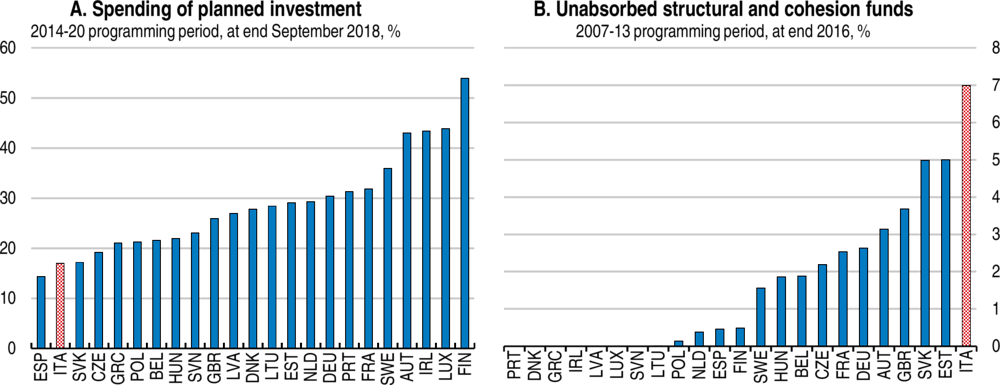
Source: European Commission (2018), Open Data Portal for the European Structural and Investment Funds (https://cohesiondata.ec.europa.eu/).
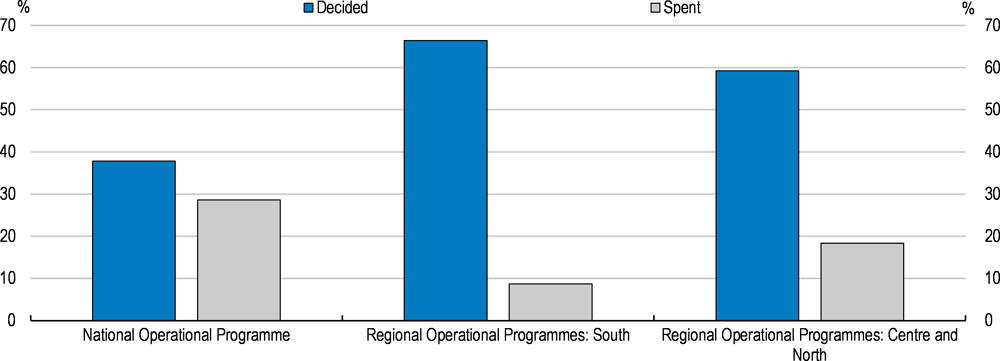
Source: European Commission (2018), Open Data Portal for the European Structural and Investment Funds (https://cohesiondata.ec.europa.eu/).
Problems are not confined to sub-national levels. The shares of commitments and payments relating to the National Operational Programmes, which are managed centrally, are also low (Figure 1.39). By November 2017, the central government used only 42.5% of the funds shifted in the early 2010s – supposedly to accelerate spending – from the national co-financing quota of EU funds to the Actions and Cohesion Plan (Patto Azione Coesione, ACP) (Court of Auditors, 2018[68]).
Italian regional development policies started in 1904 with special legislation promoting industrial activities in Campania and infrastructure investment, mostly in Basilicata and Calabria). These early interventions were limited however; in addition, the onset of World War I altered government policies and in the inter-war period the “Mezzogiorno” problem stopped being seen as priority. Overall, from unification up to World War II the gap in living standards between northern and southern regions increased. In 1951, GDP per capita in southern regions (including islands) was 60% the national average compared with 88% in 1891 (Felice, 2010[45]).
The development of southern Italy became one of the most important national policy objectives after World War II. In 1950, the government launched a large regional programme called the Extraordinary Intervention for the South (EIS) – implemented by the agency “Cassa per il Mezzogiorno” – possibly the largest of such programmes in western Europe. Overall, the EIS and the operation of the “Cassa” were inspired by the mainstream development theories of the day, which saw physical capital accumulation as key to economic progress. The operation of the “Cassa” mostly revolved around direct infrastructure spending and, after 1957, state subsidies for investment in capital-intensive industries. Also, state-owned enterprises were required to direct 60% of their new investments and more than 40% their total assets to the South (Felice, 2010[64]).
During its first two decades, the operations of the “Cassa” yielded fruit. During the 1950s and 1960s, GDP per capita in southern regions converged towards the Northern regions’ levels, driven by labour productivity growth. This is the only period Italy experienced regional convergence since unification (Felice, 2010[64]), driven by large physical capital accumulation, especially in heavy industries. However, during the same period, the employment rate in southern regions declined even further from the national average (from 89% to 77%) as the EIS neglected labour intensive industries.
Yet, by the 1970s, southern regions’ convergence started reversing. The oil shock played an important part in this as it hurt the comparative advantage of heavy industries. Yet, purely domestic causes also contributed. The “Cassa” lost most of its autonomy in the mid-1960s. The creation of the regions in the early 1970s aggravated political interference with the result that fund allocation decisions were increasingly driven by political clientelism and based on distributional rather than development motives (Felice and Lepore, 2017[66]; La Spina, 2003[67]). Also, from the mid-1970s most of the subsidised credits provided by the “Cassa” was redirected to industries in the North-West.
The “Cassa per il Mezzogiorno” closed in 1983 and was replaced by AgenSud, though this was no longer the only agency charged with the development of Southern Italy (Felice and Lepore, 2017[66]). AgenSud was plagued by similar problems that affected the “Cassa” in its last decades. In 1992 the government closed Agensud, formally ending the Extraordinary Intervention for the South. In its place the government ushered in a new system of ordinary programmes targeting all lagging areas and not just the South (La Spina, 2003[67]).
Execution problems at central and sub-national levels concerning large projects and deficient coordination of sub-national governments and agencies lead to too many small projects. This results in excessive fragmentation and lower synergies, in addition to heightening risks of corruption (ANAC, 2018[69]). Delays are especially pronounced for infrastructure projects and those above EUR 5 million, underlining the difficulties in completing complex projects. In addition to engendering inefficiencies and waste, long delays also mute the effects of regional development funds on the economy as funds are spent over longer periods (Court of Auditors, 2018[68]).
The practice of overbooking and attaching EU funds to past projects already completed or funded by the national resources remain far too common. Overbooking consists in proposing many small projects with a total value higher than the available funds so as to have a large pool of reserve projects to replace those that may be rejected or turn out impossible to execute. For instance, 44% of allocated EU funds for the 2007-2013 regional operational plan of Calabria concerned past projects (Court of Auditors, 2018[68]). EU rules allow for the practice of attaching structural and cohesion funds to retrospective projects, provided that these funds are spent on alternative projects in line with the pre-agreed objectives and in the same geographical area.
Overbooking and retrospective projects enable regions to maximise the rate of absorption of EU funds. Yet, they undermine the unity of the national development strategy and the quality of projects by increasing fragmentation and reducing synergies, even if consistent criteria are applied in selecting projects. Overbooking and retrospective programmes also weaken appreciably the principle of additionality of EU funds. As at the end of 2015 (the end of the 2007-2013 EU programming period), the contribution of national resources was EUR 15 billion (nearly 1% of GDP) lower than originally planned (Court of Auditors, 2018[68]).
Improving the planning, execution and monitoring of regional development funds is imperative for narrowing the regional divide. The government should rationalise the institutional framework of regional development policies by clarifying responsibilities. The roles and responsibilities of the DCP with the TCA, alongside Invitalia and the political coordination committee overlap to a large extent, generating administrative complexity and blurring responsibilities. A simpler institutional framework, remaining centred in the Prime Minister’s Office would enable closer links between programming and monitoring activities, improve coordination of sub-national governments and agencies managing projects, enhance accountability and clarify the chain of command. Wales provides a good examples of a streamlined institutional framework that has succeeded in absorbing EU funds (Box 1.9). A simpler institutional setting will also make it easier to institute effective mechanisms to identify and disseminate best practices the use of EU funds. Creating a databank and network of experts in EU funds from different central and sub-national bodies to identify and disseminate best practices would go in this direction.
The Extraordinary Intervention for the South (EIS) ended in 1992 and was replaced by a new system of interventions targeting all lagging areas and not just the South of Italy. The new system was shaped around the EU social and cohesion policy programmes and consistent with EU competition and state aid rules. It however lacked a clear strategy and objectives. The government underestimated the resources and time needed to comply with the administrative and financial rules attached to EU funds (Ismeri Europa, 1992). Thus, Italy failed to use on time a large part of the EU cohesion policy funds during the 1994-1999 programming period. The same problem persists nowadays.
In the late 1990s, the government attempted to reform the regional development policies with the “Nuova Programmazione” (New Programme, NP). The NP was meant to break with past practices and shift Italy’s regional policy towards a place-based approach (Barca, 2009[12]). The NP rightly aimed at diminishing subsidies and contributions to firms while increasing spending on infrastructure, research and development, and education, aiming at providing essential public goods and services tailored to the needs of lagging regions.
The participation of local governments and agencies in the NP was key to this process. Regions acquired further responsibilities, in line with the constitutional reform of 2001 that devolved additional powers to sub-national governments. In the late 1990s the government created the Department of Development and Cohesion Policies (Dipartimento per le Politiche di Coesione e Sviluppo), within the Ministry of the Economy, to better coordinate central and sub-national governments and agencies and improve programming and monitoring. In the early 2000s, a new single fund Fund Aree Sottoutilizzate (FAS) was established to fund all regional development policies and co-finance EU funded projects as well as ensuring that EU funds do not replace ordinary administration expenditure but add to it (i.e. additionality).
Overall, the NP did not live up to expectations (Barca, 2010[70]). The shift from contributions and subsidies towards infrastructure investment, research and development and education has been partial and incomplete. Increasingly, EU and national regional-development funds substituted for ordinary administration funds, which questions the very existence of a regional policy in Italy. The central and local government have not acquired the capacity and willingness to evaluate policies and projects proposed by central and sub-national bodies and select only the most effective ones. Often funds have been redirected to objectives reflecting social assistance and political criteria rather than development objectives. For instance, FAS funds were used to help farmers fined by the EU for exceeding milk quotas in the 1990s (Viesti, 2011[71]; La Spina, 2003[67]).
The onset of the global financial crisis in the late 2000s caused a break in Italian regional development programmes. Regional programmes were halted and funds suspended. Over 2008 and 2009, because of severe budget constraints, the government shifted most of the EUR 64 billion allocated to FAS over the EU 2007-2013 period to other uses that had nothing to do with regional development. As a result, the 2007-2013 National Strategic Plan was dismantled in all but name (SVIMEZ, 2001; 2015). In the end, the FAS was closed and replaced by Fondo per lo Sviluppo e la Coesione (Cohesion and Development Fund). Two agencies – the “Agenzia per la Coesione Territoriale” (Territorial Cohesion Agency, TCA) and the “Dipartimento per le Politiche di Coesione” (Department of Cohesion Policies, DCP) – were established within the Prime Minister’s Office (Presidency of the Council of Ministers) to oversee regional development policy.
Wales has been highly successful in attracting EU structural funds and the Welsh European Funding Office (WEFO) has played a key role in this. The WEFO is a division of the Welsh Government and is in charge of selecting public and private-sector projects to be funded with EU structural funds. To this end it provides a range of guidance to help ensure projects’ proposals are in line with EU programmes’ requirements and EU regulations on evaluation, audit and publicity. The Programme Monitoring Committee (PMC) plays also an important role. The PMC comprises public and private sector representatives and is responsible for regularly monitoring the effective delivery of EU structural funds and considering how to use funds to achieve maximum impact.
WEFO conducts open call to the public and private sectors for projects' proposals. Projects need to be consistent with guidelines established by the European Union and WEFO and are overseen by a project-sponsor organisation. The guidance offered by WEFO spans different areas, such as compliance, eligibility, procurement, economic priorities, cost accounting, monitoring and evaluation. This information is all publicly available.
Projects need to go through a competitive procurement processes. Project sponsors register their idea on the ‘Expressions of Interest’ section on the government internet portal. They have to indicate how and what the project will deliver taking into consideration the programme’s indicators and how proposed operations would align with the Economic Prioritisation Frameworks. To choose among projects, WEFO employs a set of multiple criteria including: strategic fit, delivery, finance and compliance, outcomes, value for money and long-term sustainability. When the project is accepted for funding, WEFO delivers the grant, monitors progress, evaluates its impact and makes sure that the project conforms with regulations.
Local public administrations are key to effective regional policies
Improving the quality of subnational public administration is crucial for redressing Italy’s social and regional divide. Local public administrations in lagging regions are less efficient (Figure 1.40) and provide fewer essential public goods and services. As a result, these regions experience lower productivity and living standards. Empirical evidence indicates that public administration efficiency leads to higher firm-level productivity growth (Garda, Fadic and Pisu, 2019).
In Italy, sub-national governments are responsible for providing many public goods and services, though these are often funded by central government transfers (Table 1.10). While the regional development policies provide some additional resources, public spending on standard public goods and services dwarfs these additional resources. Regional development policies alone, given their limited budget and reliance on implementation by subnational governments, are unlikely to offset the inefficient and insufficient provision of basic public goods and services and promote regional convergence (Cannari, Magnani and Pellegrini, 2009[72]).
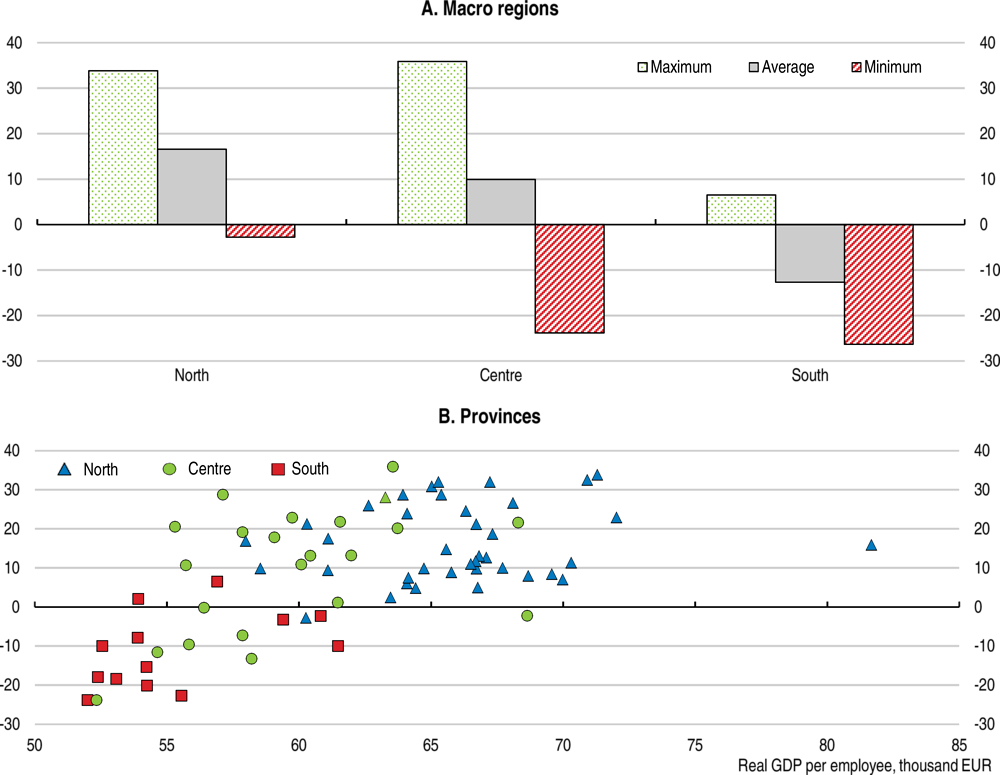
Note: The administrative efficiency index is the percentage difference between assessed spending needs given each region’s conditions and realised spending.
Source: OECD Regional Statistics database; and OpenCivitas.
Improving the efficiency of the central and local public administration is then crucial to promote regional convergence (Barca, 2009[73]; OECD, 2009[74]). Local underdevelopment may reflect either lack of the capacity or the unwillingness of local elites to tackle the sources of persistent underutilization of resources and social exclusion. One approach is for central government to focus on achieving needed improvements to local governance and public administration and to improve the choices of local governments (Barca, McCann and Rodríguez-Pose, 2012[75]). This was found to be effective for the US (Glaeser and Gottlieb, 2009[76]; Austin, Glaeser and Summers, 2018[77]). In France, better regulations that promotes growth in lagging cities (such as more efficient local public administration) was found to raise aggregate productivity and welfare whereas subsidies to encourage firms to locate in such places have the opposite effect (Cecile Gaubert, 2018[78]).
Increasing transparency and accountability will help. Building platforms and networks of experts for the identification and dissemination of best practices and further promoting yardstick competition at central and sub-national levels may make politicians and public managers more accountable to the population and the population more aware of available best practices. Those public administration agencies at central and local levels that repeatedly fail to reach minimum standards or agreed targets should undergo a reorganisation process involving, if necessary, management changes and requalification of personnel.
Harnessing agglomeration economies to promote regional development
In Italy and other advanced countries, cities are an important driver of growth and innovation, and they account for a large share of economic activity and employment. Across OECD countries, metropolitan areas (defined as urban agglomerations with more than 500 000 inhabitants) account for roughly half of the population and more than half of GDP. Various factors affect the economic and social performance of cities, but there are some broad patterns across most cities. For instance, larger cities (in terms of population) are generally more productive. Cities’ higher productivity and prosperity also raise the economic performance of their hinterlands up to a distance of 200-300 kilometres (OECD, 2015[79]).
Large compact cities engender environmental benefits. Larger cities perform well in terms of per capita contributions to soil sealing or climate change. Spreading populations over larger areas would not generate systematic ecological benefits. Urban sprawl around Italian cities has contributed to an increase in built-up areas. Population density in Italian metropolitan areas has diminished and fragmentation of urban settlements has increased (OECD, 2018[80]). In Italy, the share of urban populations residing outside of the centres of functional urban areas is higher than the OECD average (OECD, 2018[80]). Residents of peripheral municipalities are more likely than in the past to work in the urban centres, raising commuting. Rising urban sprawl fosters car dependency and traffic congestion, raises pollution, energy consumption and CO2 emissions markedly (OECD, 2018[80]) It also raises the cost of providing electricity and water infrastructure as well as public transport.
In Italy, metropolitan areas’ productivity advantage is no different from European peers (Figure 1.41). However, Italian metropolitan areas in the southern regions have lower labour productivity levels than those in northern ones, given the same population, indicating weaker agglomeration economies. Metropolitan areas in the South have similar population density to those in the North, suggesting that cities’ population density or structure of cities does not explain the differences in productivity (Figure 1.42). Giovanelli and Pisu (2019) show how the efficiency of local public administration is positively associated with the strength of agglomeration economies.
OECD research has shown that the governance structure of metropolitan areas is an important determinant of their economic, social and environmental performance. Italian metropolitan governance bodies are weak. This is because their establishment is incomplete as with the rejection of a constitutional change in December 2016 provinces retained the functions that should have been transferred to metropolitan bodies (Box 1.11). Given this institutional setup, three factors handicap the operations of metropolitan governance bodies: responsibilities overlapping with those of regions and municipalities (Table 1.9); administrative borders not coinciding with the functional urban areas (Figure 1.43); and low budgets.
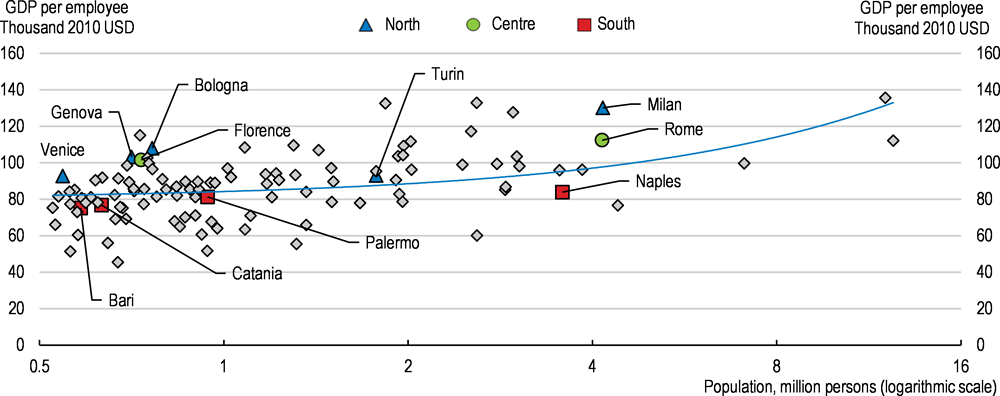
Note: Metropolitan areas have a population of 500 000 or more and are from over 30 OECD countries, defined following a harmonized functional definition developed by the OECD, in cooperation with the European Commission.
Source: OECD Metropolitan Areas database; and OECD Regional Statistics database.
Effective governance arrangements would improve coordination of policies across municipalities. Coordinating policies is especially important in metropolitan areas where municipal borders do not correspond to today’s functional urban area but to past administrative borders. This mismatch contributes to coordination problems and increases the need for effective governance structures (Box 1.10).
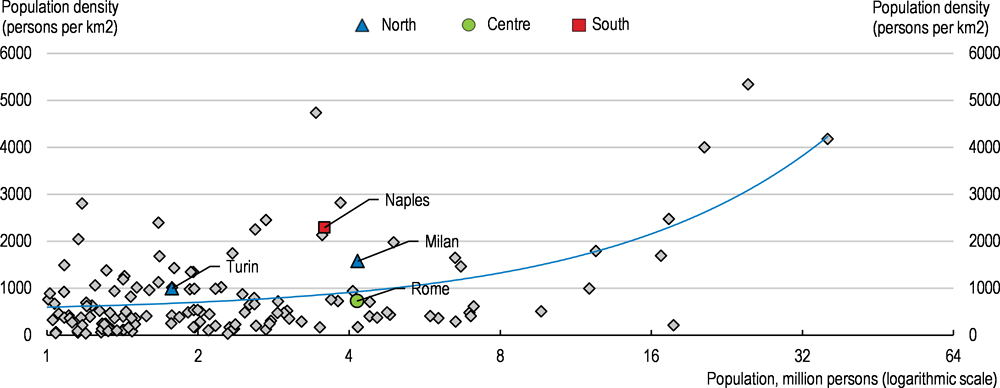
Note: Metropolitan areas have a population of 500 000 or more and are from over 30 OECD countries, defined following a harmonized functional definition developed by the OECD, in cooperation with the European Commission.
Source: OECD Metropolitan Areas database; and OECD Regional Statistics database.
Progress in this area will hinge on regions and municipalities deciding to share some of their functions with metropolitan bodies. So far, regions have been reluctant to transfer some of their competences; in a few cases (Turin, Milan, Florence and Bologna) cooperative frameworks have been set up; in others (Venice, Naples and Bari), regions have shown less willingness to establish a cooperative approach (Crivello and Staricco, 2017[81]). Introducing incentives to foster cooperation between regions and metropolitan governance bodies would go in the right direction.
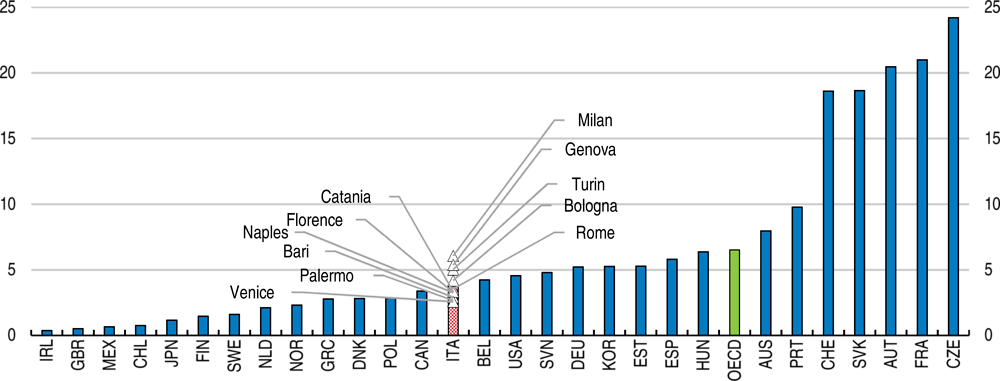
Note: The OECD-EU definition of functional urban areas (FUA) has not been applied to Iceland, Israel, New Zealand and Turkey. Metropolitan population figures are estimates based on municipal figures for the last two censuses available for each country.
Source: OECD Metropolitan Areas database; and OECD Regional Statistics database.
OECD research has identified the following elements to improve the governance arrangements of metropolitan areas:
-
Encourage long-term co-operation: There is no one-size-fits-all model of metropolitan governance; however, experience suggests that metropolitan governance reforms need to go beyond purely institutional changes and build a long-term process of co-operation. Central governments can play a central role in this process by providing leadership and incentives.
-
Fit governance arrangements to local conditions: The presence of a metropolitan authority does not alone guarantee better policy co-ordination; even once well-functioning governance structures may eventually need to evolve. A risk commonly encountered is that governments may attempt to replicate a specific type of metropolitan governance arrangement that is considered successful in one place, but which may not be entirely transferable into a different socio-economic context.
-
Focus not only on the outcome of the governance reform but also on its process: When looking to adopt a metropolitan governance arrangement, governments should assess not only the trade-offs associated with each reform, but also the process of designing, implementing and sustaining the reform.
Source: OECD (2015[82])
A 2001 constitutional change raised metropolitan governance bodies to the rank of constitutional entities alongside regions, provinces and municipalities. However, they remained only on paper until 2014 when a law tried to reorder the responsibilities of provinces and metropolitan governance bodies. This law transferred to metropolitan governance bodies all functions of provinces; and set the borders of metropolitan governance bodies to follow those of provinces. Also, metropolitan governance bodies gained additional responsibilities covering: strategic development of the metropolitan areas; development and integrated management of services, infrastructure and communications network; and, international relations.
The 2014 law was linked to a broad constitutional reform that aimed, among other things, at suppressing provinces and transferring their funds and responsibilities to metropolitan bodies. However, the constitutional reform was rejected in a referendum in December 2016 and the provincial administrations retained their functions and funds, undermining the role of metropolitan governance bodies.
Governance and outcomes are likely to be better when administrative boundaries match the functional urban area. However, this is only the case in Bologna and Florence. For most other cities, the functional urban area is smaller than the administrative metropolitan area; in Milan, Rome and Naples the city is smaller than the functional area. Metropolitan governance bodies can have difficulty managing metropolitan development in areas outside their administrative borders. Stronger incentives to use territorial pacts (agreements to coordinate local policies and actions to promote economic development), and “accordi di programma” (agreements favouring institutional cooperation in implementing policy decisions) would help overcome this problem.
Funding sub-national governments according to needs and capacity
The allocation of resources across regions is an important lever for regional development and creating potential incentives for local administrations to improve their performance. The 2009 legislation on fiscal federalism introduced a new mechanism for horizontal fiscal equalisation based on sub-national governments’ expenditure needs and fiscal capacity, replacing the historical expenditure approach (Box 1.12). The share of funds allocated to local governments based on needs (rather than historical spending) rose to 45% in 2018 from 20% in 2015. In 2019 it will rise further to 60% and reach 100% in 2021 (SOSE, 2018[83]).
The new system holds the promise of strengthening accountability at local levels and should be pursued as planned. This can result in stronger pressures on local politicians to increase public administrations’ efficiency and effectiveness. The data, methodology and results of this exercise are available on the website www.opencivitas.it. In addition to allowing the central government to set transfers to local governments based on actual needs, the volume of data available and ease of access enable the benchmarking of local administrations across several dimensions, thus promoting yardstick competition.
Following Law 42/2009 on fiscal federalism, the government is implementing a new fiscal equalisation mechanism based on actual expenditure needs. The 2009 law follows the 2001 Constitution constitutional change in the same direction. The aim of this reform is to grant more responsibilities to and enhance tax autonomy of sub-national governments (regions, provinces, municipalities, and metropolitan areas), while guaranteeing national solidarity and cohesion. The reform also aims at promoting public administration efficiency through stronger accountability. Policies under the remit of sub-national governments vary but they are important, covering education, labour market polies, health and others (Table 1.10). Subnational governments are responsible for about 26% of total public spending and slightly less than 20% of total revenues (Figure 1.44).
The new system is based on information collected by sub-national governments to estimate standard expenditure needs, standard levels of services and fiscal capacity. The fiscal gap is computed as the difference between standard expenditure needs and fiscal capacity. Transfers are then determined based on the fiscal gap. The estimation of standard expenditure needs and services levels considers the geographic and socio-demographic characteristics of the resident population. For instance, at the municipal level the overall standard expenditure need is based on: population and demographic characteristics, levels of services provided (number of students, and assistance to children with handicaps), geographic features (earthquake risks, altitude, surface area), input prices (rental housing index), social hardships (number of families in absolute poverty), traffic and vehicles, tourism (number of tourists and museum visitors), investment over the past five years and other factors. Brunello et al. (2014) and Ballanti et al. (2014) provide a detailed explanation of the methodology.
Sub-national governments’ efficiency indices are computed combining the expenditure gap and the output gap. The expenditure gap is the difference between actual expenditure and the estimated standard expenditure needs. This can be considered as an input-oriented efficiency index. The output gap is the difference between the actual level of services provided and the estimated standard level of services. This can be considered as an output-oriented efficiency index. Italy is not the first country to adopt such a methodology to assess the performance of local governments or agencies – especially with regard to expenditure needs. Recent examples include the Comprehensive Performance Assessment in England, the Australian Review of Government Service Provision and Norway's KOSTRA system (e.g.: Mizel, 2008). The methodology adopted by Italy is the most advanced across OECD countries.
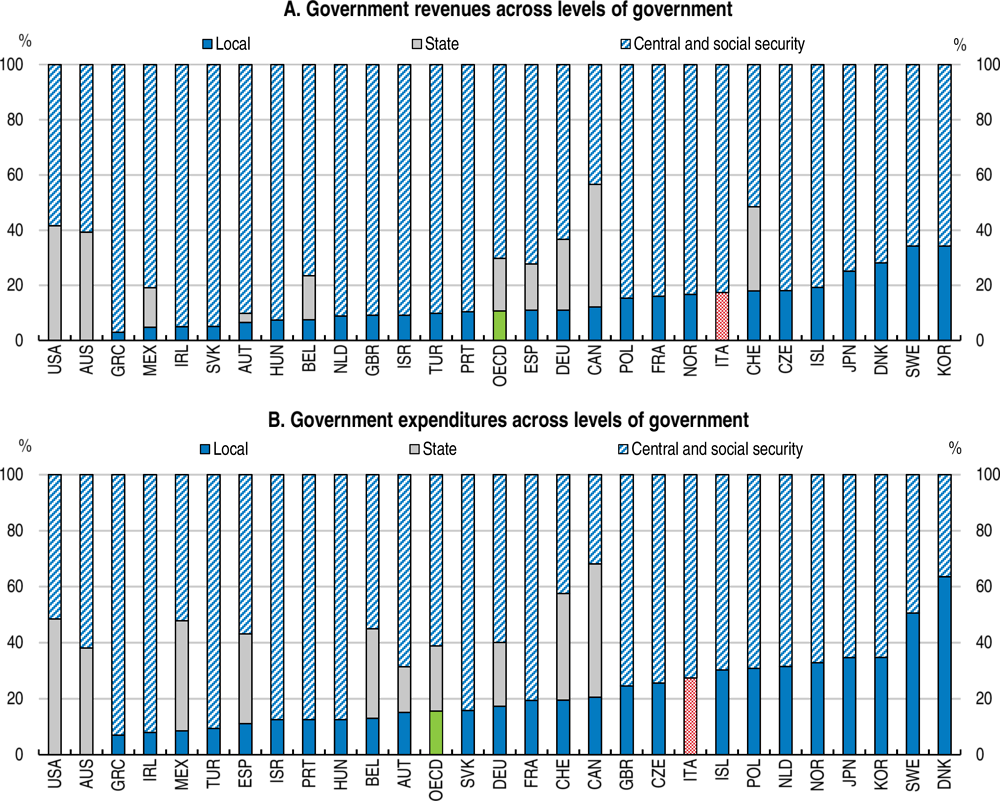
Source: OECD (2018), Subnational governments in OECD countries: Key data (brochure); OECD (2017), Government at a Glance 2017, OECD Publishing, Paris.
-
Reduce the labour income tax wedge on low-income workers and second earners through lowering employer social security contributions and tax and benefit reforms, while maintaining the personal income tax system’s progressivity.
-
Taper off Citizen’s Income benefits as incomes rise to encourage beneficiaries to seek employment in the formal sector and introduce an in-work benefit for low-income earners.
-
Simplify personal income tax credits and family benefits, while maintaining the progressivity of the personal income tax and a simplified family benefit.
-
Ensure capacity to administer the Citizen’s Income by building on, and strengthening, where necessary, municipalities’ social assistance services and establishing strong collaboration with public employment services.
-
Develop and implement a multi-year plan to revamp public employment services based on enforcing essential service standards and higher investments in IT systems, profiling tools and human resources.
-
Grant to ANPAL the power to restructure public employment services that repeatedly fail to meet commonly agreed performance targets.
-
Expand access to training and re-training courses for adults that provide certification and are developed with employers to meets local labour market needs.
-
Provide more quality child infant care places at a low cost relative to average wages, prioritising regions with low female employment.
-
Rationalise and improve coordination among bodies involved in regional development policies by strengthening the role and expertise of central government bodies.
-
Build platforms and networks of experts for the identification and dissemination of best practices in different policy areas and further promoting yardstick competition at central and sub-national levels.
-
Empower metropolitan governance bodies with the transfer of some of the powers of regions and provinces.
-
Restructure operations relating to waste management of those sub-national governments that repeatedly fail to reach targets for waste collection and recycling.
References
[53] Akgun, O., B. Cournède and J. Fournier (2017), “The effects of the tax mix on inequality and growth”, OECD Economics Department Working Papers, No. 1447, OECD Publishing, Paris, https://doi.org/10.1787/c57eaa14-en.
[14] Alm, J. (2005), “Taxing the “Family” in the Individual Income Tax”, Public Finance and Management, Vol. 5/1, pp. 67-109, https://www.researchgate.net/publication/241558261 (accessed on 9 January 2019).
[128] ATR (2018), Rapporto annuale 2018, Autorità di Regolazione dei Trasporti, Turin, http://www.autorita-trasporti.it/rapporti-annuali/rapporto-annuale-2018/ (accessed on 9 January 2019).
[77] Austin, B., E. Glaeser and L. Summers (2018), “Saving the heartland: Place-based policies in 21st century America”, BPEA Conference Drafts, March 8–9, 2018, Brookings Papers on Economic Activity, https://www.brookings.edu/wp-content/uploads/2018/03/3_austinetal.pdf (accessed on 29 October 2018).
[39] Baldini, M. et al. (2018), “The Impact of REI on Italian Households’ Income: A Micro and Macro Evaluation”, SSRN, https://doi.org/10.2139/ssrn.3167745.
[156] Ballanti, D. et al. (2014), “A Simple Four Quadrants Model to Monitor the Performance of Local Governments”, CESifo Working Paper Series, https://ideas.repec.org/p/ces/ceswps/_5062.html (accessed on 11 March 2019).
[70] Barca, F. (2010), “Discussione a Politiche nazionali o regionali?”, in L. Cannari, D. (ed.), Atti del Convegno Il Mezzogiorno e la Politica Economica dell’Italia, Bank of Italy, Roma 26 novembre 2009.
[73] Barca, F. (2009), An agenda for a Reformed Cohesion Policy: A place-based approach to Meeting European Union Challenges and Expectations, Independent Report prepared at the request of Danuta Hübner, Commissioner for Regional Policy, http://ec.europa.eu/regional_policy/policy/future/barca_en.htm. (accessed on 21 September 2018).
[75] Barca, F., P. McCann and A. Rodríguez-Pose (2012), “The Case for Regional Development Intervention: Place-Based versus Place-Neutral Approaches”, Journal of Regional Science, Vol. 52/1, pp. 134-152, https://doi.org/10.1111/j.1467-9787.2011.00756.x.
[6] Bargain, O., K. Orsini and A. Peichl (2013), “Comparing Labor Supply Elasticities in Europe and the US: New Results”, SSRN, https://doi.org/10.2139/ssrn.2197817.
[5] Bargain, O. and A. Peichl (2013), Steady-State Labor Supply Elasticities: An International Comparison, https://halshs.archives-ouvertes.fr/halshs-00805744.
[38] Batty, E. et al. (2015), Homeless people’s experiences of welfare conditionality and benefit sanctions, Crisis, London, http://www.crisis.org.uk.
[125] Behncke, S., M. Frölich and M. Lechner (2007), “Public Employment Services and Employers: How Important are Networks with Firms?”, Discussion Paper, No. 3005, IZA, https://doi.org/10.15980/j.tzzz.2016.01.007.
[50] Benedetti, F. (2018), Viaggio Nell’’Istruzione Degli Adulti in Italia: Alla scoperta di esigenze, problemi e soluzioni, Istituto Nazionale Documentazione Innovazione Ricerca Educativa, Rome, http://www.indire.it/wp-content/uploads/2018/05/Viaggio-istruzione-adulti-in-Italia.pdf (accessed on 27 February 2019).
[124] Bergseng, B., E. Degler and S. Luthi (2019, forthcoming), Unlocking the Potential of Migrants Through VET – A VET Review of Germany, OECD Publishing, Paris.
[32] Boeri, T. (2019), Audizione Presidenza Senato Roma, INPS, 4 febbraio 2019 Tito Boeri, https://www.inps.it/docallegatiNP/Mig/Allegati/Audizione_Presidente_Boeri_3.1.pdf.
[42] Brender, A. and M. Strawczynski (2018), “The Employment Effects of the EITC Program in Israel: Evidence on the Differential Effect of Family vs. Individual-Income Based Designs”, https://portal.oecd.org/eshare/eco/pc/Deliverables/BBS/Background%20material/14%20Dec%20-%20M.%20Strawczynski.pdf.
[122] Bronzini, R., G. Caramellino and S. Magri (2017), “Venture Capitalists at Work: What are the Effects on the Firms They Finance?”, Bank of Italy Working Papers, No. 1131, Bank of Italy, Rome, https://doi.org/10.2139/ssrn.3048277.
[27] Browne, J. and H. Immervoll (2017), “Mechanics of replacing benefit systems with a basic income: comparative results from a microsimulation approach”, The Journal of Economic Inequality, Vol. 15/4, pp. 325-344, https://doi.org/10.1007/s10888-017-9366-6.
[25] Browne, J., H. Immervoll, D. Neumann, D. Pacifico, O. Rastrigina, (2019, forthcoming), TaxBEN: The OECD tax-benefit model, OECD.
[155] Brunello, G., P. Francesco and M. Stradiotto (2015), I Fabbisogni Standard dei Comuni e delle Provincie.
[121] Bugamelli, M. et al. (2017), “Back on track? A Macro-micro Narrative of Italian Exports”, Bank Italy Occasional Papers, No. 399, Bank of Italy, https://www.bancaditalia.it/pubblicazioni/qef/2017-0399/QEF_399_17.pdf (accessed on 9 January 2019).
[24] Bulman, T., M. Pisu, D. Pacifico and O. Rastrigina (2019, forthcoming), Tax and benefit reforms to support inclusiveness, productivity and growth in Italy, OECD Economics Department Working Papers.
[72] Cannari, L., Magnani and G. Pellegrini (2009), “Quali Politiche per il Mezzogiorno?”, in L. Cannari, D. (ed.), Atti del Convegno Il Mezzogiorno e la Politica Economica dell’Italia, Bank of Italy, Roma 26 novembre 2009.
[23] Causa, O., M. Hermansen and N. Ruiz (2016), “The Distributional Impact of Structural Reforms”, OECD Economics Department Working Papers, No. 1342, OECD Publishing, Paris, https://dx.doi.org/10.1787/5jln041nkpwc-en.
[78] Cecile Gaubert (2018), “Firm Sorting and Agglomeration”, American Economic Review, Vol. 108/11, pp. 3117-3153, https://doi.org/10.1257/aer.20150361.
[118] Chiades, P. and V. Mengotto (2016), “Il calo degli investimenti nei Comuni tra Patto di stabilità interno e carenza di risorse”, Economia Pubblica 2, pp. 5-44, https://doi.org/10.3280/EP2015-002001.
[12] Colonna, F. and S. Marcassa (2015), “Taxation and female labor supply in Italy”, IZA Journal of Labor Policy, https://doi.org/10.1186/s40173-015-0030-0.
[31] Commissione 11a del Senato della Repubblica (2019), Audizione del Presidente dell’Ufficio parlamentare di bilancio DDL n. 1018 – Conversione in legge del DL 28 gennaio 2019, n. 4 recante disposizioni urgenti in materia di reddito di cittadinanza e di pensioni, Italian Senate, Rome, http://www.upbilancio.it/wp-content/uploads/2019/02/Audizione_5_2_2019_Pisauro.pdf.
[117] Court of Auditors (2018), Andamenti della Gestione Finanziaria degli Enti Locali nel Primo Anno di Applicazione della Contabilità Armonizzata, Corte dei Conti, Roma, http://www.cortedeiconti.it.
[68] Court of Auditors (2018), Relazione Annuale 2017: I Rapporti Finanziari con l’Unione Europea e l’Utilizzazione dei Fondi Comunitari, Corte dei Conti, http://www.corteconti.it/export/sites/portalecdc/_documenti/controllo/sez_contr_affari_com_internazionali/2017/delibera_19_2017_relazione.pdf (accessed on 21 September 2018).
[37] Crepaldi, C. et al. (2017), Minimum Income Policies in EU Member States, European Parliament, http://www.europarl.europa.eu/RegData/etudes/STUD/2017/595365/IPOL_STU%282017%29595365_EN.pdf.
[81] Crivello, S. and L. Staricco (2017), “Institutionalizing Metropolitan Cities in Italy. Success and limits of a centralistic, simplifying approach”, Urban Research & Practice, pp. 1-11, https://doi.org/10.1080/17535069.2017.1307001.
[1] D’Alessio, G. (2017), “Benessere, Contesto Socio-Economico e Differenze di Prezzo: il Divario tra Nord e Sud”, Banca d’Italia Occasional Papers, N. 385, https://www.bancaditalia.it/pubblicazioni/qef/2017-0385/index.html?com.dotmarketing.htmlpage.language=102 (accessed on 26 July 2018).
[152] Dasgupta, M. (2016), Moving from Informal to Formal Sector and What It Means for Policymakers, World Bank Jobs and Development Blog, http://blogs.worldbank.org/jobs/moving-informal-formal-sector-and-what-it-means-policymakers (accessed on 14 September 2018).
[44] Eissa, N. and H. Hoynes (2004), “Taxes and the labor market participation of married couples: the earned income tax credit”, Journal of Public Economics, Vol. 88/9-10, pp. 1931-1958, https://doi.org/10.1016/j.jpubeco.2003.09.005.
[11] European Commission (2018), 2018 European Semester: Assessment of progress on structural reforms, prevention and correction of macroeconomic imbalances, and results of in-depth reviews under Regulation (EU) No 1176/2011, European Commission, Brussels, https://ec.europa.eu/info/sites/info/files/2018-european-semester-country-report-communication_en.pdf.
[148] European Commission (2018), Commision Guidance on Innovation Procurement, https://ec.europa.eu/transparency/regdoc/rep/3/2018/EN/C-2018-3051-F1-EN-MAIN-PART-1.PDF.
[41] European Commission (2018), Compliance Report, ESM Stability Support Programme for Greece, Third Review, European Commission, https://ec.europa.eu/info/sites/info/files/economy-finance/compliance_report_3r_to_ewg_2018_03_02_1.pdf.
[16] European Commission (2018), The 2018 Ageing Report: Economic and budgetary projections for the 28 EU Member States (2016-2070), European Commission, https://doi.org/10.2765/615631 (accessed on 6 January 2019).
[62] Federico, G. et al. (2017), “The Origins of the Italian Regional Divide: Evidence from Real Wages, 1861-1913”, Quaderni del Dipartimento di Economia Politica e Statistica, University of Siena, https://www.deps.unisi.it/sites/st02/files/allegatiparagrafo/17-02-2017/748.pdf (accessed on 17 September 2018).
[64] Felice, E. (2010), “Regional Development: Reviewing the Italian Mosaic”, Journal of Modern Italian Studies, Vol. 15/1, pp. 64-80, https://doi.org/10.1080/13545710903465556.
[61] Felice, E. (2007), Divari Regionali e Intervento Pubblico, Il Mulino, https://books.google.fr/books/about/Divari_regionali_e_intervento_pubblico.html?id=HI7sAAAAMAAJ&redir_esc=y (accessed on 17 September 2018).
[66] Felice, E. and A. Lepore (2017), “State Intervention and Economic Growth in Southern Italy: the Rise and Fall of the ‘Cassa per il Mezzogiorno’ (1950–1986)”, Business History, Vol. 59/3, pp. 319-341, https://doi.org/10.1080/00076791.2016.1174214.
[63] Felice, E. and G. Vecchi (2015), “Italy’s Growth and Decline, 1861–2011”, Journal of Interdisciplinary History, Vol. 45/4, pp. 507-548, https://doi.org/10.1162/JINH_a_00757.
[56] Figari, F. and E. Narazani (2017), “Female Labour Supply and Childcare in Italy”, JRC Working Papers on Taxation and Structural Reforms 02/2017, https://ec.europa.eu/jrc.
[111] ForumPA (2018), Libro bianco sull’Innovazione della PA, https://librobianco-innovazione-pa2018-final.readthedocs.io/it/latest/index.html (accessed on 9 January 2019).
[154] Frazer, H. and E. Marlier (2009), Minimum Income Schemes Across EU Member States, EU Network of Independent Experts on Social Inclusion, https://www.eesc.europa.eu/resources/docs/minimum-income-schemes-across-eu-member-states_october-2009_en.pdf.
[15] Frazer, H. and E. Marlier (2009), Minimum Income Schemes Across EU Member States - Synthesis report, European Commission.
[30] Ghetti, V. (2012), Il Fattore Famiglia Lombardo: una sperimentazione opportuna?, http://www.lombardiasociale.it/2012/09/19/il-fattore-famiglia-lombardo-una-sperimentazione-opportuna/ (accessed on 28 September 2018).
[76] Glaeser, E. and J. Gottlieb (2009), “The Economics of Place-Making Policies”, Brookings Papers on Economic Activity, Vol. 39/1, pp. 155-253, https://www.brookings.edu/wp-content/uploads/2008/03/2008a_bpea_glaeser.pdf (accessed on 29 October 2018).
[43] Guillemette, Y. and D. Turner (2018), “The Long View: Scenarios for the World Economy to 2060”, OECD Economic Policy Papers, No. 22, OECD Publishing, Paris, https://dx.doi.org/10.1787/b4f4e03e-en.
[7] Immervoll, H. et al. (2011), “Optimal tax and transfer programs for couples with extensive labor supply responses”, Journal of Public Economics, Vol. 95/11-12, pp. 1485-1500, https://doi.org/10.1016/j.jpubeco.2011.06.005.
[109] IPA (2016), National Infrastructure Delivery Plan 2016–2021, Infrastructure and Projects Authority, London, http://www.gov.uk/government/publications (accessed on 9 January 2019).
[149] ISPRA (2017), Annuario dei Dati Ambientali, Instituto Superiore per la Protezione e la Ricerca Ambientale, https://annuario.isprambiente.it/ (accessed on 8 January 2019).
[59] ISTAT (2016), Asili Nido e Altri Servizi Socio-Educativi per la Prima Infanzia: Il Censimento delle Unità di Offerta e la Spesa dei Comuni, https://www.istat.it/it/files//2016/11/asili-nido.pdf (accessed on 27 February 2019).
[17] Iudicone, F. (2017), Italy: Latest working life developments-Q4 2016, Eurofoound, https://www.eurofound.europa.eu/publications/article/2017/italy-latest-working-lifedevelopments- q4-2016.
[108] Jeon, S. (2019, forthcoming), Unlocking the Potential of Migrants through VET - A Cross-country review, OECD Publishing, Paris.
[51] Jessoula, M. and E. Pavolini (2017), ESPN Thematic Report on Access to Social Protection for People Working on Non-standard Contracts and as Self-employed-Italy, https://www.researchgate.net/publication/316922667.
[9] Johansson, Å. (2016), “Public Finance, Economic Growth and Inequality: A Survey of the Evidence”, OECD Economics Department Working Papers, No. 1346, OECD Publishing, Paris, https://doi.org/10.1787/094bdaa5-en.
[151] Jütting, J., J. Parlevliet and T. Xenogiani (2009), “Informal Employment Re-loaded”, IDS Bulletin, Vol. 39/2, pp. 28-36, https://doi.org/10.1111/j.1759-5436.2008.tb00442.x.
[107] Koźluk, T. (2014), “The Indicators of the Economic Burdens of Environmental Policy Design – Results from the OECD Questionnaire”, No. 1178, OECD Publishing, Paris, http://www.oecd.org/eco/workingpapers (accessed on 8 January 2019).
[106] Kuczera, M. and S. Jeon (2019, forthcoming), OECD Review of VET in Sweden, OECD Publishing, Paris.
[67] La Spina, A. (2003), La Politica per il Mezzogiorno, Il Mulino, https://books.google.fr/books?id=2pGRAAAAIAAJ&q=La+politica+per+il+Mezzogiorno&dq=La+politica+per+il+Mezzogiorno&hl=fr&sa=X&ved=0ahUKEwj9zK7CgcXdAhXOz4UKHXVfCkAQ6AEIKDAA (accessed on 18 September 2018).
[60] León, M. and E. Pavolini (2014), “‘Social Investment’ or Back to ‘Familism’: The Impact of the Economic Crisis on Family and Care Policies in Italy and Spain”, South European Society and Politics, Vol. 19/3, pp. 353-369, https://doi.org/10.1080/13608746.2014.948603.
[105] Lerner, A. et al. (2018), “Governing the gaps in water governance and land-use planning in a megacity: The example of hydrological risk in Mexico City”, Cities, https://doi.org/10.1016/J.CITIES.2018.06.009.
[13] Luca, G., C. Rossetti and D. Vuri (2014), “In-work benefits for married couples: an ex-ante evaluation of EITC and WTC policies in Italy”, IZA Journal of Labor Policy, https://doi.org/10.1186/2193-9004-3-23.
[33] Marini, A. et al. (2019), A Quantitative Evaluation of the Greek Social Solidarity Income, World Bank, http://documents.worldbank.org/curated/en/882751548273358885/pdf/133962-WP-P160622-Evaluation-of-the-SSI-Program-Jan-2019.pdf (accessed on 11 February 2019).
[104] Martins, P. and S. Pessoa e Costa (2014), “Reemployment and Substitution Effects from Increased Activation: Evidence from Times of Crisis”, 8600, No. 8600, IZA, http://ftp.iza.org/dp8600.pdf.
[103] McColl, C. and G. Aggett (2007), “Land-use forecasting and hydrologic model integration for improved land-use decision support”, Journal of Environmental Management, Vol. 84/4, pp. 494-512, https://doi.org/10.1016/J.JENVMAN.2006.06.023.
[18] Ministry of Economy and Finance (2017), 2018 Round of EPC-WGA Projections - Italy’s Fiche on Pensions, https://ec.europa.eu/info/sites/info/files/economy-finance/final_country_fiche_it.pdf.
[101] Ministry of Finance (2018), Nota di Aggiornamento del Documento di Economia e Finanza: Rapporto sui Risultati Conseguiti in Materia di Misure di Contrasto all’Evasione Fiscale e Contributiva, Ministero Finanze, Roma, http://www.mef.gov.it/inevidenza/documenti/Rapporto_evasione_2017.pdf (accessed on 8 January 2019).
[135] Ministry of Finance (2014), Rapporto sull’Evasione Fiscale, Ministero delle Finanze, Roma, http://www.mef.gov.it/inevidenza/article_0020.html.
[89] Ministry of Labour and Social Protection (2018), “Il Nuovo ISEE – Rapporto di monitoraggio 2016”, Quaderno della Ricerca Sociale, Vol. 42.
[88] Mizel, L. (2008), Promoting Performance: Using Indicators to Enhance the Effectiveness of Sub Central Spending.
[29] Motta, M. (2011), “Le criticità dell’Isee”, Prospettive Socili e Sanitarie, Vol. 2011/16-18, pp. 9-12, https://prospettivesocialiesanitarie.it/irpet/appendice-irpet_PSS1116-18.pdf (accessed on 28 September 2018).
[48] Nedelkoska, L. and G. Quintini (2018), “Automation, skills use and training”, OECD Social, Employment and Migration Working Papers, No. 202, OECD Publishing, Paris, https://doi.org/10.1787/2e2f4eea-en.
[119] OECD (2019), Adult Learning in Italy: What Role for Training Funds ?, Getting Skills Right, OECD Publishing, Paris, HYPERLINK "https://doi.org/10.1787/9789264311978-en" https://doi.org/10.1787/9789264311978-en .
[146] OECD (2018), Developing Robust Project Pipelines for Low-Carbon Infrastructure, Green Finance and Investment, OECD Publishing, Paris, https://dx.doi.org/10.1787/9789264307827-en.
[46] OECD (2018), Good Jobs for All in a Changing World of Work: The OECD Jobs Strategy, OECD Publishing, Paris, https://dx.doi.org/10.1787/9789264308817-en.
[49] OECD (2018), Job Creation and Local Economic Development 2018: Preparing for the Future of Work, OECD Publishing, Paris, https://doi.org/10.1787/9789264305342-en.
[40] OECD (2018), OECD Economic Surveys: Greece 2018, OECD Publishing, Paris, https://doi.org/10.1787/eco_surveys-grc-2018-en.
[3] OECD (2018), Opportunities for All: A Framework for Policy Action on Inclusive Growth, OECD Publishing, Paris, https://dx.doi.org/10.1787/9789264301665-en.
[80] OECD (2018), Rethinking Urban Sprawl: Moving Towards Sustainable Cities, OECD Publishing, Paris, https://doi.org/10.1787/9789264189881-en.
[142] OECD (2017), Getting Infrastructure Right: A framework for better governance, OECD Publishing, Paris, https://doi.org/10.1787/9789264272453-en.
[47] OECD (2017), Getting Skills Right: Skills for Jobs Indicators, Getting Skills Right, OECD Publishing, Paris, https://doi.org/10.1787/9789264277878-en.
[141] OECD (2017), Government at a Glance 2017, OECD Publishing, Paris, https://doi.org/10.1787/gov_glance-2017-en.
[22] OECD (2017), OECD Economic Surveys: Italy 2017, OECD Publishing, Paris, https://doi.org/10.1787/eco_surveys-ita-2017-en.
[137] OECD (2017), OECD Employment Outlook 2017, OECD Publishing, Paris, https://doi.org/10.1787/empl_outlook-2017-en.
[58] OECD (2017), Starting Strong 2017: Key OECD Indicators on Early Childhood Education and Care, Starting Strong, OECD Publishing, Paris, https://doi.org/10.1787/9789264276116-en.
[82] OECD (2015), Governing the City, OECD Publishing, Paris, https://doi.org/10.1787/9789264226500-en.
[21] OECD (2015), OECD Economic Surveys: Italy 2015, OECD Publishing, Paris, https://doi.org/10.1787/eco_surveys-ita-2015-en.
[138] OECD (2015), OECD Employment Outlook 2015, OECD Publishing, Paris, https://doi.org/10.1787/empl_outlook-2015-en.
[54] OECD (2015), Taxation of SMEs in OECD and G20 Countries, OECD Tax Policy Studies, No. 23, OECD Publishing, Paris, https://doi.org/10.1787/9789264243507-en.
[79] OECD (2015), The Metropolitan Century: Understanding Urbanisation and its Consequences, OECD Publishing, Paris, https://doi.org/10.1787/9789264228733-en.
[99] OECD (2014), How’s Life in Your Region? : Measuring Regional and Local Well-being for Policy Making., OECD Publishing, Paris.
[20] OECD (2013), OECD Economic Surveys: Italy 2013, OECD Publishing, Paris, https://doi.org/10.1787/eco_surveys-ita-2013-en.
[98] OECD (2012), Reducing opportunities for tax non-compliance in the underground economy, OECD Publishing, Paris, http://www.oecd.org/tax/forum-on-tax-administration/publications-and-products/sme/49427993.pdf (accessed on 8 January 2019).
[4] OECD (2011), Taxation and Employment, OECD Tax Policy Studies, No. 21, OECD Publishing, Paris, https://doi.org/10.1787/9789264120808-en.
[74] OECD (2009), How Regions Grow: Trends and Analysis, OECD Publishing, Paris, https://doi.org/10.1787/9789264039469-en.
[147] OECD (2019, forthcoming), Connecting People with Jobs: Italy, OECD Publishing, Paris.
[139] OECD (2019, forthcoming), OECD Capital Markets Rewiew: Italy 2018 Mapping Report, OECD Publishing, Paris.
[143] OECD/The World Bank/UN Environment (2018), Financing Climate Futures: Rethinking Infrastructure, OECD Publishing, Paris, https://dx.doi.org/10.1787/9789264308114-en.
[55] Olivetti, C. and B. Petrongolo (2016), “The Evolution of Gender Gaps in Industrialized Countries”, SSRN, https://doi.org/10.1146/annurev-economics-080614-115329.
[45] Pacifico, D. et al. (2018), “Faces of Joblessness in Italy: A People-centred perspective on employment barriers and policies”, OECD Social, Employment and Migration Working Papers, No. 208, OECD Publishing, Paris, https://doi.org/10.1787/e5d510c2-en.
[28] Pareliussen, J., H. Hwang and H. Viitamäki (2018), “Basic income or a single tapering rule? Incentives, inclusiveness and affordability compared for the case of Finland”, OECD Economics Department Working Papers, No. 1464, OECD Publishing, Paris, https://dx.doi.org/10.1787/d8c0fbc4-en.
[96] Perotti, R. (2018), Agevolazioni Fiscali: Alcune Proposte di Riforma, Unpublished Report, http://download.repubblica.it/pdf/2018/economia/agevolazioni-fiscali.pdf (accessed on 8 January 2019).
[85] Pisu, M., P. Garda and M. Fadic (2019, forthcoming), The effect of public sector efficiency on firm-level productivity: Evidence from a spatial discontinuity design, OECD Economics Department Working Paper.
[86] Pisu, M. and F. Giovannelli (2019, forthcoming), Agglomeration economies in Italy, OECD Economics Department Working Paper.
[95] PWC (2018), The Italian NPL market: What’s Next?, Price Waterhouse Coopers, https://www.pwc.com/it/it/publications/npl-market.html.
[94] Roy, R. and N. Braathen (2017), “The Rising Cost of Ambient Air Pollution thus far in the 21st Century: Results from the BRIICS and the OECD Countries”, OECD Environment Working Papers, No. 124, OECD Publishing, Paris, https://dx.doi.org/10.1787/d1b2b844-en.
[19] Sacchi, S. (2018), “The Italian Welfare State in the Crisis: Learning to Adjust?”, South European Society and Politics, https://doi.org/10.1080/13608746.2018.1433478.
[83] SOSE (2018), The Reform of Corrective and Compensatory Mechanisms in Italy and the Analysis of the Fiscal Gap as a Tool to Orientate Local Fiscal Policy, https://www.sose.it/sites/default/files/inline-files/Lithuania%20SOSE_presentation_for_SRSS_Lithuania_meeting_29jan%20%28003%29%20%5BSola%20lettura%5D.pdf.
[93] Stutzer, A. and B. Frey (2008), “Stress that Doesn’t Pay: The Commuting Paradox”, Scandinavian Journal of Economics, Vol. 110/2, pp. 339-366, https://doi.org/10.1111/j.1467-9442.2008.00542.x.
[26] Sutherland, H. and F. Figari (2013), EUROMOD: the European Union tax-benefit microsimulation model, http://www.flemosi.be.
[57] Tavora, I. (2012), “The southern European social model: familialism and the high rates of female employment in Portugal”, Journal of European Social Policy, Vol. 22/1, pp. 63-76, https://doi.org/10.1177/0958928711425269.
[8] Thomas, A. and P. O’Reilly (2016), “The Impact of Tax and Benefit Systems on the Workforce Participation Incentives of Women”, OECD Taxation Working Papers, No. 29, OECD Publishing, Paris, https://doi.org/10.1787/d950acfc-en.
[2] Veneri, P. and F. Murtin (2016), “Where is inclusive growth happening? Mapping multi-dimensional living standards in OECD regions”, OECD Statistics Working Papers, No. 2016/1, OECD Publishing, Paris, https://doi.org/10.1787/5jm3nptzwsxq-en.
[71] Viesti, G. (2011), “Italian Regional Policies in the Last Twenty Years and Their Results”, Journal of Industrial and Business Economics, Vol. 38/4, pp. 95-137, http://profgviesti.it/wp-content/uploads/2013/04/20111Viesti.pdf (accessed on 21 September 2018).
[52] Williams, C. and F. Lapeyre (2017), “Dependent Self-Employment: Trends, Challenges and Policy Responses in the EU”, SSRN, https://doi.org/10.2139/ssrn.3082819.
[36] Work and Pensions Committee (2018), Benefit Sanctions, House of Commons, London, https://publications.parliament.uk/pa/cm201719/cmselect/cmworpen/955/955.pdf (accessed on 22 January 2019).
[35] Wright, S. et al. (2016), First Wave Findings: Universal Credit, Economic and Social Research Council, York, http://www.welfareconditionality.ac.uk (accessed on 22 January 2019).
[65] Zamagni, V. (2010), “Comments on the paper by Emanuele Felice”, Journal of Modern Italian Studies, Vol. 15/1, pp. 81-83, https://doi.org/10.1080/13545710903465564.