Chapter 3. The methodology behind measuring distance to the SDG targets
The complexity of the 2030 Agenda, with 17 Goals, 169 targets and 244 indicators on the UN Global Indicator List, makes assessing performance on SDGs a difficult undertaking. In order to measure the distance of OECD countries to SDG targets, the study uses a unique methodology allowing comparisons across goals and targets. This chapter describes the methodology used, including the selection of indicators and the setting of numerical values for the targets. In addition, it details the methodology used for assessing trends over time and performance on the transboundary targets of the 2030 Agenda.
The statistical data for Israel are supplied by and under the responsibility of the relevant Israeli authorities. The use of such data by the OECD is without prejudice to the status of the Golan Heights, East Jerusalem and Israeli settlements in the West Bank under the terms of international law.
3.1. Methodology for measuring distance to the SDG targets
The goals, targets and indicators of the 2030 Agenda cover a broad range of issues, with different metrics, target values and levels of ambition. In order to assess and compare progress right across the Agenda, this Study focuses on measuring the distance that OECD countries need to travel in order to meet the SDG targets by 2030. This methodology is based on three steps, with decisions made at each of these steps affecting analysis and results. In the first step, indicators are selected, based on the UN Global Indicator List (United Nations, 2017[1]). Second, in order to measure distances, a target end-value is set for each indicator. Finally, a normalisation method is used based on a modified z-score procedure; this procedure measures distance from a fixed end-point in a standardised way for each indicator, based on the idea of peer group comparisons. This section presents the methodological rationale for the choices made at each step, alongside a series of robustness checks. Additionally, this section details the approach used to assess trends over time and to assess performance on transboundary targets.
The Study has been kept as simple as possible in order to meet its aims, which are described in Chapter 1. All OECD countries are included in the Study and have been treated equally on all indicators. This choice may seem uncontroversial but has, in some ways, far-reaching implications. For example, some OECD members have not subscribed to UN targets on Official Development Assistance, which were designed to apply to economically advanced countries; yet, where data are available, this Study assesses these countries on the same scale as others. The need for simplifications reinforces the point made earlier that the results of this Study should not be taken as providing a definitive assessment, but rather as a means of advancing thought and action on SDGs performance and measurement.
3.2. Identifying suitable data sources to measure performance on SDG targets
The starting point for this Study’s dataset was the UN Global Indicator List, a choice made after consulting with OECD Member Countries, including delegates to the OECD Committee on Statistics and Statistical Policy. By adhering as closely as possible to the UN Global Indicator List, we limit the extent to which additional judgement and interpretation of the SDG targets is required. Nevertheless, the UN Global Indicator List and UN Global Database (UN Statistics Division, 2018[2]) do not provide an “off the shelf” solution for SDGs monitoring in OECD countries, and considerable data processing is still needed. In fact, the UN Global Database is still work in progress, and even metadata do not always match the data series presented. The degree of harmonisation and quality of data used in this Study are also enhanced by using OECD data sources, where these align closely with the indicators in the UN Global Indicator List. The addition of a limited number of well-established OECD indicators as proxies enables us to expand coverage of the SDG targets where no UN data currently exist.
In order to assess OECD countries’ distances to the SDG targets, and in order to remain aligned with the UN Global Indicator List and its architecture, this Study uses one data series1 for each indicator in the UN Global Indicator List. This is in the case, for example, for indicator “3.b.1 Proportion of the target population covered by all vaccines included in their national programme”, whose purpose is to monitor coverage of the World Health Organisation (WHO) recommended vaccines related to DTP (diphtheria-tetanus-pertussis), Measles, Pneumococcal conjugate and HPV (Human Papillomavirus). The UN Global Database includes three data series for this indicator, referring to the proportion of the target population covered by 3 doses of DTP (DTP3), measles-containing-vaccine second-dose (MCV2), and pneumococcal conjugate third dose (PCV3). An ideal indicator would be the share of the population which has received all three vaccinations; as this data is not available in the UN Global Database, we use the lowest coverage rate of the three vaccinations for each country, which gives the highest possible share of people receiving all three vaccinations.
Using data from the UN Global Database may seem straightforward, but requires many decisions along the way. The selection principle used here is the country-coverage criterion, i.e. that data should be available for at least 20 OECD countries, with at least one non-EU member country. Applying this criterion, we identified 217 data series available for 104 indicators from the UN Global Indicator List; for 53 of these indicators, the UN Global Database includes between 2 and 17 different data series. For these indicators, in order to apply our principle of having only one data series for each indicator in the UN Global Indicator List, we selected the most relevant data series for the purpose of the Study. This was done by checking the available data, by consulting with OECD experts or by building a composite indicator based on several series. As an example, for indicator “3.9.1 Mortality rate attributed to household and ambient air pollution”, the UN Global Database includes 6 data series: crude and age standardised mortality rate attributed to ambient, household, and ambient and household air pollution. For the purpose of the Study, OECD experts advised to use the “Age-standardized mortality rate attributed to ambient air pollution”, on the grounds that ambient air pollution is more relevant for developed countries, and that the age standardised rate is a better measure for monitoring progress on target 3.9: “By 2030, substantially reduce the number of deaths and illnesses from hazardous chemicals and air, water and soil pollution and contamination”.
Availability of data used in this Study differs across countries. Of the 132 indicators selected for the Study, 59 indicators are available for all 36 OECD countries, 47 indicators are available for between 30 to 35 countries, and 26 indicators are available for fewer than 30 countries.
All data used for this Study are sourced from the UN Global Database and OECD databases. For OECD data, the selection of data series rested on an extensive consultation with all OECD directorates and programmes in order to identify the most relevant and up-to-date data. Sources were selected based on the following criteria:
-
1. The Study uses data from OECD databases that are comparable with the UN Global Indicator List definitions when they provide better coverage and precision than the data in the UN Global Database. For example, under target 8.2, the indicator for productivity growth is “8.2.1 Annual growth rate of real GDP per employed person”. This indicator is available in the UN Global Database, but OECD data on “annual growth rate of real GDP per hour worked” meet more demanding international statistical standards, using a more precise definition of productivity that is harmonised across OECD countries.2 This category encompasses 57 of the 132 indicators used in this Study (around 43% of the total).
-
2. In cases where no comparable OECD data are available, the Study uses the data from the UN Global Database. As an example, the indicator on the prevalence of moderate or severe food insecurity in the adult population, which is used for monitoring target 2.1 on ending hunger and ensuring access to healthy and safe nutrition, is drawn from the UN Global Database and sourced from the Food and Agriculture Organization (FAO), the custodial agency for this indicator. This category includes 43 indicators (i.e. around 33%) of those featured in the Study.
-
3. When no data are available in the UN Global Database, the Study uses OECD data as proxies. For example, indicator “1.2.1 Proportion of population living below the national poverty line, by sex and age” is used to monitor target 1.2 “By 2030, reduce at least by half the proportion of men, women and children of all ages living in poverty in all its dimensions according to national definitions”. As the UN Global Database does not have data satisfying the minimum country requirement applied here (at least 20 OECD countries, not all EU), this Study relies on the OECD series for “relative income poverty rate”. This category includes 32 indicators (around 24% of those used in total).
Figure 3.1 shows the distribution of indicators according to their source, presented by the UN tier classification (IAEG-SDGs, 2019[3]).3 In total, across all tiers, 43 of the indicators used in this Study are drawn from the UN Global Database and 89 from OECD databases. Of the 244 indicators (including duplicate indicators) in the UN Global Indicator List, data meeting the country-coverage criterion mentioned above are missing for 112 indicators.

Source: See detailed metadata at www.oecd.org/sdd/OECD-Measuring-Distance-to-SDGs-Targets-Metadata.pdf and (IAEG-SDGs, 2019[3]), Tier Classification for Global SDG Indicators, https://unstats.un.org/sdgs/iaeg-sdgs/tier-classification/.
3.2.1. How closely correlated are the indicators used in this Study sourced from OECD databases with those in the UN Global Database?
The indicator selection methodology described above gives preference to established OECD datasets where these are believed to be of higher quality and consistency than those in the UN Global Database. To provide some sense of the impact this choice is likely to have on the overall Study findings, Figure 3.2 presents the correlation between indicators computed on the two sources, for all OECD countries with data available in both sources. More than four-fifths of the indicators from OECD databases have a strong or very strong correlation with those from the UN Global Database. The lower correlation observed for some indicators is explained by differences between the data sources, such as different definitions or units of measurement. For example, the UN Global List Indicator 1.a.2 is the “Proportion of total government spending on essential services (education, health and social protection)”. In OECD data sources, information is available based on this exact definition, whereas the UN Global Database provides information only on the proportion of total government spending on education. While the correlation between the two is low (-0.04), OECD data are used as the preferred source since they adhere more closely to the definition specified in the UN Global Indicator List.

Note: Distribution of the highest correlation (for either Spearman or Pearson coefficients) observed between indicators computed on the bases of OECD and the UN Global databases, for all available data across countries and over time. Correlations (positive and negative) are grouped as “very weak” (0-19), “weak” (20-39), “moderate” (40-59), “strong” (60-79) and “very strong” (80-100) based on Evans’ guidelines (Evans, 1996[4]).
Source: OECD calculations.
3.2.2. Missing data: How do missing indicators and incomplete coverage affect results?
The indicators used for this Study cover 62% of all the SDG targets across OECD countries, i.e. 105 of the 169 targets are covered in this Study by at least one indicator. However, coverage is uneven across goals, with those pertaining to Health (3), Infrastructure (9) and Education (4) covered best, and those for Oceans (14) and Sustainable Production (12) worst, with only 30% of targets covered (see Figure 1.2 in Chapter 1). This incomplete indicator coverage may lead to misleading conclusions when analysing the results by countries, with possible effects on both the aggregated results and the normalised value used (based on the standard deviation).
The first effect is due to the aggregation of distances at the goal and 5P level; the fewer the available data for targets pertaining to a specific goal, the greater the uncertainty about the true distances from targets for that goal (see Figure 1.4 in Chapter 1).
The second effect of missing data is the potential for bias when measuring of the standard deviation, which is used for normalisation of distance to target (see next section). For example, if countries that perform similarly on one indicator are overrepresented in the sample, while countries that perform differently are underrepresented, the standard deviation will understate the true dispersion of performance across OECD countries; as a result, both the OECD average value and the distance to target for individual countries will be affected.
Figure 3.3 shows the share of targets assessed in this Study for all OECD countries. At the country level, coverage ranges from 47% of targets covered by at least one indicator in Chile, to 62% coverage in Italy, with an average of 58%. Although this is an improvement in coverage relative to previous editions and to other measurement initiatives, significant data gaps for all OECD countries clearly remain.
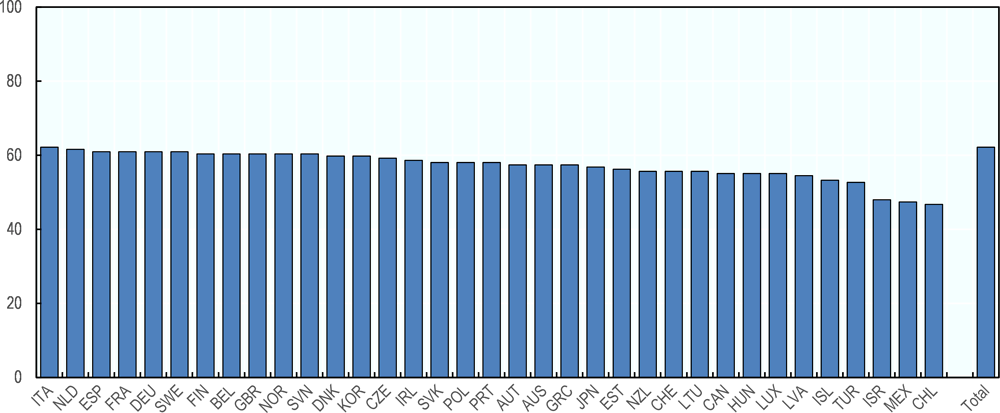
Source: OECD calculations.
3.3. Setting target levels
The Study evaluates countries’ performance by examining the distance that each OECD country would have to travel in order to achieve each SDG target by 2030. This implies setting a numerical target (end value) for every indicator. Wherever possible, these targets are derived directly from the wording of the SDGs themselves, as, for example, in the case of target 1.1: “By 2030, eradicate extreme poverty for all people everywhere, currently measured as people living on less than $1.25 a day”. This was possible for 47 of the 132 indicators used in the Study. In five other cases, the targets in the wording of the SDGs relative to the starting position, such as for target 1.2: “By 2030, reduce at least by half the proportion of men, women and children of all ages living in poverty in all its dimensions according to national definitions”. However, for the remaining 80 indicators, targets are not explicitly set by the 2030 Agenda, and must be derived through other methods. To do so, this Study adopts a three-step approach. As a first preference, target end values are based on international agreements and expert opinion, whether absolute (19) or relative (2) – the sources for these are detailed in the Study metadata.4 Where this is not possible, but there is still a clear normative direction to the indicator (i.e. higher/lower values of the indicators unambiguously imply better performance), the top-performing OECD countries are used to set a benchmark value (36). Finally, where there is neither international consensus on a target end value nor a clear normative direction to the indicator, then no target end value is set (23), and the indicator is excluded from the normalisation procedure and from the aggregated normalised results presented in Section 1.3.2 of Chapter 1. Instead, average values are detailed in Box 1.3 and Section 1.3.2 under “challenges in measuring distance”. These different types of target levels are detailed in Table 3.1.
In order to examine the implicit level of ambition implied by these different types of targets, Figure 3.4 considers how OECD countries’ distances from achieving the target, for each of these three groups of targets, how distributed. The figure shows how targets explicitly set in the Agenda (types A1 and A2) differ in their ambition from those based on current best performers (target type C) and on other international agreements or conventions (target types B1 and B2). For type A targets, the OECD median distance from the target end-values is 0.6 standard deviations (i.e. countries are relatively close, on average, to meeting these targets). For both types B and C, the median distance is greater, respectively at 0.9 and 1.1 standard deviations, and with a different range of scores (with B-type targets having the largest range). This implies that the B- and C-type targets are generally more ambitious than the targets explicitly set in the 2030 Agenda, and that the performances of OECD countries are more diverse in the case of B-type targets compared to A-type targets.
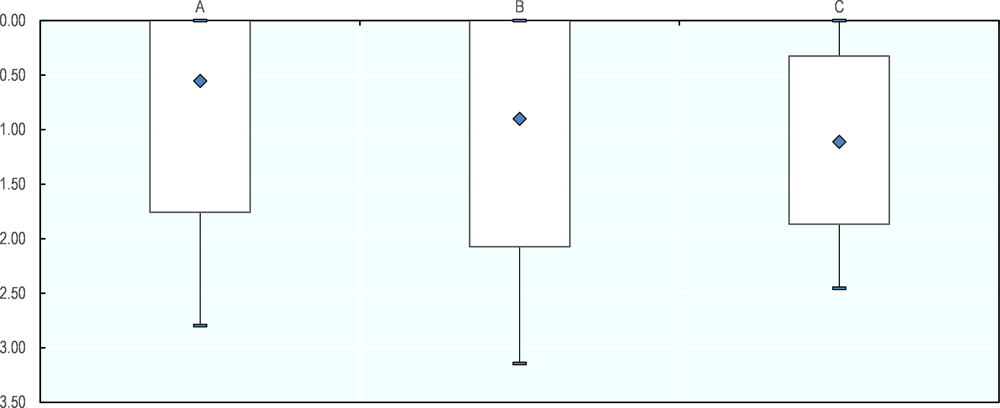
Note: The chart shows the distribution of distances across OECD countries. Black dots show the median distance; box boundaries show the first and third quartiles of the distribution of countries’ performances, and the whiskers show the 10th and 90th percentiles.
Source: OECD calculations.
3.4. The normalisation procedure
Providing a high-level picture of OECD countries’ distances to targets across a vast array of indicators requires a common scale to allow comparison, as the indicators have different measurement units. The overarching objective of normalisation is to allow comparisons across the transformed indicators, such that an extra unit of attainment is of equal value across all indicators and countries, despite differences in current levels of achievement (Jacobs, Smith and Goddard, 2004[5]). In this Study, indicators have been normalised in order to assess the distance to be travelled to achieve the 2030 targets using a modified z-score method (described below). The OECD average distance is the population-weighted average of distances across all countries, using population in 2016 as weights.
Distance to target has been measured as the “standardised difference” between a country’s current position and the target end-value. For each indicator, the standardised measurement unit is the standard deviation observed among OECD countries in the latest available year. The underlying assumption, implicit in using the standardisation, is that the group of OECD countries share enough commonalities to make a comparative normalisation method meaningful. When performances are widely spread across countries, the standard deviation is high; suggesting that there is greater scope to improve performance; and conversely it will the standard deviation will be small if all countries have very similar performances. The “standardised distance” from target therefore is inversely related to the distribution of observations – the wider the spread of scores, the larger the standard deviation and the shorter the distance to target, measured in standard deviation units.
When normalising indicators, special consideration should be given to the effect of extreme values, as they may unduly influence the final estimates, i.e. very skewed data might impact the measured distances of all countries. This raises the question of whether the “standardised distance” is a meaningful measure for assessing the distance from achieving the target when data are not normally distributed, i.e. heavily skewed. Several considerations support the choice of the normalisation method used here. First, as discussed in The Handbook on Constructing Composite Indicators (OECD/EU/JRC, 2008[6]), the effect of skewed data is less pronounced using modified z-scores than with other normalisation procedures such as the ratio-scale.5 Second, most countries’ distances from target are spread across a rather small range (see section 3.4.1), implying that outliers do not have a significant impact. In fact, Figure 3.5 shows that for most indicators used in this Study, skewness is close to zero.
Note: Skewness is a measure of asymmetry of a distribution. For a unimodal distribution, negative skew indicates that the tail is on the left side of the distribution, and positive skew indicates that the tail is on the right.
Source: OECD calculations.
In order to understand empirically the impact of an “outlier”, we assess the sensitivity of the normalisation method used here on one of the most skewed data series included in this Study. Indicator 3.3.5 “Number of people requiring interventions against neglected tropical diseases” has a relatively skewed distribution, as most OECD countries do not suffer from neglected tropical diseases. For instance, 90% of OECD countries have less than 2.6 people per 100 000 requiring interventions against neglected tropical diseases while there are 1 300 cases per 100 000 inhabitants in Mexico. Normalised distances calculated for this indicator, shown in Figure 3.6, reflect this skewness, but still remain within a manageable range (between 0 and 6 standard deviations, see next Section on the distribution of scores). When the outlier country (Mexico) is removed from the dataset, very similar countries’ score are observed for almost all OECD countries. The distance would increase by more than 0.1 standard deviations for only three countries (Turkey, Israel and Australia).

Note: Z-scores for individual countries and the OECD average; these z scores range from 5.8 (Mexico) to 0 (most countries have achieved the target).
Source: OECD calculations.
3.4.1. Distribution of OECD countries’ distances from targets
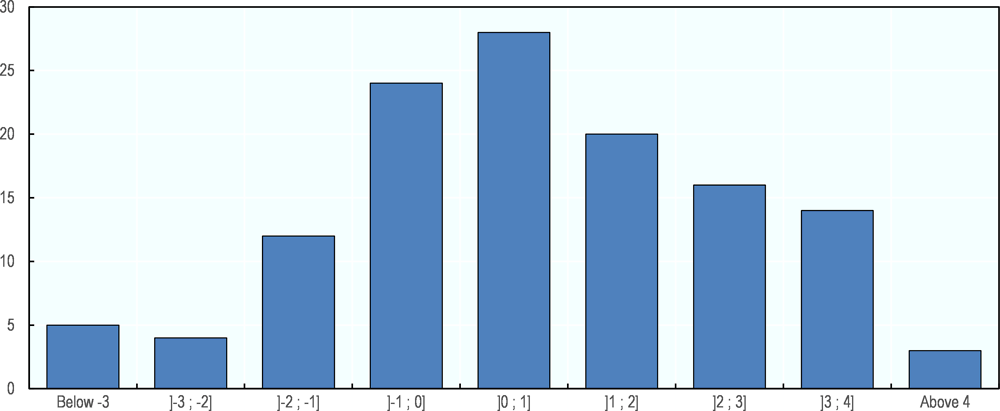
While the modified z-score methodology used for normalising indicators is robust compared to alternatives, it is also useful to look more closely at the distribution of empirical results. As there are no obvious boundaries on possible results from a z-score normalisation, the spread of normalised scores provides an indication of the effects of the methodology of the assessment of countries’ position. Figure 3.7 shows that all measured distances from targets fall within a relatively limited range. Indeed, across all OECD countries, almost 95% of them are less than three standardised units away from the 2030 targets.

Note: The chart shows the distribution of OECD countries’ current distance to target in standardized units for each distance; the y-axis shows the number of indicators and the x-axis shows distance to targets. For instance, 50% of the distances are one standardized unit away from the desirable level of achievement or less. The number of observations is 3 053, i.e. 36 countries times 110 indicators.
Source: OECD calculations.
3.5. Measuring trends
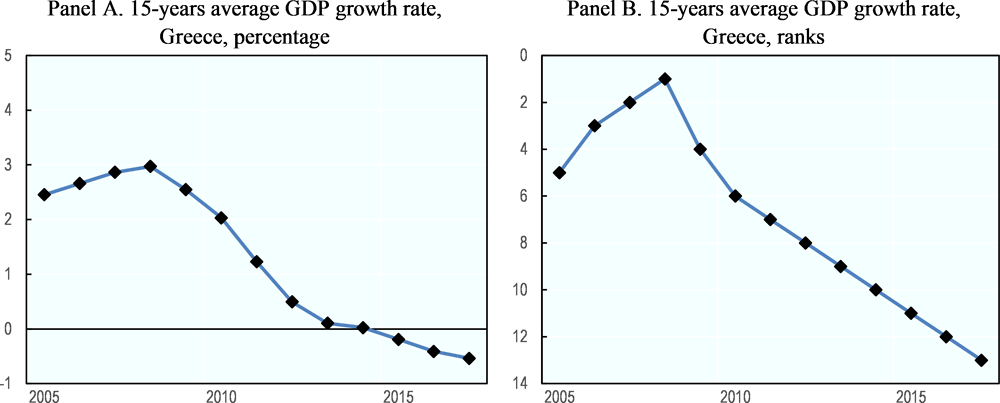
As discussed in Section 1.3.3 in Chapter 1, trends are summarised by computing the Spearman (rank) correlation coefficient between the observed values of each indicator (in their original units of measurement) and time (expressed in years). Thus, a significant positive correlation (approaching 1.0) indicates a positive overall trend of the indicator over time, while a significant negative correlation (approaching -1.0) indicates a negative overall trend. Non-significant correlations (around 0) indicate that no consistent trend could be determined over the time period assessed (5 to 10 years). More concretely, the trend is described as a “movement away from the SDG target” if the correlation coefficient (corrected for the normative direction of each indicator) is below -0.20 and significant at the 10% level. The trend is described as a “progress toward SDG targets” if the correlation coefficient is above 0.20 and significant at 10% level. When the coefficient is between -0.20 and 0.20, or when it is not significant, we consider this as “no consistent trend could be identified”.
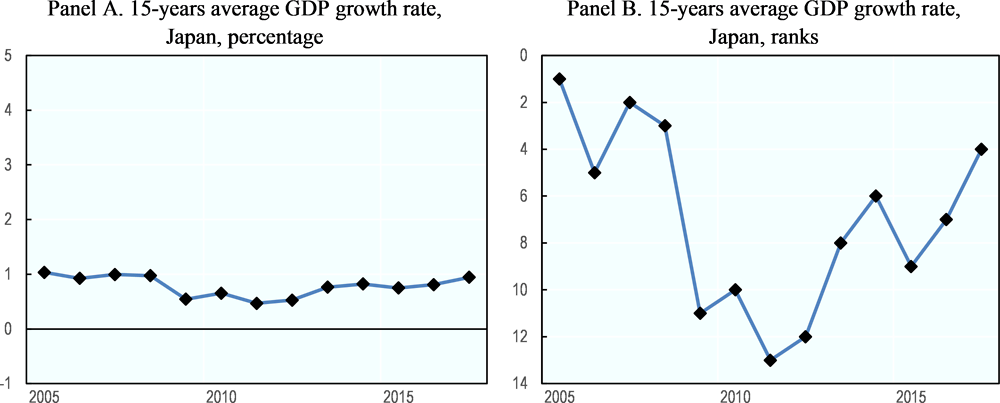
Figures 3.8, 3.9 and 3.10 below illustrate these three different cases, showing different OECD countries’ performances for indicator 8.2.1, the 15-year average GDP growth rate measuring performance for target 8.2. For Turkey, the Spearman correlation coefficient between indicator 8.2.1 and time is 0.73 and significant at 10% (see Figure 3.8), and so it is considered as moving towards the target, i.e. a positive trend. The correlation coefficient is -0.97 in Greece and significant at 10% (Figure 3.9), so it is classified as moving away from the SDG target. Finally, as the correlation coefficient for Japan is -0.15 and not significant at 10% (Figure 3.10), the country is considered as belonging to the group “no consistent trend could be identified”.

Source: (OECD, 2017[7]), OECD National Account Statistics (database), https://doi.org/10.1787/na-data-en.
Source: (OECD, 2017[7]), OECD National Account Statistics (database), https://doi.org/10.1787/na-data-en.
Source: (OECD, 2017[7]), OECD National Account Statistics (database), https://doi.org/10.1787/na-data-en.
Wherever possible, data series are tracked from 2005 to the latest available year. However, in practice, some of the available time series are shorter (see Annex 1.A for details for each indicator). Thus, the minimum requirements for inclusion in this analysis are at least five years’ time-span, with at least three observations over that five-year period.
3.6. Measuring OECD countries’ performances on SDG transboundary targets
Measuring OECD countries’ transboundary effects is a complex undertaking.6 As a first step in this undertaking, this Study relies on a simplified approach, which rest on identifying which SDG targets are considered as having inherently transboundary components, and how these are covered in the global SDG measurement framework. In addition to relying on the general methodology used in this Study to assess the distance from achieving SDG targets, this approach allows identifying data gaps in the UN Global Indicators standing in the way of measuring the integrated and interdepended nature of the 2030 Agenda.
Transboundary effects could be considered in all situations when any country is affecting any other country, in any way, and at any time. This approach would however presents an unmanageable challenge for measurement, one that cannot be met with the information currently available. This Study relies on a simpler approach. In order to identify which targets of the 2030 Agenda have transboundary elements inherent within them, each target is subjected to a simple test: If (OECD) country A acts to achieve SDG target X, are these actions likely to have direct effects on other countries, or on a global public good? This simplification implies that:
-
This Study only considers transboundary effects that are embedded within the actions called for by the 2030 Agenda. This means that, to identify transboundary effects, the wording of each of the 169 SDG targets is considered to assess whether countries’ individual efforts to meet those targets could have knock-on effects for other countries’ abilities to achieve the SDGs. For example, many of the SDG targets directly call for “international co-operation”, or various forms of support to be provided to developing countries. From the perspective of an OECD country, targets that aim to improve outcomes in developing nations are, by definition, transboundary. Thus, the approach used here excludes actions that are not directly envisaged by the wording of the SDG targets themselves (e.g. domestic policies that might have an impact on other countries, such as certain types of subsidies, but are not explicitly mentioned in the SDGs, are not considered as ‘transboundary’).
-
This approach also excludes targets with a universal phrasing, such as target 1.1, which calls for eliminating extreme poverty for all people, everywhere. For the purposes of this Study, these targets are considered as domestic commitments, i.e. a target that is up to each country to achieve for their own citizens.7 In the case of poverty reduction, the global commitment of the Agenda is embodied in “means of implementation” targets, such as target 1.a, which calls for mobilisation of ODA to achieve the goal of eliminating extreme poverty at a global level. Target 1.a is hence considered as transboundary in this Study. Other examples of transboundary targets are that of improving resource efficiency in production and consumption (target 8.4), as countries’ actions in this field will directly impact environmental outcomes elsewhere; or reducing the incidence of communicable disease (target 3.3), as actions in this field by a country will directly reduce global communicable disease risk by reducing the probability of exposure.
-
Finally, the approach used here considers only the effects that OECD countries might have on other countries (whether OECD members or not) or on global public goods, while excluding the transboundary effects associated to actions of non-OECD countries. This choice is driven by the scope of this Study, which is limited to OECD countries.
Applying these decision rules, 97 targets out of all the 169 SDG targets are identified in this Study as having a transboundary component. For each target identified as transboundary, this Study then considers whether the indicators on the UN Global Indicator List capture the transboundary nature of the target. The “distance to target” for these indicators are presented in Section 1.3.4 of Chapter 1, as well as a mapping of data gaps for the transboundary targets identified.
References
[4] Evans, J. (1996), Straightforward Statistics for the Behavioral Sciences, Brooks/Cole Publishing, Pacific Grove.
[3] IAEG-SDGs (2019), Tier Classification for Global SDG Indicators, https://unstats.un.org/sdgs/files/Tier%20Classification%20of%20SDG%20Indicators_13%20February%202019_web.pdf.
[5] Jacobs, R., P. Smith and M. Goddard (2004), “Measuring performance: An examination of composite performance indicators”, http://york.ac.uk/che/pdf/tp29.pdf (accessed on 20 September 2017).
[7] OECD (2017), OECD National Account Statistics Database, https://doi.org/10.1787/na-data-en.
[6] OECD/EU/JRC (2008), Handbook on Constructing Composite Indicators: Methodology and User Guide, OECD Publishing, Paris, https://dx.doi.org/10.1787/9789264043466-en.
[2] UN Statistics Division (2018), United Nations Global SDG Database, United Nations Statistics Division, https://unstats.un.org/sdgs/indicators/database/ (accessed on 12 November 2018).
[1] United Nations (2017), Global indicator framework for the Sustainable Development Goals and targets of the 2030 Agenda for Sustainable Development, United Nations, https://unstats.un.org/sdgs/indicators/Global%20Indicator%20Framework%20after%20refinement_Eng.pdf.
Notes
← 1. Using one data series for each indicator means there is only one value for each country for which data are available.
← 2. The indicators included in the UN Global Database are sometime further from the indicators agreed by the IAEG that can be found in OECD databases. For example, UN Global List Indicator 1.a.2 is defined as the “Proportion of total government spending on essential services (education, health and social protection)” by the IAEG-SDGs; in OECD data, information is available following this exact definition, whereas the UN Global Database only includes data on the proportion of total government spending on education.
← 3. As mentioned in Section 1.2 in Chapter 1, the Global Indicator List distinguishes between three categories: briefly, tier I includes indicators which are methodologically established and data are available for most countries, tier II those where methodology is clear but data are not regularly produced by countries, and tier III those where there is currently no established methodology or standards.
← 4. See www.oecd.org/sdd/OECD-Measuring-Distance-to-SDGs-Targets-Metadata.pdf for detailed metadata.
← 5. The ratio-scale (Min-Max) is a normalisation method which assigns indicators a range of 0 to 1 by subtracting the minimum value and dividing by the range of the indicator values (OECD/EU/JRC, 2008[6]).
← 6. A forthcoming working paper will discuss in detail the challenges of capturing the transboundary effects inherent within the 2030 Agenda, and suggest a methodology to lay the foundations for this work (Shinwell, forthcoming).
← 7. Similarly, actions by a country to adequately prepare children for primary education (target 4.2) or to reduce premature mortality from non-communicable diseases (target 3.4) are considered as “domestic” (i.e. as having no transboundary element) even if these actions might lead to good practices or new health goods that could bring benefit other countries at some later stage.