
Life satisfaction
Life satisfaction represents people’s subjective evaluation of their satisfaction with life as a whole. Life satisfaction is associated with good family relationships, health, living conditions and wealth as well as confidence in governance in the broader society.
People in OECD countries are more satisfied with their life than those in the Asia/Pacific region (Figure 6.1). On a scale of 1 to 10, life satisfaction scores are about 1 point higher on average across the OECD than across the Asia/Pacific region. Australians and New Zealanders report the highest life satisfaction of the countries observed, averaging a score of seven out of ten; while residents in Bangladesh, India and Sri Lanka report the lowest life-satisfaction scores in 2017/19.
On average across the Asia/Pacific region and the OECD, life satisfaction has not changed markedly since the last decade (Figure 6.1). Trends also differ across countries; for example, on average life satisfaction was low in Georgia and India in 2007/09, but while it improved in Georgia, it declined further in India in 2017/19. Life satisfaction increased in about two-thirds of the countries since 2007/09, and the increase appeared most pronounced in Georgia, Mongolia, and the Philippines.
The COVID-19 pandemic changed life around the world. On average, more than seven in ten survey-respondents declare that their life has been affected by the COVID-19 pandemic in the Asia Pacific region, compared to more than eight in ten survey respondents across the OECD area. In 2020, over 9 out of 10 survey-respondents were affected by the COVID-19 pandemic (either “a lot” or “to some extent”) in Korea, Mongolia and the Philippines. Whereas less than one in two respondents were affected Lao PDR, Nepal and Tajikistan (Figure 6.2).
People in wealthy countries tend to be more satisfied with life than those in less wealthy countries (Figure 6.3). People in Uzbekistan appear to have a higher life satisfaction than what might have been expected based on their average income, but results for Australia, New Zealand on the one hand, and Bangladesh and Cambodia on the other, illustrate the relationship between average life satisfaction and prosperity.
Data on life satisfaction were taken from the Gallup World Poll. The Gallup World Poll is conducted in more than 150 countries around the world based on a common questionnaire, translated into the predominant languages of each country. With few exceptions, all samples are probability based and nationally representative of the resident population aged 15 years and over in the entire country, including rural areas. While this ensures a high degree of comparability across countries, results may be affected by sampling and non-sampling error, and variation in response rates. Hence, results should be interpreted with care. These probability surveys are valid within a statistical margin of error, also called a 95% confidence interval. This means that if the survey were conducted 100 times using the exact same procedures, the margin of error would include the “true value” in 95 out of 100 surveys. Sample sizes vary across countries from 1 000 to 4 000, and as the surveys use a clustered sample design the margin of error varies by question. The margin of error declines with increasing sample size: with a sample size of 1 000, the margin of error at a 95% confidence interval is 0.98/ or 3%, with a sample size of 4 000, this is 1.5%. To minimise the effect of annual fluctuations in responses related to small sample sizes, results are averaged over a three-year period, or two-year period in case of missing data. If only one observation in a three-year period is available, this finding is not reported.
The Gallup World Poll asked respondents to: “Imagine an 11-rung ladder where the bottom (0) represents the worst possible life for you and the top (10) represents the best possible life for you. On which step of the ladder do you feel you personally stand at the present time?” The main indicator used in this section is the average country score. Data are also shown by gender and broad age groups.
During the first full year of the COVID-19 pandemic, Gallup asked specific questions on how the pandemic affected respondents’ lives and livelihoods. One of the question was: In general, to what extent has your own life been affected by the coronavirus situation? A lot, to Some extent or Not at all?

Source: Gallup (2021), Gallup World Poll, http://www.gallup.com.

Note: Differences across countries in the dates of interviews in 2020 as well change in survey methodology (based on telephone interviewing and new weighting adjustment) may affect comparability.
Source: OECD Secretariat calculations based from Gallup (2021), Gallup World Poll, http://www.gallup.com.
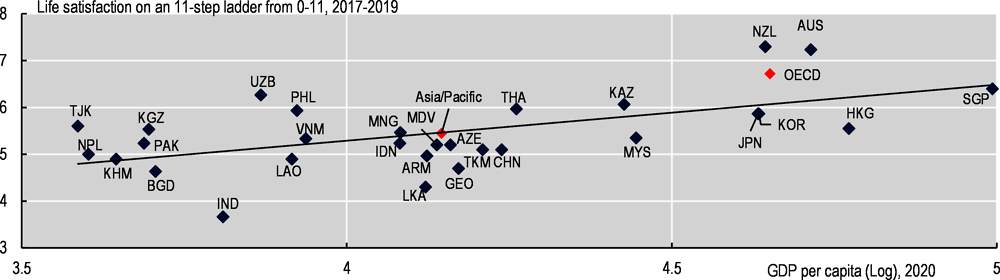
Note: GDP per capita is gross domestic product divided by midyear population. GDP is the sum of gross value added by all resident producers in the economy plus any product taxes and minus any subsidies not included in the value of the products. It is calculated without making deductions for depreciation of assets or for depletion and degradation of natural resources. Data are in current USD.
Source: Gallup (2021), Gallup World Poll, http://www.gallup.com; OECD (2021), OECD National Accounts, https://stats.oecd.org/Index.aspx?DataSetCode=NAAG; World Bank (2021), World Development Indicators, https://databank.worldbank.org/source/world-development-indicators.