Voting
Interest in politics is an important factor for social cohesion. It is a key challenge for politicians to ensure that citizens feel concerned by politics and participate as actors in the political life of the society.
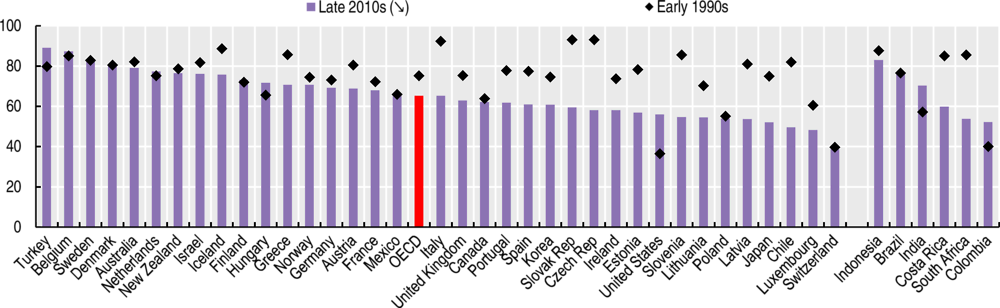
Voter turnout rates vary enormously across OECD countries. A high voter turnout is a sign that a country’s political system enjoys a strong degree of participation. Turnout rates in parliamentary elections are above 80% in Belgium, Denmark, Turkey and Sweden, but below 50% in Chile, Luxembourg and Switzerland (Figure 8.10). Low turnout not only reflects limited participation by registered voters, but also limited registration by potential voters. In most OECD countries, there has been a decline in electoral participation over the last three decades. Between the early 1990s and the late 2010s, participation in parliamentary elections across the OECD decreased from 75% to 65% on average.
One in four young people in the OECD report no interest at all in politics, compared with one in five for all age groups (Figure 8.11). Disinterest in politics among 15-to-29-year olds is highest in the Czech Republic, Hungary and Lithuania, with 50% or more reporting no interest at all, compared with rates below 10% in the Nordics and Germany. Chile, Italy and Mexico report the highest level of disinterest in politics for the total population, whereas Japan joins the Nordics and Germany with the lowest levels of disinterest.
Three-quarter of immigrants with host-country nationality participated in the most recent national elections (Figure 8.12). This OECD average share is slightly below that of native-born (74% versus 80% respectively). Even when accounting for age and education, the gap in voter participation with native-born remains constant. Electoral participation among immigrants is below that of native-born in most OECD countries, with the exception of Estonia, Hungary, Israel, Lithuania and Poland.
In absolute terms, immigrants’ turnout is highest (around 90%) in Denmark and Belgium (two countries with a formal obligation for all citizens to vote), and lowest in the Czech Republic, Switzerland and Ireland (slightly below 60%). The ranking is relatively similar for the native-born participation. Gaps are widest, ranging from 12 to 20 points, in the Nordic countries, Southern Europe, Ireland, Germany, the Netherlands and Switzerland.
Voting in national parliamentary elections is one indicator of people’s participation in their community’s national life. The indicator used here to measure the participation of individuals in the electoral process is the “Voting age population turnout”, i.e. the percentage of the voting age population (VAP) that actually voted – as available from administrative records of member countries. The VAP is an estimate as it is difficult to accurately account for people who are of voting age but who are not registered voters, whatever the reason.
Cross-national comparisons for voter turnout data can be affected by a variety of factors including, the legal voting age, the voting registration system (automatic or requiring action by the potential voter) and whether voting is compulsory or not. In most OECD and European countries, the legal voting age in the national elections is 18 years old, but young people can vote from age 16 in Austria and Brazil and from age 17 in Greece and Indonesia.
Different types of elections occur in different countries according to their institutional structure and different geographical jurisdictions. For some countries, it should be noted, turnout for presidential elections and regional elections may be higher than for national parliamentary elections, perhaps because those elected through these ballots are constitutionally more important for how those countries are run. Data about voter turnout are extracted from the international database managed by the Institute for Democratic and Electoral Assistance (IDEA).
Data on interest in politics, are from the European Social Surveys (ESS8-2016) and the Word Value Survey Wave 6: 2010-14 (WVS). The questions in both surveys ask about How interested in politics and the respondent to choose between 4 categories: “Very interested”, “Quite interested”, “Hardly interested” and “Not at all interested”. Data refer to the rate of people answering to be not at all interested in politics.
Data on self-reported participation in most recent election for the foreign-born and native born population (Figure 8.12) are based on survey data (such as the European Social Survey, the Global Social Survey, or the Current Population Survey) therefore they differ from IDEA data presented in Figure 8.10.
Further reading
OECD/EU (2018), Settling In 2018: Indicators of Immigrant Integration, OECD Publishing, Paris/EU, Brussels, https://doi.org/10.1787/9789264307216-en.
Figure notes
Figure 8.10: Voting age population (VAP) turnout statistics are calculated by dividing the total vote by an estimated voting age population. The voting age population (VAP) includes all citizens above the legal voting age. Data refer to parliamentary elections, with the exceptions of France, Mexico, and Poland where presidential elections are considered due to higher participation rates. For more information about elections dates, see statlinks.
Figure 8.11: Data for Canada, Greece, Latvia and Luxembourg are not available.
Source: International Institute for Democracy and Electoral Assistance (IDEA), Voter Turnout database, www.idea.int.

Source: European Social Survey ESS8-2016, ESS7-2014 and World Values Survey Wave 6: 2010-2014.

Source: OECD/EU (2018), Settling In 2018: Indicators of Immigrant Integration, OECD Publishing, Paris/EU, Brussels, https://doi.org/10.1787/9789264307216-en, Chapter 5: Immigrant civic engagement and social integration.