copy the linklink copied!Mortality following acute myocardial infarction (AMI)
Mortality due to coronary heart disease has declined substantially since the 1970s (see indicator “Mortality from circulatory diseases” in Chapter 3). Important advances in both prevention policies, such as for smoking (see indicator “Smoking among adults” in Chapter 4), and treatment of cardiovascular diseases have contributed to these declines (OECD, 2015[1]). A good indicator of acute care quality is the 30-day AMI case-fatality rate. The measure reflects the processes of care, including timely transport of patients and effective medical interventions.
Figure 6.18 shows the case-fatality rates within 30 days of admission for AMI where the death occurs in the same hospital as the initial AMI admission. This method of calculating the indicator is influenced by not only the quality of care provided in hospitals but also differences in hospital transfers and average length of stay. The lowest rates are found in Iceland, Denmark, Norway, the Netherlands, Australia and Sweden (all 4% or less). The highest rates are in Latvia and Mexico, suggesting that AMI patients do not always receive recommended care in these countries. In Mexico, the absence of a co-ordinated system of care between primary care and hospitals may contribute to delays in reperfusion and low rates of angioplasty (Martínez-Sánchez et al., 2017[2]).
Figure 6.19 shows 30-day case-fatality rates where fatalities are recorded regardless of where they occur (including after transfer to another hospital or after discharge). This is a more robust indicator because it records deaths more widely than the same-hospital indicator, but it requires a unique patient identifier and linked data, which are not available in all countries. The AMI case-fatality rate in 2017 ranged from 4.0% in the Netherlands to 16.5% in Latvia.
Case-fatality rates for AMI decreased substantially between 2007 and 2017 (Figure 6.18 and Figure 6.19). Across OECD countries, case fatalities fell from 9.5% to 6.9% when considering same-hospital deaths and from 12.5% to 9.1% when considering deaths in and out of hospital.
Variations in AMI 30-day case-fatality rates at the national level are influenced by the dispersion of rates across hospitals within countries, as represented in Figure 6.20. The interquartile range of rates within countries varies markedly. The differences between the upper and lower rates are 1.9 deaths per 100 admissions for Sweden and 4.1 deaths per 100 admissions for Korea (based on linked data).
Multiple factors contribute to variations in outcomes of care, including hospital structure, processes of care and organisational culture. Recent research points to higher total numbers of hospital patients as being significantly related to higher performance; this may support national movements towards concentration of care services (Lalloué et al., 2019[3]).
The case-fatality rate measures the percentage of people aged 45 and over who die within 30 days following admission to hospital for a specific acute condition. Rates based on unlinked data only consider deaths occurring in the same hospital as the initial admission. Rates based on linked data consider deaths that occurred anywhere including in or outside hospital. While the linked data-based method is considered more robust, it requires a unique patient identifier to link the data across the relevant datasets, which is not available in all countries.
National rates are age-sex standardised to the 2010 OECD population aged 45 and over admitted to hospital for AMI (ICD-10 codes I21-I22) and ischaemic stroke (ICD-10 codes I63-I64).
Hospital-level AMI mortality rates use a different methodology from national rates. Hospital rates are adjusted for age, sex, co-morbidity and previous AMI (linked data only). The reference population for hospital rates is constructed from data from participating countries (Padget, forthcoming[4]).
Figure 6.20 is a turnip plot that graphically represents the relative dispersion of rates. A limitation of this type of representation is the inability to detect statistically significant variations. Countries are ordered according to ascending level of dispersion as measured by the interquartile range (between the 25th and 75th percentile) of rates. Hospitals with fewer than 50 AMI admissions were excluded from both figures to improve data reliability.
References
[4] Padget, M. (forthcoming), “OECD Hospital Performance Project: Methodological Development of International Measurement of Acute Myocardial Infraction 30-Day Mortality Rates at the Hospital Level”, OECD Health Working Papers, OECD Publishing, Paris.
[3] Lalloué, B. et al. (2019), “Does size matter? The impact of caseload and expertise concentration on AMI 30-day mortality-A comparison across 10 OECD countries.”, Health policy (Amsterdam, Netherlands), Vol. 123/5, pp. 441-448, https://doi.org/10.1016/j.healthpol.2019.03.007.
[2] Martínez-Sánchez, C. et al. (2017), “Reperfusion therapy of myocardial infarction in Mexico: A challenge for modern cardiology.”, Archivos de cardiologia de Mexico, Vol. 87/2, pp. 144-150, https://doi.org/10.1016/j.acmx.2016.12.007.
[1] OECD (2015), Cardiovascular Disease and Diabetes: Policies for Better Health and Quality of Care, OECD Health Policy Studies, OECD Publishing, Paris, https://dx.doi.org/10.1787/9789264233010-en.
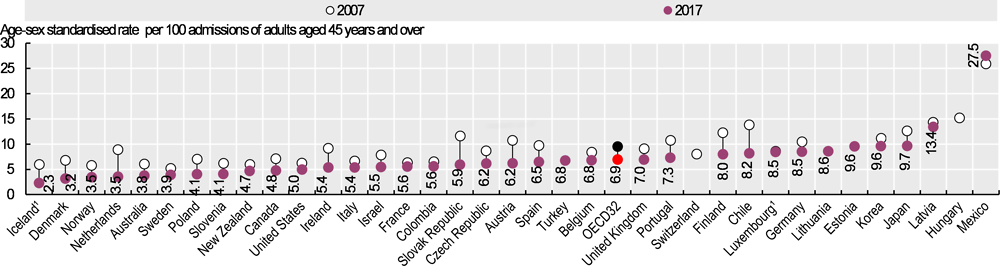
1. Three-year average.
Source: OECD Health Statistics 2019.
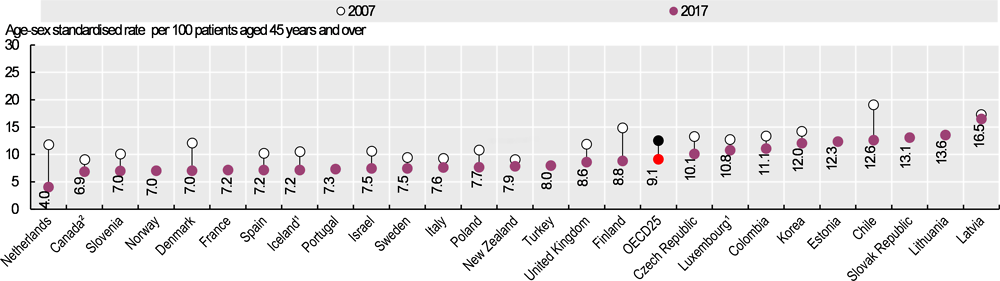
1. Three-year average. 2. Results for Canada do not include deaths outside acute care hospitals.
Source: OECD Health Statistics 2019.
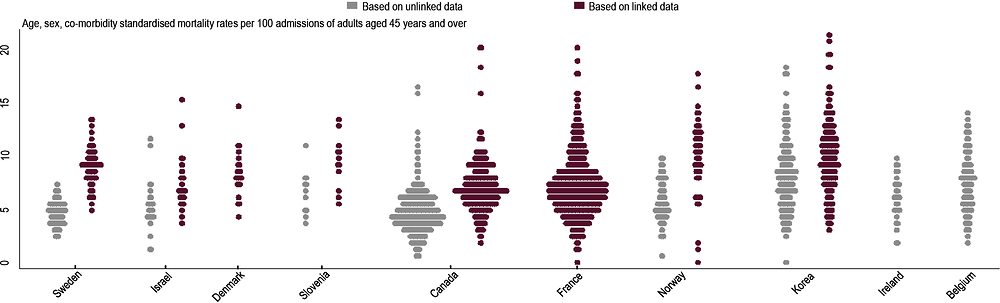
Note: The width of each line in the figure represents the number of hospitals (frequency) with the corresponding rate.
Source: OECD Hospital Performance Data Collection 2019.
Metadata, Legal and Rights
https://doi.org/10.1787/4dd50c09-en
© OECD 2019
The use of this work, whether digital or print, is governed by the Terms and Conditions to be found at http://www.oecd.org/termsandconditions.