
Indicator A2. Transition from education to work: Where are today’s youth?
Slightly over half of 18-24 year-olds across OECD countries were still in education or training as of the first quarter of 2021. Around one-third of these students combine their education or training with some form of employment. In a few countries (e.g. Germany and Switzerland) employment tends to be linked to the study programme, while in most others these jobs are mostly unconnected to the curriculum.
Young people who did not complete upper secondary education face a high risk of finding themselves neither employed, nor in formal education or training (NEET). As of the first quarter of 2021, the share of NEETs was nearly four times as high among 25-29 year-olds without an upper secondary qualification as among their tertiary-educated peers. However, in some countries NEET rates are high even among tertiary graduates: over 30% of tertiary graduates in Greece and South Africa are NEET. In contrast, there are some countries where those without a tertiary qualification fare well: the share of NEETs is 10% or less among upper secondary or post-secondary non-tertiary graduates in Denmark, the Netherlands and Sweden.
Annual data, which are more suitable for comparing outcomes during the COVID-19 pandemic, suggest the share of young adults who are NEET has returned to, or fallen below, pre-COVID levels in about a two-thirds of OECD countries. In 2021, almost 15% of 18-24 year-olds were NEET.
Context
The length and the quality of the schooling that individuals receive both have an impact on their transition from education to work, as do labour-market conditions, the economic environment and the cultural context. In some countries, young people traditionally complete education before they look for work, while in others, education and employment are concurrent. In some countries, there is little difference between how young women and young men experience the transition from education to work, while in others significant proportions of young women are not in the labour force (OECD, 2022[1]). When labour-market conditions are unfavourable, young people have an incentive to stay in education longer, because high unemployment rates drive down the opportunity costs of education, and they can develop their skills for when the situation improves.To improve the transition from education to work, regardless of the economic climate, education systems should aim to ensure that individuals have the skills the labour market needs. Public investment in education can be a sensible way to counterbalance unemployment and invest in future economic growth, by building the necessary skills. Public support could also be directed towards potential employers, through the creation of incentives to hire young people.
Not having a job can have long-lasting consequences, especially when people experience long spells of unemployment or inactivity and become discouraged. Young people who are NEET are a major policy concern, as it has a negative impact on their labour-market prospects and social outcomes, including in the long term. It is therefore essential to have policy measures to prevent young people becoming NEET in the first place, and to help those who are to find a way back into education or work.
Other findings
Brazil, Greece, Italy and South Africa have the highest share of young people suffering long-term unemployment: around 5% or more of 18-24 year-olds in these countries were not in education and had been unemployed for at least 12 months in the first quarter of 2021. This leaves them particularly at risk of long-term detachment from the labour market.
The share of inactive NEET youth has been relatively stable over the past 15 years, while the share of unemployed NEET youth has varied with the economic cycle. Following the economic crisis of 2008 the share of unemployed NEET youth peaked in the first quarter of 2013 at 9.6% of 25-29 year-olds across OECD countries with available trend data. Unemployment among young adults then started to fall, until the new shock created by the COVID-19 pandemic.
In some countries there are large regional disparities in the share of NEET youth: in four countries the gap between the regions with the highest and lowest shares of NEET 18-24 year-olds exceeds 20 percentage points. This highlights the importance of education and labour-market policies that are tailored to local contexts.
Note
This indicator analyses the situation of young people in transition from education to work: those in education, those who are employed, and those who are neither employed nor in formal education or training (NEET). The NEET group includes not only those who have not managed to find a job (unemployed NEETs), but also those who are not actively seeking employment (inactive NEETs). The analysis distinguishes between 18-24 year-olds and 25-29 year-olds, as a significant proportion of those in the younger age group will still be continuing their studies even though they are no longer in compulsory education.
The analysis in this indicator is based on quarterly data, except for the section on the impact of COVID-19. For more information on the reference periods, refer to the Methodology section and Annex 3.
Educational and labour-market status of youth
Across OECD countries, a little over half of 18-24 year-olds are still in formal education, either full- or part-time. Almost one-third of these students are also pursuing some form of employment (Figure A2.1). In some cases, students’ jobs are connected to their study programme, allowing them to gain relevant work experience, develop technical skills and connect with potential employers. Programmes that involve paid work as part of the curriculum (referred to as “work-study programmes” in Table A2.1) are particularly common in Germany and Switzerland, where many professional qualifications follow an upper secondary vocational qualification and are pursued in parallel with employment in the relevant sector (OECD, 2022[2]). In Australia and Norway, working while studying is common among 18-24 year-olds, but their employment is typically not connected to the programme (e.g. a student job in a restaurant). In Iceland, the Netherlands and New Zealand students also commonly combine work and study, but the data do not distinguish between work-study programmes and other types of employment (Table A2.1). Even where it is not part of the curriculum, such employment may still be valuable in developing broad employability skills, like team work and conflict management, thereby facilitating the transition into employment. Data from the European Labour Force Survey (EU-LFS) show that tertiary graduates who pursued work experience outside the curriculum during their studies had higher employment rates than those who gained no work experience while studying (OECD, 2022[2]).
The share of young people neither employed nor in formal education or training (NEET) is a key indicator of the ease of transition from education to the labour market. Across OECD countries about 16.1% of 18-24 year-olds are NEET, while in Chile, Colombia, Costa Rica, Italy and the Republic of Türkiye, the share is over 25% (Figure A2.1). Preventing youth from becoming NEET and minimising the time spent without employment, education or training is essential. Youth who are NEET not only miss out on immediate learning and employment opportunities, they also suffer from long-term effects. NEET status has been associated with various adverse outcomes, such as lower employment rates and lower earnings later in life (Helbling and Sacchi, 2014[3]; Möller and Umkehrer, 2014[4]; Ralston et al., 2021[5]), poor mental health (Basta et al., 2019[6]) and social exclusion (Bäckman and Nilsson, 2016[7]).
Looking at the share of both inactive and unemployed NEETs among 25-29 year-olds helps to capture the labour-market transition of young people who pursued tertiary education, as 18-24 year-olds who are pursuing tertiary studies are mostly still in education. It is important to interpret data on NEET rates and the share of unemployed NEET youth in the context of unemployment rates in the country’s total labour force (see Indicator A3). The share of young people who are unemployed NEETs tends to be higher in countries with higher unemployment rates in the total labour force. Over the past 15 years, the share of inactive youth has been almost stable, while the share of unemployed youth appears to fluctuate with the business cycle. During the economic crisis of 2008 the share of unemployed NEETs increased, reaching a maximum of 9.6% of 25-29 year-olds in 2013 on average across OECD countries with available trend data. It took almost a decade for this rate to return to pre-crisis levels (Figure A2.2). The impact of the Great Recession had just subsided, when the COVID-19 pandemic produced another shock to labour markets. However, data for 2021 refer to the first quarter for most countries and therefore do not yet capture the impact of the COVID-19 pandemic (see the last section for an analysis of the impact of the pandemic on NEET rates).
Long-term NEET rates
The time young people spend as NEET matters. Some frictional unemployment is natural and to some extent inevitable: when young school leavers and graduates start searching for a job, it may take them some time to find a suitable one. Some young workers will want to switch jobs, which may also involve a period of unemployment. Longer spells spent as a NEET, however, reveal difficulties with the transition from education into work. Long-term unemployment can lead to financial hardship, forcing young people to accept jobs that may not match their skills. It may also have a scarring effect on their future employment prospects (OECD, 2021[8]). The share of NEET youth who have been unemployed for 12 months or more is particularly high in Brazil, Greece, Italy and South Africa, at around 5% of more of all 18-24 year-olds. In Argentina, the Slovak Republic and Spain the figure is also relatively high, around 3%, while the OECD average is around 1.4% (Figure A2.3). The share of youth who have been unemployed for at least 12 months provides a lower-bound estimate for those at risk of long-term detachment from the labour market: in addition to long-term unemployed NEETs there are also those who are inactive (i.e. neither working nor actively seeking employment). On average across OECD countries with data available on the duration of unemployment and inactivity, there are more inactive NEETs (9.4% of 18-24 year-olds) than unemployed ones (6.4%) (Table A2.2).
The impact of educational attainment on the risk of becoming NEET
Given the poor economic and social prospects associated with being NEET as a young person, prevention is a key policy objective. Raising educational attainment while maintaining high quality standard, is a powerful tool to achieve this. There is a strong association between educational attainment and NEET status. Young people who failed to complete upper secondary education face the highest risk of being NEET. On average across OECD countries, 42.2% of 25-29 year-olds without an upper secondary qualification are NEET. In some countries the figure is much higher: 77.8% in the Slovak Republic and 60.9% in Greece. Achieving an upper secondary or post-secondary non-tertiary qualification is associated with a much lower risk of being NEET (20.0% on average across OECD countries) (Figure A2.4). Ensuring that all young people complete at least upper secondary education is therefore an essential part of preventing them from becoming NEET.
NEET rates are even lower among tertiary graduates, averaging 12.1% across OECD countries. Among OECD countries, obtaining a tertiary qualification reduces the risk of being NEET most strongly in Costa Rica, Ireland and the United States. However, in some countries a tertiary qualification offers more limited protection. In Greece and the Slovak Republic tertiary graduates face nearly as high a risk of being NEET as those holding only an upper secondary or post-secondary non-tertiary qualification (Figure A2.4). High NEET rates among tertiary graduates may reflect various factors, such as a weak economy, a mismatch between the skills of graduates and labour-market needs, and the fact that tertiary graduates, having studied longer, may be willing to take longer to find a suitable job. Denmark is an exception in that NEET rates are higher among tertiary graduates than among those with an upper secondary or post-secondary non-tertiary qualification, but NEET rates are relatively low in both groups. Denmark is one of the few countries, together with the Netherlands and Sweden, where NEET rates are below 10% among 25-29 year-olds with upper secondary or post-secondary non-tertiary attainment (Figure A2.4).
Subnational variations in NEET rates
Within individual countries, there is often much regional variation in the share of young people who are NEET. In some regions a very high share of young adults are NEET. Since the definition of NEET used by the EU-LFS for subnational data collection is different from the one used by other surveys (see Methodology section), the analysis in this section focuses on the variations by subnational region within countries.
Regional disparities in the share of NEET youth are strongest in Colombia, Greece, Italy and Türkiye. In these countries the gap between the region with the highest share of 18-24 year-old NEETs and the region with the lowest share exceeds 20 percentage points. Regional disparities are smallest in Denmark, the Netherlands, Norway and Slovenia where the gap between the highest and lowest regions is below 5 percentage points (OECD, 2022[9]).
It should be noted that in the dataset the number of regions per country varies. In general, the countries with more regions in the dataset have larger gaps between the regions with the highest and lowest shares of NEET youth. However, such aggregation choices are not the only drivers of the results. For example, among the 9 OECD and partner countries that report 8-13 large regions, the size of the gap ranges from 4 percentage points in the Netherlands to 25 percentage points in Greece (OECD, 2022[10]).
Impact of COVID-19: Insights from annual data
The initial impact of the COVID-19 pandemic affected large parts of OECD countries’ economies, as severe restrictions reduced economic activity across the board. As measures became more targeted, many returned to work, but labour-market conditions remain difficult, particularly for young people. The COVID-19 crisis has hit youth, as well as other vulnerable groups in the labour market, particularly hard. Recessions always affect young people more than prime-age workers (i.e. those aged 25-54): they are less experienced and as the last in, they are often the first out. In addition, lockdown and social distancing measures have strongly affected sectors that commonly employ young people, such as hospitality. Among those who continued to work, adults under 25 saw their working hours fall much faster than those aged 25 or more. Those who had recently finished their studies have struggled to find a job. It was also hard for those seeking an internship or other type of work placement to find places, depriving many young people of a potential bridge into a first job (OECD, 2021[8]).
Figure A2.5 uses annual data on NEET rates among 18-24 year-olds over the past three years. Annual data do not capture potential fluctuations that may occur within a year, whether as a result of the pandemic or due to other factors. However, they are more suitable for comparative analysis than the quarterly data used in the other figures here. Quarterly data have been strongly shaped by waves of the COVID-19 pandemic, which have evolved at different times and paces across countries, making comparisons difficult.
On average across OECD countries, the share of 18-24 year-olds who were NEET increased from 14.6% in 2019 to 16.6% in 2020, before starting to fall in 2021. NEET rates have returned to pre-pandemic levels in most OECD countries and the average share of NEET youth across OECD countries in 2021 only exceeded 2019 levels by about 1 percentage point. In 11 OECD countries, the share of NEET youth was even lower in 2021 than in 2019 (Figure A2.5 and Table A2.4). These results are consistent with other analyses on youth employment (OECD, 2021[8]), which suggest government measures have been effective in supporting young people back into education, training or employment, thereby minimising the long-term damage that the pandemic might have caused to labour-market outcomes.
Educational attainment refers to the highest level of education successfully completed by an individual.
Employed, inactive and unemployed individuals: See Definitions section in Indicator A3.
Individuals in education are those who are receiving formal education and/or training.
Levels of education: See the Reader’s Guide at the beginning of this publication for a presentation of all ISCED 2011 levels.
NEET refers to young people neither employed nor in formal education or training. However, the definition of NEET is different for subnational data collection for countries taking part in the EU-LFS, where young adults who are in non-formal education or training are not considered to be NEET.
Work-study programmes are formal education/training programmes combining interrelated study and work periods, for which the student/trainee receives pay.
Data from the national labour force surveys usually refer to the second quarter of studies, as this is the most relevant period for knowing if the young person is really studying or has left education for the labour force. This second quarter corresponds in most countries to the first three months of the calendar year (i.e. January, February and March), but in some countries to the second three months (i.e. April, May and June).
In Table A2.2, the share of young adults who have been unemployed for at least 3 months but less than 12 months refer to the share of those who have been unemployed for less than 12 months in Australia, Colombia, Portugal, Switzerland and Türkiye.
The last section in this indicator, on the impact of the COVID-19 pandemic, uses annual data from national labour force surveys (LFS) for reference years 2019, 2020 and 2021.
Annual data may underestimate the number of students, as the data include summer months when many students are not enrolled and not counted as students in data collections. This issue arises, for example, in the United States.
Education or training corresponds to formal education or training; therefore, someone not working but following non-formal studies is considered NEET. However, the definition of NEET is different for subnational data collection for countries taking part in the EU-LFS, where young adults who are in non-formal education or training are not considered to be NEET. For OECD EU countries, NEET rates by subnational region are therefore not comparable to the rates at national level presented in this indicator.
Please see the OECD Handbook for Internationally Comparative Education Statistics 2018 (OECD, 2018[11]) for more information and Annex 3 for country-specific notes (https://www.oecd.org/education/education-at-a-glance/EAG2022_X3-A.pdf).
For information on the sources, see Indicator A1.
Data on subnational regions for selected indicators are available in the OECD Regional Statistics Database (OECD, 2022[9]).
References
[7] Bäckman, O. and A. Nilsson (2016), “Long-term consequences of being not in employment, education or training as a young adult. Stability and change in three Swedish birth cohorts”, European Societies, Vol. 18/2, pp. 136-157, https://doi.org/10.1080/14616696.2016.1153699.
[6] Basta, M. et al. (2019), “NEET status among young Greeks: Association with mental health and substance use”, Journal of Affective Disorders, Vol. 253, pp. 210-217, https://doi.org/10.1016/J.JAD.2019.04.095.
[3] Helbling, L. and S. Sacchi (2014), “Scarring effects of early unemployment among young workers with vocational credentials in Switzerland”, Empirical Research in Vocational Education and Training, Vol. 6/12, https://doi.org/10.1186/s40461-014-0012-2.
[4] Möller, J. and M. Umkehrer (2014), “Are there long-term earnings scars from youth unemployment in Germany?”, ZEW Discussion Papers, No. 14-089, Centre for European Economic Research, http://ftp.zew.de/pub/zew-docs/dp/dp14089.pdf.
[1] OECD (2022), OECD Gender Data Portal, http://www.oecd.org/gender/data (accessed on 30 June 2022).
[9] OECD (2022), OECD Regional Database - Education, https://stats.oecd.org/Index.aspx?DataSetCode=REGION_EDUCAT (accessed on 20 July 2022).
[10] OECD (2022), OECD Regional Statistics (database), https://doi.org/10.1787/213e806c-en.
[2] OECD (2022), Pathways to Professions: Understanding Higher Vocational and Professional Tertiary Education Systems, OECD Reviews of Vocational Education and Training, OECD Publishing, Paris, https://doi.org/10.1787/a81152f4-en.
[8] OECD (2021), OECD Employment Outlook 2021: Navigating the COVID-19 Crisis and Recovery, OECD Publishing, Paris, https://doi.org/10.1787/5a700c4b-en.
[11] OECD (2018), OECD Handbook for Internationally Comparative Education Statistics 2018, OECD Publishing, Paris, https://doi.org/10.1787/9789264304444-en.
[5] Ralston, K. et al. (2021), “Economic inactivity, not in employment, education or training (NEET) and scarring: The importance of NEET as a marker of long-term disadvantage:”, Work, Employment and Society, Vol. 36/1, pp. 59-79, https://doi.org/10.1177/0950017020973882.
Cut-off date for the data: 17 June 2022. Any updates on data can be found on line at: https://doi.org/10.1787/eag-data-en. More breakdowns can also be found at: http://stats.oecd.org, Education at a Glance Database.
Table A2.1. Percentage of 18-24 year-olds in education/not in education, by work status (2021, quarterly data) |
|---|
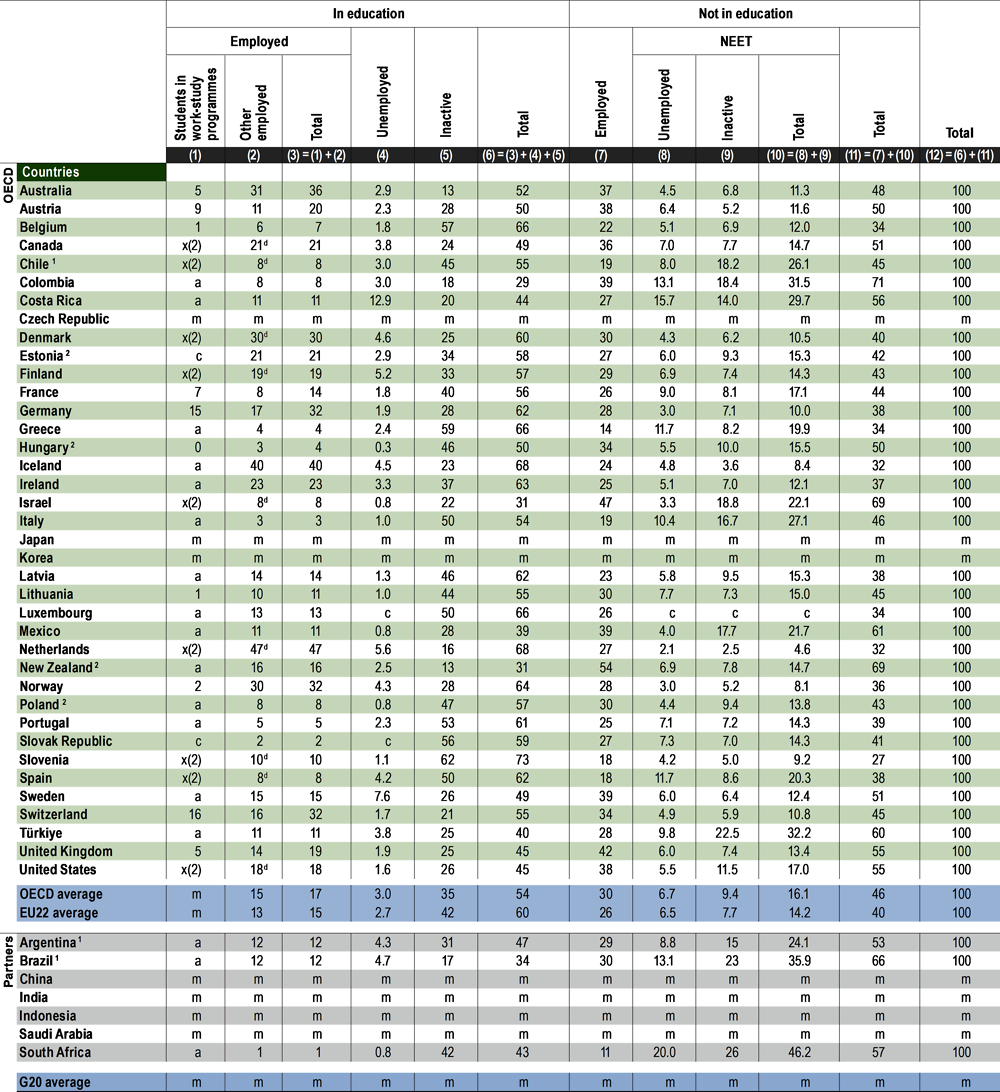 |
Note: NEET refers to young people who are neither employed nor in formal education or training. Data usually refer to the second quarter of studies, which corresponds in most countries to the first three months of the calendar year, but in some countries, to the second three months. See Definitions and Methodology sections for more information. Data and more breakdowns are available at http://stats.oecd.org/, Education at a Glance Database. |
1. Reference year differs from 2021: 2020 for Brazil and Chile; 2018 for Argentina. |
2. Data refer to the annual average for Estonia, Hungary and Poland; data refer to the average of March to December 2021 for New Zealand. |
Source: OECD (2022). See Source section for more information and Annex 3 for notes (https://www.oecd.org/education/education-at-a-glance/EAG2022_X3-A.pdf). Please refer to the Reader's Guide for information concerning symbols for missing data and abbreviations. |
Table A2.2. Percentage of 18-24 year-olds in education/not in education, by work status and duration of unemployment (2021, quarterly data) |
|---|
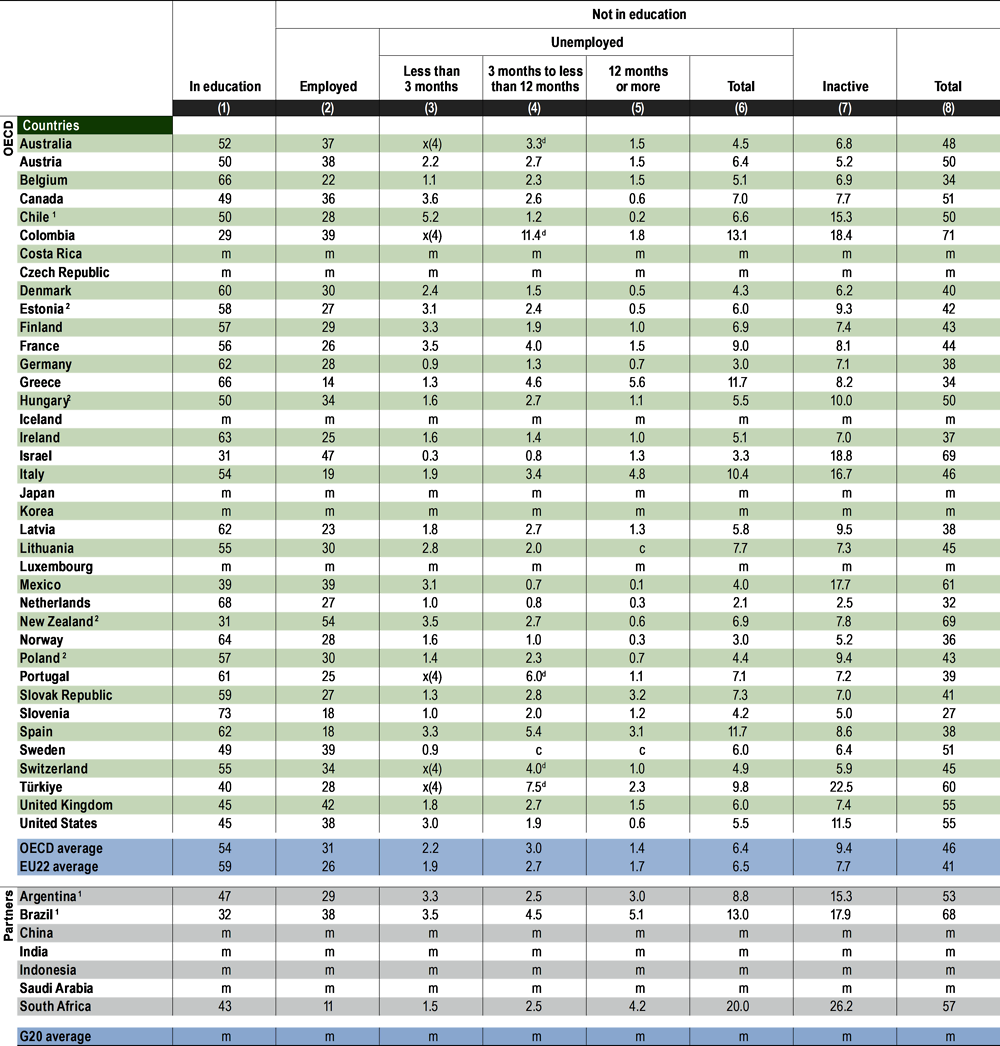 |
Note: The figures by the duration of unemployment may not add up to the total share for the unemployed because of missing data. Data usually refer to the second quarter of studies, which corresponds in most countries to the first three months of the calendar year, but in some countries, to the second three months. See Definitions and Methodology sections for more information. Data and more breakdowns are available at http://stats.oecd.org/, Education at a Glance Database. |
1. Year of reference differs from 2021: 2018 for Argentina and Brazil; and 2017 for Chile. |
2. Data refer to the annual average for Estonia, Hungary and Poland; data refer to the average of March to December 2021 for New Zealand. |
Source: OECD (2022). See Source section for more information and Annex 3 for notes (https://www.oecd.org/education/education-at-a-glance/EAG2022_X3-A.pdf). Please refer to the Reader's Guide for information concerning symbols for missing data and abbreviations. |
Table A2.3. Percentage of 25-29 year-olds in education/not in education, by educational attainment and work status (2021, quarterly data) |
|---|
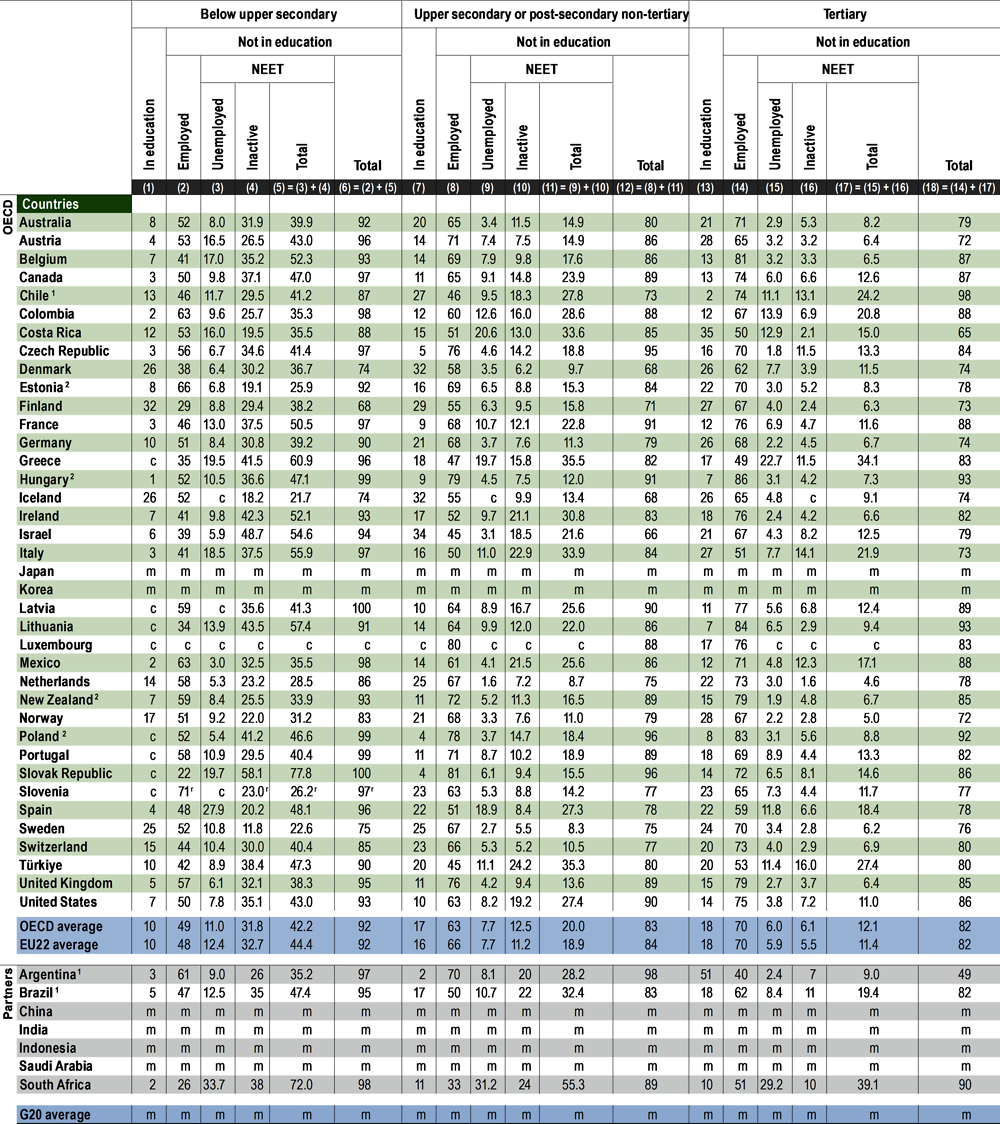 |
Note: NEET refers to young people who are neither employed nor in formal education or training. Data usually refer to the second quarter of studies, which corresponds in most countries to the first three months of the calendar year, but in some countries, to the second three months. See Definitions and Methodology sections for more information. Data and more breakdowns are available at http://stats.oecd.org/, Education at a Glance Database. |
1. Reference year differs from 2021: 2020 for Brazil and Chile; 2018 for Argentina. |
2. Data refer to the annual average for Estonia, Hungary and Poland; data refer to the average of March to December 2021 for New Zealand. |
Source: OECD (2022). See Source section for more information and Annex 3 for notes (https://www.oecd.org/education/education-at-a-glance/EAG2022_X3-A.pdf). Please refer to the Reader's Guide for information concerning symbols for missing data and abbreviations. |
Table A2.4. Trends in the percentage of young adults in education/not in education, by age group and work status (2019 to 2021, annual data) |
|---|
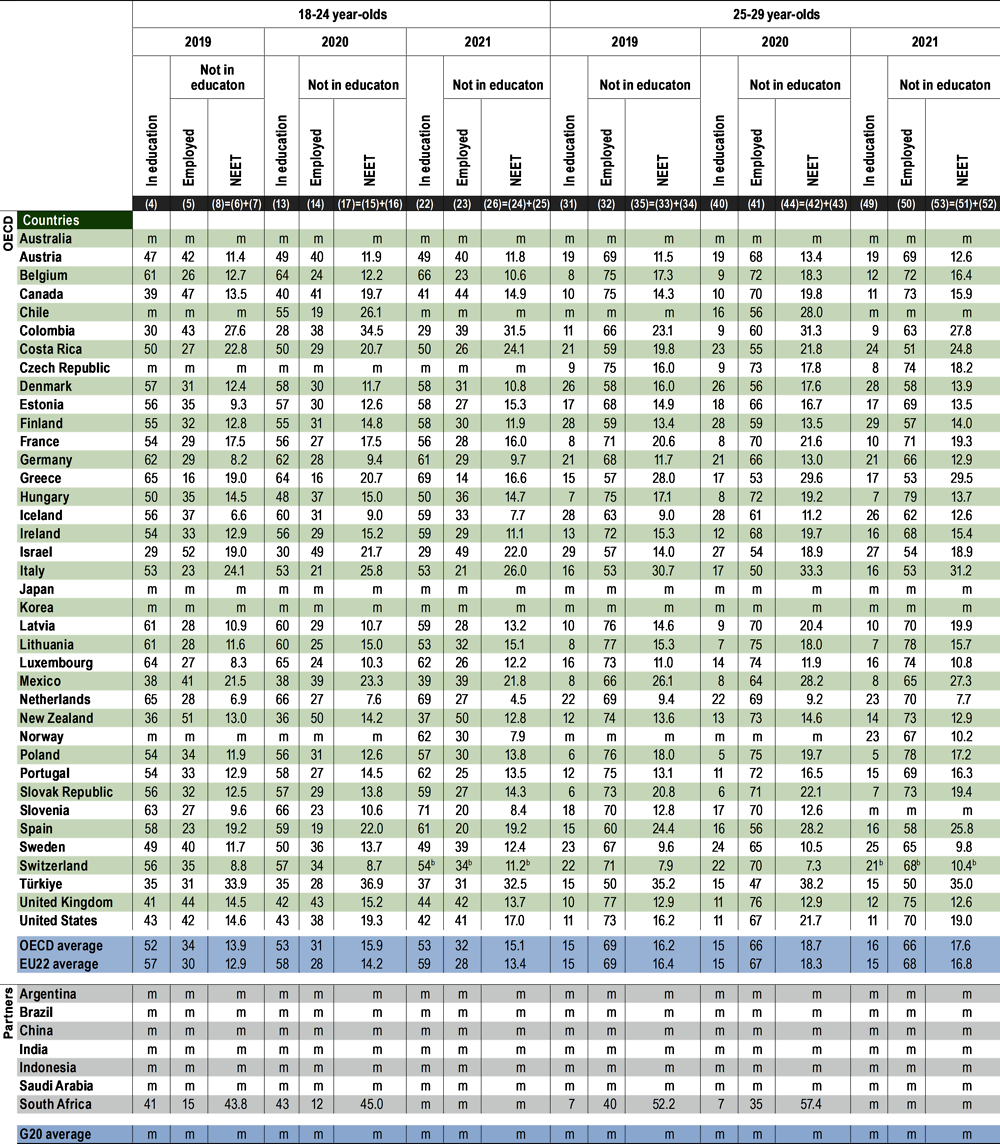 |
Note: NEET refers to young people who are neither employed nor in formal education or training. See Definitions and Methodology sections for more information. Data and more breakdowns are available at http://stats.oecd.org/, Education at a Glance Database. |
Additional columns showing data on the percentage of young adults in education by work status, and the percentage of unemployed and inactive NEETs are available for consultation on line (see StatLink below). |
Source: OECD (2022). See Source section for more information and Annex 3 for notes (https://www.oecd.org/education/education-at-a-glance/EAG2022_X3-A.pdf). Please refer to the Reader's Guide for information concerning symbols for missing data and abbreviations. |