
Indicator D2. What is the student-teacher ratio and how big are classes?
At upper secondary level, the programme orientation can strongly influence the student-teacher ratio. In about 40% of OECD countries with data, the ratio is greater in vocational programmes than in general ones.
On average across OECD countries with available data, the student-teacher ratio is slightly higher in public institutions than in private ones at both lower and upper secondary level.
Between 2005 and 2018, class sizes have fallen by 2% at primary level and 7% at lower secondary level on average across OECD countries.

1. Upper secondary includes programmes outside upper secondary level - see Annex 3 for further details.
Countries are ranked in descending order of the ratio of students to teaching staff in upper secondary general programmes.
Source: OECD/UIS/Eurostat (2020), Table D2.1. See Source section for more information and Annex 3 for notes (https://doi.org/10.1787/69096873-en).
Context
Class sizes and student-teacher ratios are much-discussed aspects of education and are among the determinants of the demand for teachers, along with students’ instruction time (see Indicator D1), teachers’ working time and the division of teachers’ time between teaching and other duties (see Indicator D4). Together with teachers’ salaries (see Indicator D3) and instruction time (see Indicator D1), class size and student-teacher ratios also have a considerable impact on the level of current expenditure on education through teacher salary costs (Box D2.3).
The ratio of students to teaching staff is an indicator of how resources for education are allocated. Smaller student-teacher ratios often have to be weighed against measures such as higher salaries for teachers, investment in their professional development, greater investment in teaching technology, or more widespread use of assistant teachers whose salaries are often considerably lower than those of teachers.
Smaller classes are often seen as beneficial, because they allow teachers to focus more on the needs of individual students and reduce the amount of class time needed to deal with disruptions. Yet, while there is some evidence that smaller classes may benefit specific groups of students, such as those from disadvantaged backgrounds (Piketty and Valenaire, 2006[1]), overall evidence of the effect of class size on student performance is mixed (Fredriksson, Öckert and Oosterbeek, 2013[2]; OECD, 2016[3]). Changes in class size over periods of time may also reveal potential imbalances in the supply of teachers compared to student demand. Some countries face difficulties in recruiting new teachers to respond to a growing student base, while others face the opposite problem of adjusting the overall number of teachers to declining enrolments (OECD, 2019[4]).
In the context of the 2020 global COVID-19 crisis, class size will be a critical parameter that will determine if and how schools reopen after the lockdown measures imposed in most OECD and partner countries. Guidelines on social distancing have imposed a minimum safety distance between students that will need to be accommodated in current classrooms. Countries with larger classes will face more challenges in reorganising student groups to minimise the risks of viral transmission (Box D2.2).
Other findings
On average across OECD countries, there are 15 students for every teacher at primary level but the ratio ranges from 9 to 1 in Greece and Luxembourg to 26 to 1 in Mexico.
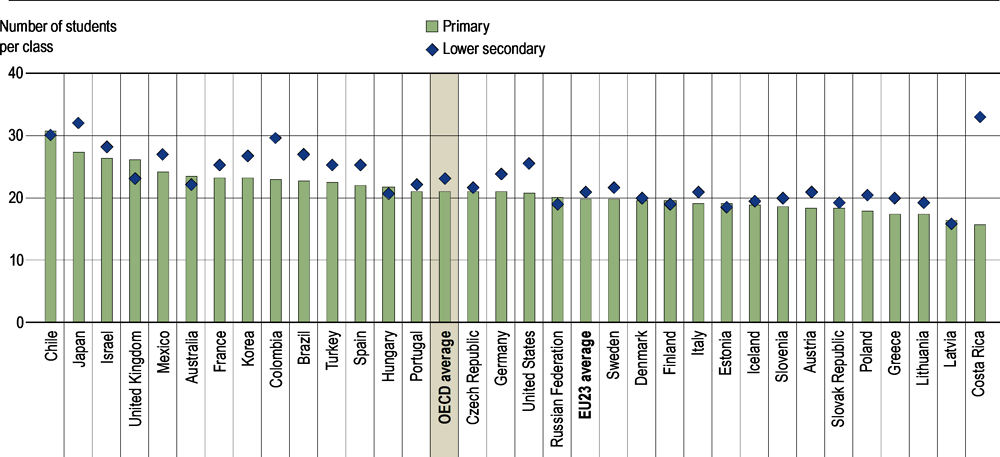
At primary level, the average class in OECD countries has 21 students. There are fewer than 25 students per class in nearly all of the countries with available data, with the exception of Chile, Israel, Japan, and the United Kingdom.
On average across OECD countries, average class sizes do not differ between public and private institutions by more than one student per class in either primary or lower secondary education.
Student-teacher ratios
By level of education
The ratio of students to teaching staff compares the number of students (full-time equivalents) to the number of teachers (full-time equivalents) at a given level of education and in similar types of institutions. This ratio does not take into account the amount of instruction time students have relative to the length of teachers’ working days, nor how much time teachers spend teaching. Therefore, it cannot be interpreted in terms of class sizes (Box D2.1).
On average across OECD countries, there are 15 students for every teacher at primary level but the ratio ranges from 9 to 1 in Greece and Luxembourg to 26 to 1 in Mexico. On average, there are fewer students per teacher at secondary level (13 students per teacher) than at primary level. This reduction in the student-teacher ratio between primary and secondary level may result from differences in annual instruction time (as instruction hours tend to increase with the education level, so does the number of teachers) or from differences in teaching hours (teaching time decreases with the level of education as teacher specialisation increases). Only Chile, Colombia, Costa Rica, Hungary, Mexico, and the Netherlands, have a larger student to teacher ratio at secondary level than at primary level (Table D2.1).
On average, the student-teacher ratio is about the same in lower and upper secondary education (13 students per teacher). In some countries, however, it varies widely between these two levels. This is the case in Finland, where there are over twice as many students per teacher at the upper secondary level than at the lower secondary level. In Mexico, it is the opposite case, with 33 students per teacher at lower secondary level compared to 22 at upper secondary level (Table D2.1).
At the upper secondary level, the programme orientation can strongly influence the student-teacher ratio although on average the ratios of students to teaching staff in upper secondary vocational and general programmes are similar (13 to 1). In about 40% of OECD countries with data, the ratio is greater in vocational programmes than in general ones. In Latvia, New Zealand and the United Kingdom, there are about 9 students more per teacher in vocational programmes than in general ones. In other countries such as Brazil and Mexico, the difference is reversed: there are over ten students more per teacher in general programmes (Figure D2.1).
A combination of several factors may influence the variation in student-teacher ratios between vocational and general upper secondary programmes. In some countries, vocational programmes are significantly work-based, so vocational students spend considerable time outside the school resulting in fewer teachers (OECD, 2017[5]). Countries where more than half of upper secondary vocational students are enrolled in combined school- and work-based programmes tend to have an equal or higher number of students per teacher in vocational than in general programmes. In contrast, in most countries where all upper secondary vocational students are enrolled in school-based programmes, the student-teacher ratio in general programmes tends to be the same or higher than in vocational ones.
However, programme type alone does not explain all differences between student-teacher ratio in vocational and general upper secondary education. Other factors, such as field of study, also influence the student-teacher ratio in vocational programmes. Some fields require greater instructor attention and supervision, particularly those where students have access to more sophisticated equipment (Hoeckel, 2008[6]). This may be particularly the case in technical fields such as engineering, manufacturing and construction, or some specialties in health and welfare. For example, Latvia and the United Kingdom have among the lowest shares of upper secondary vocational students graduating from the combined fields of engineering, manufacturing and construction and health and welfare across OECD countries (see Box B7.1). In both countries, there are nine more students per teacher in vocational than in general programmes, the highest difference across OECD countries. In contrast, the fields of study of upper secondary vocational graduates in Austria, Germany and Switzerland are more diversified, which may explain the similar student-teacher ratios across programme orientations in these countries. These differences have important implications for the cost of vocational instruction, as advanced vocational training in specialised fields of study requires both complex machinery and a greater level of human resources (Klein, 2001[7]). In most countries with available data, the cost per student in upper secondary vocational programmes is higher than in general ones (see Box C1.1).
At tertiary level, there are on average 15 students per teaching staff member. The student-teacher ratio ranges from 4 to 1 in Luxembourg to over 25 to 1 in Colombia and Indonesia. The difference in student-teaching staff ratios across short-cycle tertiary and bachelor’s, masters and doctoral or equivalent level varies across countries with available data. These results should be interpreted with caution, however, as the student-teacher ratio remains a limited measure of the level of teaching resources at tertiary level, where research staff may make up a significant share of academic personnel. Moreover, the relatively low enrolment in short-cycle tertiary in some countries limits comparability across tertiary levels (see Indicator B1).
By type of institution
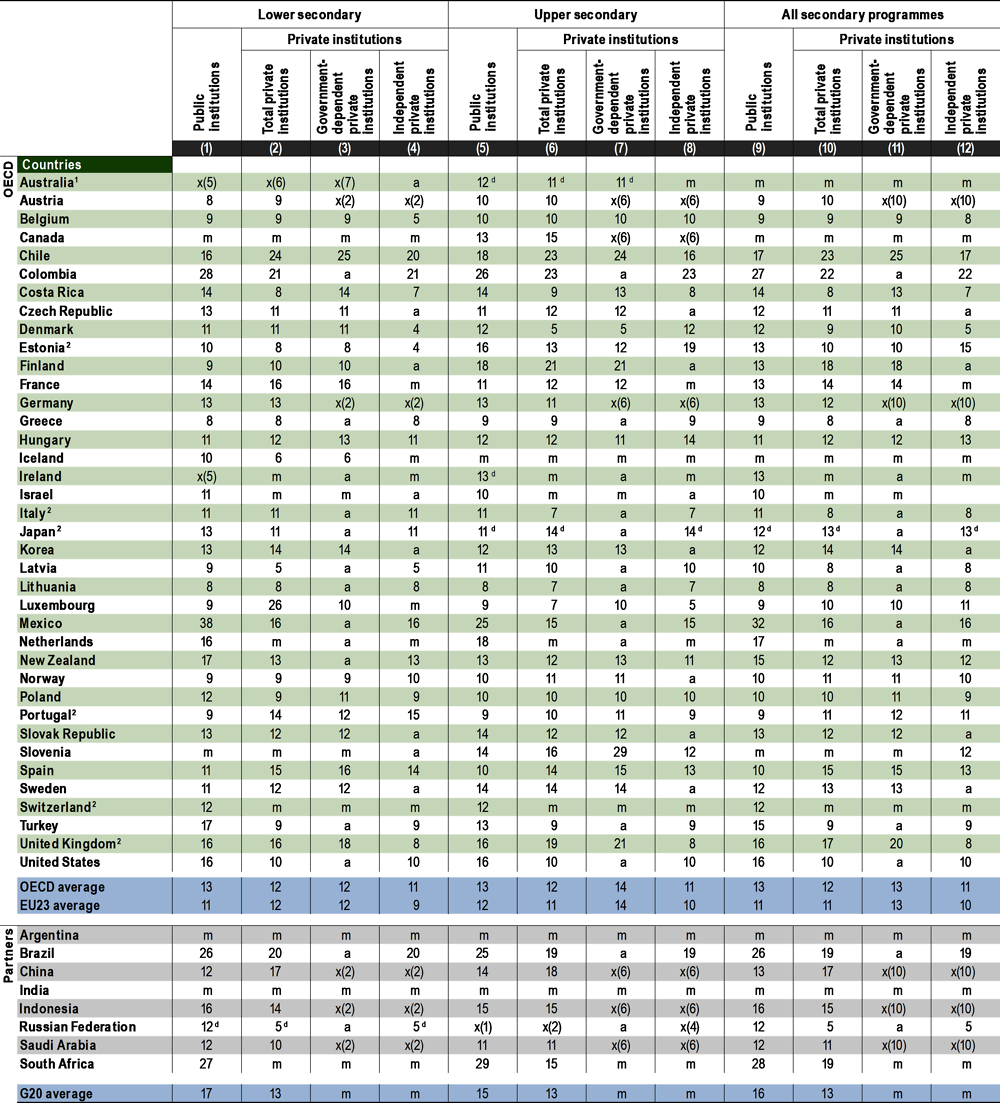
On average across OECD countries with available data, the ratios of students to teaching staff are slightly higher in public institutions than in private institutions at lower and upper secondary level (Table D2.2). However, this can differ significantly across countries. At lower secondary level, about 40% of OECD and partner countries with available data have more students per teacher in private institutions than in public ones. Among those countries, the largest difference between private and public institutions is found in Chile, Portugal and Spain -where there are at least 5 more students per teacher in private institutions than in public ones- and particularly in Luxembourg with 17 more students. In contrast, in Mexico and the Russian Federation, the ratios of students to teaching staff is over two times higher in public institutions. At upper secondary level, the student-teacher ratio is larger in public institutions than in private institutions in 18 countries, smaller in public institutions in 13 countries, and similar for both sectors in 8 countries. Mexico displays the largest variation among OECD countries with 10 students more per teacher in public than in private institutions at this level. Among partner countries, the highest difference is observed in South Africa, with 14 more students per teacher in public than in private upper secondary institutions (Figure D2.2).

1. Upper secondary includes programmes outside upper secondary level - see Annex 3 for further details.
Countries are ranked in descending order of the ratio of students to teaching staff in public institutions.
Source: OECD/UIS/Eurostat (2020), Table D2.2. See Source section for more information and Annex 3 for notes (https://doi.org/10.1787/69096873-en).
Although on average across OECD countries the difference between the student-teacher ratio in public and private institutions tends be the same at lower and upper secondary level, the range of variation differs across countries. In about 40% of OECD countries with data, there are larger variations in the student-teacher ratio between public and private institutions at upper secondary level than at lower secondary. For example, although the student-teacher ratio at lower secondary level is the same for public and private institutions in both Denmark and Italy, at upper secondary level, Denmark has seven more students per teacher in public institutions than in private ones and Italy has four more. In other countries, the difference narrows at upper secondary level: while Mexico has 22 more students per teacher in public institutions than in private ones at lower secondary level, the difference falls to 9 at upper secondary level. Finally, in some countries, the situation is reversed. In Japan, the student-teacher ratio is larger in public institutions than private ones at lower secondary level, but it is the other way around at upper secondary. This mixed pattern in upper secondary education may, in part, reflect differences in the types of programmes offered in public and private institutions. For instance, in Norway, few private schools offer vocational programmes, which have a slightly lower student-teacher ratio than general programmes. In addition, in a number of countries, the provision of private education increases in upper secondary education, which may also influence the student-teacher ratio at this level (Table D2.2and Figure D2.2).
Class size, as presented in Table D2.3, is defined as the number of students who are following a common course of study, based on the highest number of common courses (usually compulsory studies), and excluding teaching in subgroups. The calculation is made by dividing the number of students by the number of classes. The student-teacher ratio, as presented in Table D2.1 and Table D2.2, is calculated by dividing the number of full-time equivalent students by the number of full-time equivalent teachers at a given level of education.
The two indicators therefore measure very different characteristics of the educational system. Student-teacher ratios provide information on the level of teaching resources available in a country relative to its student population, whereas class sizes measure the average number of students that are grouped together in a classroom.
Given the difference between student-teacher ratios and average class sizes, it is possible for countries with similar student-teacher ratios to have different class sizes. For example, at the primary level, Israel and the United States have similar ratios of students to teaching staff (15 students per teacher), but the average class size differs substantially (21 students per class in the United States and 26 in Israel). This may be explained by the fact that teaching hours in the United States are considerably longer than in Israel, meaning that American teachers can teach more classes during the day and thus students can be taught in smaller classes (see Indicator D4).
Class size
Average class size in primary and lower secondary education
The indicator on class size is limited to primary and lower secondary education. Class sizes are difficult to define and compare at higher levels, as students are often split into several different classes at these levels, depending on the subject area.
At the primary level, the average class in OECD countries has 21 pupils. There are fewer than 25 pupils per class in all the countries with available data, with the exception of Chile, Israel, Japan, and the United Kingdom. At the lower secondary level, the average class in OECD countries has 23 students. Among all countries with available data, the number varies from fewer than 20 students per class in Estonia, Finland, Latvia, Lithuania, the Russian Federation and the Slovak Republic to 30 students or more per class in Chile, Colombia, Costa Rica and Japan (Table D2.3).
The number of students per class tends to increase between primary and lower secondary education, although to a varying extent across countries. In Costa Rica, this increase corresponds to 18 students, the highest difference across OECD countries. On the other hand, in the United Kingdom and, to a lesser extent, Australia, Chile, Finland, Hungary, Latvia and the Russian Federation, the number of students per class falls between these two levels of education (Table D2.3).
The COVID-19 global crisis has led to full school closures in most OECD countries. When and how to reopen is one of the toughest and most sensitive decisions now on political agendas. Unquestionably, the largest factor driving the decision is the stage and spread of the disease, and the likelihood of a second wave of infections, all of which vary significantly across countries. Some countries, such as Ireland, Italy, Lithuania, and Spain, have been reluctant to allow students to go back to school before the start of the 2020-2021 academic year, preferring to ensure pedagogical continuity through online learning. While some countries have decided to keep schools closed for the remainder of the 2019-2020 academic year, other countries have progressively started reopening their classroom doors. However, reopening in the midst of a health crisis will require a careful assessment of the hygiene and sanitary measures in place to protect students and staff from the risks of transmission.
The response to school reopening has been evaluated based on the scientific evidence regarding the spread of the disease and its containment. Most countries have engaged in a gradual and phased reopening of schools to allow preventive measures to be effectively implemented. Many, such as Denmark, France, the Netherlands, and Norway, have prioritised lower levels of education, due to their importance in the cognitive development of children, and to the difficulty in engaging with young children in an online format. In contrast, countries such as Greece, Iceland, Korea or Portugal have prioritised upper secondary over primary levels (see Box D1.2) (Schleicher and Remiers, 2020[8]) (OECD, 2020[9]).
However, school reopening is contingent on a number of preventive measures which schools have been instructed to implement to contain the spread of the disease. Among others, social distancing has proven to be one of the most effective. Within a school context, this means reducing contact between groups of children and maintaining a safe distance of 1-2 metres between pupils and staff. In some countries, the safety distance depends on the level of containment of the virus achieved. For example, schools in less-affected areas in Japan (Level 1) are required to maintain a distance of 1 metre while those in more-affected ones (Levels 2 or 3) maintain a distance of 1-2 metres (MEXT, 2020[10]). Guidance in many countries has been to reduce or halve the size of the classes in order to maintain the required safety distance between students. Some countries have specified the maximum number of students allowed in the classroom at any given time. For example, France and the United Kingdom have recommended a limit of 15 students in primary classes, provided the safety distances are maintained (Ministère de l’Education Nationale et de la Jeunesse, 2020[11]; Department for Education, 2020[12]).
Countries with smaller class sizes will find it easier to comply with new restrictions on social distancing. Although France and the United Kingdom recommend the same limit on the number of children per primary class, public institutions in France have a smaller class size with 23 students, than the United Kingdom with 27 students per class. As class size tends to increase with education level, social distancing in the classroom will be more challenging at secondary level. With more than 30 students per class in lower secondary level, countries such as Chile, Colombia and Japan will face more difficulties in reorganising classes into smaller groups of students in order to maintain a safe distance between desks. However, reducing class size will also depend on other factors such as classroom size, room availability, staff availability and personal decisions from pupils and staff on when to return to schools.
While returning to school is compulsory in most OECD countries for students in permitted age groups or specific levels of education (except for sick students or those with a vulnerable or sick family member), attendance is optional in countries such as Canada, the Czech Republic, France, and Spain, with remote and online learning for students who wish to stay at home. These hybrid measures aim to secure support for the reopening of schools while optimising their capacity for social distancing (Schleicher and Remiers, 2020[8]).
To ensure all students have the opportunity to benefit from face-to-face teaching in a context of reduced class sizes, schools in about 60% of OECD member and partner countries are organising shifts to alternate students throughout the day when they cannot accommodate them all on site (Schleicher and Remiers, 2020[8]). The direct consequence of this measure will be reduced classroom instruction time compared to before school closures (see Box D1.2). Distance learning has therefore remained in place until the end of the academic year to continue to support students, including for those who have opted not to or cannot attend class for sanitary or personal health reasons.
Class size in public and private institutions
Class size is one factor that parents may consider when deciding on a school for their children, particularly at lower levels of education. Hence, the difference in average class size between public and private schools (and between different types of private institutions) could influence enrolment in different types of institutions.
Differences in class sizes between public and private institutions are similar to those observed for student-teacher ratios. On average across OECD countries, class sizes do not differ between public and private institutions by more than one student per class in both primary and lower secondary education. However, in some countries (including Brazil, Colombia, the Czech Republic, Latvia, Poland, and the Russian Federation), the average class in public primary schools has more than six additional students compared to the average class in private schools (Table D2.3). However, with the exception of Brazil and Colombia, the private sector is relatively small in all of these countries, representing at most 6% of students at the primary level (OECD, 2019[13]). In contrast, in Chile, Greece and Korea, the average primary class in private institutions is larger than in public institutions by at least four students (Figure D2.3).
At the lower secondary level, where private institutions are more prevalent, the comparison of class size between public and private institutions shows even larger variations. For example, in Costa Rica, there are on average 15 students less per class in private institutions than in public ones. The average class in private lower secondary institutions is larger than in public institutions in 8 countries, smaller in 17 countries and the same in 7 countries (Figure D2.3).
Trends in average class size
Between 2005 and 2018, class sizes have fallen at primary level and lower secondary level on average across OECD countries. At primary level, while class size decreased by 2% on average, there are strong differences among countries. About half of countries experienced an increase between 2005 and 2018, with Mexico and the Russian Federation displaying the most notable increases of 21% and 29% respectively. In contrast, primary class sizes in Korea decreased by almost 30% over the same period, the highest decline over the same period across countries with data. At the lower secondary level, the average class size fell by 7% between 2005 and 2018. This average masks considerably larger changes in individual countries. In Greece and Korea, for example, the average class size in lower secondary education has decreased by about 20-25% over the past decade whereas it increased by 3% or more in France, and Spain (Table D2.3).
Changes in class size may reflect efforts to balance the supply of teachers with changes in the student population. Countries with lower than average class sizes may see an increasing trend. For example, small class sizes in Lithuania results from both a high concentration of teachers in the active population and a declining student base (Shewbridge et al., 2016[14]). As a result, primary class size has increased by 17% between 2005 and 2018 as new recruits to the teaching profession are limited. In 2018, only 5% of primary teachers were under the age of 30, one of the lowest across OECD countries. In contrast, countries such as Chile and Korea with higher than average primary class sizes have both seen a notable decline between 2005 and 2018 (Table D2.3). In Chile, this is likely due to a rise in primary teacher numbers, which increased by more than 10% since 2014. In contrast, in Korea, declining student numbers has likely contributed to the fall in class size (OECD, 2019[13]).
Class size, along with instruction time and teaching time, determines the number of teachers an education system requires. It is therefore an important parameter in understanding the level of expenditure allocated to staff compensation in education. Countries make different choices when investing their resources which affect the salary cost of teachers per student (Box D2.3).
Countries are ranked in descending order of the average class size at the primary level.
Source: OECD/UIS/Eurostat (2020), Table D2.3. See Source section for more information and Annex 3 for notes (https://doi.org/10.1787/69096873-en).
The salary cost of teachers per student is determined by four factors: teachers’ salaries, instruction time, teaching time and theoretical class sizes. The impact of the first factor is direct: higher salaries lead to higher salary costs. The other three factors affect the salary cost by changing the number of teachers needed, assuming that the number of students enrolled is constant. If instruction time increases or teaching time decreases, more teachers must be hired to keep class sizes constant. Similarly, more teachers must be hired in order to reduce class sizes while keeping everything else constant.

Notes: See Table D2.5, available on line, for notes on each factor.
1. Teachers' statutory salaries after 10 years of experience instead of 15 years.
2. Teachers' statutory salaries at the start of their career instead of after 15 years of experience.
Countries and economies are ranked in descending order of the difference between the salary cost of teachers per student and the OECD average.
Source: OECD (2020), Table D2.4, available on line. See Source section for more information and Annex 3 for notes (https://doi.org/10.1787/69096873-en).
When comparing a country’s salary cost to the OECD average, it is possible to determine the contribution of each of the four factors. For instance, it is possible to assess whether a given salary cost is above average because of higher salaries, higher instruction time, lower teaching time, smaller class sizes or a combination of these four factors. Changes to one of these factors may require compensating trade-offs among the other factors in order to keep the total salary cost constant.
Figure D2.4 shows the wide variety of combinations of the four factors across countries and their different effects on the salary cost of teachers. The size of the contribution of each factor compared to the OECD average depends on the difference between the factor itself and the relevant OECD average. The sum of each factor’s contribution equals the difference in salary cost between that country and the OECD average. For example, in Poland, the salary cost of primary teachers per student is USD 192 below the OECD average. Poland has smaller estimated class sizes (+ USD 975) and shorter teaching time (+ USD 953) than the OECD average, both of which push the salary cost of teachers up. However, this is more than compensated for by below-average teachers' salaries (- USD 1 357) and below-average instruction time (- USD 762), which push the cost down (Figure D2.4).
The analysis highlights different policies at primary level across countries with similar spending. For example, the teacher salary costs per student in Greece and Japan are very similar (about 3 000 USD), but how they allocate their resources differ substantially. Japan spends more than OECD countries on average on primary teachers’ salaries and primary teachers have slightly shorter teaching hours than on average across countries. It compensates for these costs with larger than average class sizes, and shorter students’ instruction time. In contrast, class sizes in Greece are significantly smaller than the average. Greece compensates for the higher cost of smaller classes with below-average teachers’ salaries at this level (Figure D2.4).
There are two categories of instructional personnel (teachers):
Teachers’ aides and teaching/research assistants include non-professional personnel or students who support teachers in providing instruction to students.
Teaching staff refers to professional personnel directly involved in teaching to students. The classification includes classroom teachers, special-education teachers and other teachers who work with a whole class of students in a classroom, in small groups in a resource room, or in one-to-one teaching situations inside or outside a regular class. Teaching staff also include departmental chairs whose duties include some teaching, but exclude non-professional personnel who support teachers in providing instruction to students, such as teachers’ aides and other paraprofessional personnel.
Class size is calculated by dividing the number of students enrolled by the number of classes. In order to ensure comparability among countries, special-needs programmes are excluded. Data include only regular programmes at primary and lower secondary levels of education, and exclude teaching in subgroups outside the regular classroom setting.
The ratio of students to teaching staff is obtained by dividing the number of full-time equivalent students at a given level of education by the number of full-time equivalent teachers at that level and in similar types of institutions. At tertiary level, the student-teacher ratio is calculated using data on academic staff instead of teachers.
For the ratio of students to teachers to be meaningful, consistent coverage of personnel and enrolment data are needed. For instance, if teachers in religious schools are not reported in the personnel data, then students in those schools must also be excluded.
For more information, please see the OECD Handbook for Internationally Comparative Education Statistics 2018 (OECD, 2018[15]) and Annex 3 for country-specific notes (https://doi.org/10.1787/69096873-en).
Data refer to the academic year 2017/18 and are based on the UNESCO-UIS/OECD/EUROSTAT data collection on education statistics administered by the OECD in 2019 (for details, see Annex 3 at https://doi.org/10.1787/69096873-en).
References
[12] Department for Education (2020), Coronavirus (COVID-19): Implementing protective measures in education and childcare settings, GOV.UK website, https://www.gov.uk/government/publications/coronavirus-covid-19-implementing-protective-measures-in-education-and-childcare-settings (accessed on 20 May 2020).
[2] Fredriksson, P., B. Öckert and H. Oosterbeek (2013), “Long-term effects of class size”, Quarterly Journal of Economics, Vol. 128/1, pp. 249-285, https://doi.org/10.1093/qje/qjs048.
[6] Hoeckel, K. (2008), Costs and Benefits in Vocational Education and Training, OECD, Paris, https://www.oecd.org/education/skills-beyond-school/41538706.pdf (accessed on 26 May 2020).
[7] Klein, S. (2001), Financing Vocational Education: A State Policymaker’s Guide, RTI International, http://www.rti.org/sites/default/files/resources/financing_vocational_education.pdf.
[10] MEXT (2020), Gakkou niokeru shingata coronavirus kansenshou nikansuru eiseikanri manual - Gakkou no atarashii seikatsu youshiki [COVID-19 hygiene management at schools - New lifestyle at schools], Ministry of Education, Culture, Sports, Science and Technology, Japan, https://www.mext.go.jp/content/20200522_mxt_kouhou02_mext_00029_01.pdf (accessed on 25 May 2020).
[11] Ministère de l’Education Nationale et de la Jeunesse (2020), Réouverture des écoles et des établissements scolaires [Reopening of schools and educational establishments], Ministère de l’Education Nationale et de la Jeunesse, France, https://www.education.gouv.fr/bo/20/Hebdo19/MENE2011220C.htm (accessed on 20 May 2020).
[9] OECD (2020), Key country policy responses, https://oecd.github.io/OECD-covid-action-map/data/CoronavirusUpdate_AllCountries_Public.xlsx (accessed on 30 June 2020).
[13] OECD (2019), Education at a Glance Database, https://stats.oecd.org/ (accessed on 6 July 2018).
[4] OECD (2019), Working and Learning Together: Rethinking Human Resource Policies for Schools, OECD Reviews of School Resources, OECD Publishing, Paris, https://dx.doi.org/10.1787/b7aaf050-en.
[15] OECD (2018), OECD Handbook for Internationally Comparative Education Statistics 2018: Concepts, Standards, Definitions and Classifications, OECD Publishing, Paris, https://doi.org/10.1787/9789264304444-en.
[5] OECD (2017), Education at a Glance 2017: OECD Indicators, OECD Publishing, Paris, https://doi.org/10.1787/eag-2017-en.
[3] OECD (2016), PISA 2015 Results (Volume II): Policies and Practices for Successful Schools, PISA, OECD Publishing, Paris, https://doi.org/10.1787/9789264267510-en.
[1] Piketty, T. and M. Valenaire (2006), “L’impact de la taille des classes sur la réussite scolaire dans les écoles, collèges et lycées français”, Les Dossiers: Enseignement scolaire, Vol. 173.
[8] Schleicher, A. and F. Remiers (2020), Schooling disrupted schooling rethought :How the Covid-19 pandemic is changing education, https://read.oecd-ilibrary.org/view/?ref=133_133390-1rtuknc0hi&title=Schooling-disrupted-schooling-rethought-How-the-Covid-19-pandemic-is-changing-education (accessed on 3 June 2020).
[14] Shewbridge, C. et al. (2016), OECD Reviews of School Resources: Lithuania 2016, OECD Reviews of School Resources, OECD Publishing, Paris, https://dx.doi.org/10.1787/9789264252547-en.
Table D2.1 Ratio of students to teaching staff in educational institutions, by level of education (2018)
Table D2.2 Ratio of students to teaching staff, by type of institution (2018)
Table D2.3 Average class size, by type of institution (2018) and index of change between 2005 and 2018
WEB Table D2.4 Contribution of various factors to salary cost of teachers per student in primary education (2018)
WEB Table D2.5 Factors used to compute the salary cost of teachers per student in public institutions, in primary education (2018)
Cut-off date for the data: 19 July 2020. Any updates on data can be found on line at https://doi.org/10.1787/eag-data-en. More breakdowns can also be found at http://stats.oecd.org/, Education at a Glance Database.
StatLink: https://doi.org/10.1787/888934165320
Table D2.1. Ratio of students to teaching staff in educational institutions, by level of education (2018) |
|---|
Calculations based on full-time equivalents |
 |
2. For Ireland and Switzerland, public institutions only for all levels. For Israel, public institutions only for lower secondary, upper secondary education and all secondary. |
3. Upper secondary education includes a part of post-secondary non-tertiary education. |
Source: OECD/UIS/Eurostat (2020). See Source section for more information and Annex 3 for notes (https://doi.org/10.1787/69096873-en). Please refer to the Reader's Guide for information concerning symbols for missing data and abbreviations. |
Table D2.2. Ratio of students to teaching staff, by type of institution (2018) |
|---|
By level of education, calculations based on full-time equivalents |
 |
1. Includes only general programmes in lower and upper secondary education. |
2. Upper secondary includes programmes outside upper secondary level - see Annex 3 for further details. |
Source: OECD/UIS/Eurostat (2020). See Source section for more information and Annex 3 for notes (https://doi.org/10.1787/69096873-en). Please refer to the Reader's Guide for information concerning symbols for missing data and abbreviations. |
Table D2.3. Average class size, by type of institution (2018) and index of change between 2005 and 2018 |
|---|
By level of education, calculations based on number of students and number of classes |
--TableD2_3.png) |
Source: OECD/UIS/Eurostat (2020). See Source section for more information and Annex 3 for notes (https://doi.org/10.1787/69096873-en). Please refer to the Reader's Guide for information concerning symbols for missing data and abbreviations. |