
Measuring distance to the SDG targets – Mexico
Mexico has already achieved 16 of the 122 SDG targets for which for which comparable data are available and, based on most recent trends, it is expected to meet 5 additional targets by 2030 (Figure 1). As virtually all OECD countries, Mexico has already met (or is close to meeting) most targets related to securing basic needs and implementing the policy tools and frameworks mentioned in the 2030 Agenda (see details in Table 1). Yet, on some aspects, Mexico remains further away from meeting the targets of the 2030 Agenda than most OECD countries.
This country profile provides a high-level overview of some of Mexico’s strengths and challenges in performance across the SDG Targets, and as such differs from Voluntary National Reviews (VNRs) or other reporting processes. To ensure international comparability, this assessment builds on the global indicator framework and relies on data sourced from the SDG Global Database and OECD databases. VNRs typically use national indicators that reflect national circumstances and are more up-to-date (See section How to read this country profile that provides some methodological details on country profiles).

Source: All data is taken and adapted from UNDESA (2021), SDG Global Database, https://unstats.un.org/sdgs/unsdg and OECD (2021), OECD.Stat, https://stats.oecd.org/ (accessed on 29 October 2021).
As most OECD countries, Mexico has met targets aiming at securing decent living standards for its population. Mexico’s distance is nil or very small (and likely to be nil by 2030) when it comes to eradicating extreme poverty (Target 1.1). Mexico has reduced maternal and infant mortality (Targets 3.1 and 3.2), increased access to early childhood education (4.2) and developed key statistical capacities (17.18 and 17.19). Yet, Mexico remains further away from targets compared to other OECD countries on providing access to some basic amenities including sanitation (Targets 1.4 and 6.2), freshwater (6.1), energy (7.1) and modern education facilities (4.a) to all residents.
Some risk factors to health are low in Mexico. Tobacco consumption is half the OECD average, with less than one tenth of adults classified as daily smokers in 2017 (Target 3.a). Mexico also meets Target 3.5 on substance abuse. Available data suggest that alcohol consumption per capita is among the lowest of the OECD, with only 4 litres of pure alcohol per adult in 2016. Harmful drinking patterns, which account for an important share of the burden of disease in OECD countries, is low, with only 2% of the population suffering from disorders attributable to the consumption of alcohol (Target 3.5). Yet, malnutrition (Target 2.2) and poor air quality (Target 1.6) weigh heavily on population health.
On the “Planet” category, Mexico does relatively well on many policy indicators. To mitigate the impact of extreme events, Mexico had implemented disaster risk reduction strategies in line with Sendai Framework at both local and national levels (Targets 1.5, 11.b and 13.1). Mexico also implemented some policy measures and instruments relating to the sustainability of consumption and production (Target 12.2), the preservation of terrestrial biodiversity (Target 15.8) and to the management of fish stocks (Targets 14.4 and 14.b). While Mexico needs to make progress on the protection of terrestrial ecosystems (Targets 15.1, 15.2 and 15.4), it is close to target level when it comes to protecting marine ecosystems (Target 14.5). Finally, when it come to the monitoring of environmental outcomes, Mexico had been pioneering ecosystem accounting since the early 1990s and already meets targets on this front (Targets 12.b and 15.9).
Education outcomes are low. While Mexico has met Target 4.2 on pre-primary education, students' education outcomes at the end of secondary schooling remain poor. Only 44% of 15-year-olds achieved PISA level 2 in mathematics in 2018 (Target 4.1) and differences in socio-economic background, gender, immigration status and location contribute to large disparities in education outcomes (Target 4.5). In addition, nearly half of adults lack a basic proficiency in numeracy and literacy (Target 4.6) while the participation rate in lifelong learning is only around 30% (Target 4.3).
Tackling unequal opportunities for vulnerable populations and women requires further efforts. While gender parity laws at the federal level require that women hold half the seats in the national parliaments (Target 5.5), gender differences remain large. Women also bear the lion share of unpaid care and housework (Target 5.4) and violence against women appears to be widespread: one in ten ever-partnered women experienced violence by a current or former partner in 2018 (Target 5.2). Adolescent fertility rate is among the highest in the OECD area (Target 3.7). Beyond gender disparities, Mexico reports the highest levels of income poverty and inequality (Targets 1.2, 10.1 and 10.2) while redistribution through taxes and transfers is among the lowest in the OECD (Target 10.4). Yet, Mexico is also one of the very few OECD members where trends on that front have been in the right direction. Yet, the gap in material living standards with the rest of the OECD widened, mainly because of Mexico’s low productivity (Target 8.2).
Mexico has a rich natural asset base, and production and consumption patterns are less energy- and material-intensive than in many OECD economies. Yet, this gap is narrowing and rapid urbanisation (Goal 11), population growth and higher income per capita are generating a range of environmental pressures. Despite the important steps taken to address these challenges (see Main strengths), the costs of environmental degradation and natural resource use are high. The economic impact of natural disasters is significant (Target 11.5). Degraded land area accounts for nearly half of the total land in Mexico (Target 15.3) and – as in most OECD countries – Mexico’s greenhouse gas emissions per unit of GDP remains high (Target 13.2) while biodiversity is declining (Target 15.5).
Mexico is also far away from many targets for Goal 16 on peace. Deaths from assaults are widespread; with 27 deaths per 100 000 population in 2018 this indicator is nine times the OECD average (Target 16.1). In 2018, 18% of firms experienced at least one request to pay bribes (Target 16.5) while 65% of the citizens do not trust the judicial system (Target 16.6). On rule of law (Target 16.3), data shows that reporting of robbery to the police is low (12% in 2018, compared to the OECD average of 46%) while unsentenced detention is high (34% of prisoners were still waiting a sentence in 2018).
Like in many other OECD countries, data availability remains a challenge when measuring distances to targets (see the Overview chapter for details). For Mexico, available data on the level of the different indicators allow covering 122 of the 169 targets. As shown in Figure 2 below, indicator coverage is uneven across the 17 goals. While four goals (Goals 1 on poverty, 3 on health, 4 education and 12 on consumption and production) have most of their targets covered (the indicator coverage exceeds 80%), coverage is lower for five goals (Goals 7 on energy, 11 on cities, 13 on climate action, 14 on life below water and 17 on partnerships) with 60% or less of their targets covered. Data gaps become starker when focusing on performance indicators, i.e. excluding those providing contextual information. In this case, coverage exceeds 80% for only Goal 3 on health and Goal 4 on education. For eight goals, mostly related to the Planet category (Goals 12, 13, 14 and 15) but also to education, gender equality, cities and partnerships (Goals 4, 5, 11 and 17), available data do not allow monitoring changes over time for more than two in three targets.
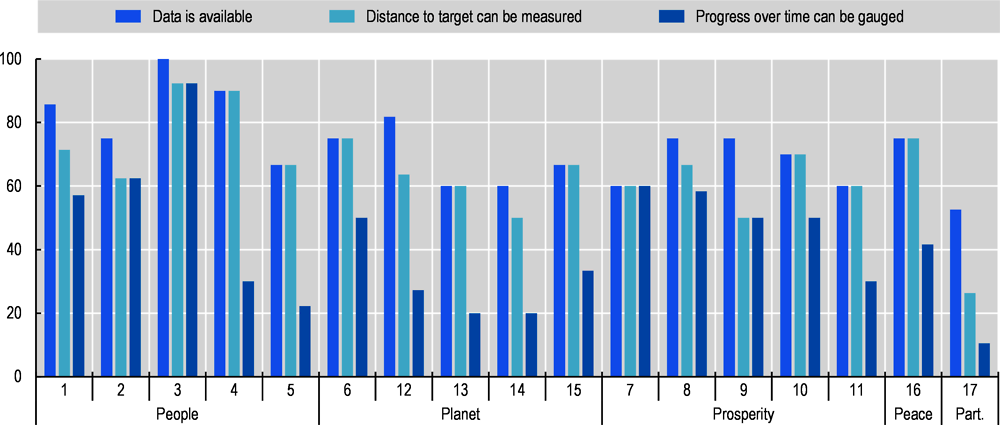
Note: The figure represents Mexico's share of targets covered by at least one indicator for each SDG. . Numbers from 1 to 17 stand for the goals: 1 No poverty, 2 Zero hunger, 3 Good health and well-being, 4 Quality education, 5 Gender equality, 6 Clean water and sanitation, 7 Affordable and clean energy, 8 Decent work and economic growth, 9 Industry, innovation and infrastructure, 10 Reduced inequalities, 11 Sustainable cities and communities, 12 Responsible consumption and production, 13 Climate action, 14 Life below water, 15 Life on land, 16 Peace, justice and strong institutions and 17 Partnerships for the goals. These goals are grouped under five broad themes (the “5Ps”): People, Planet, Prosperity, Peace and Partnership. Beyond data availability, other statistical gaps such as timeliness or granularity also need to be considered. For instance, given the lag in available data, the effects of the pandemic on current distance and trajectories may not be reflected in the estimates.
Source: All data is taken and adapted from UNDESA (2021), SDG Global Database, https://unstats.un.org/sdgs/unsdg and OECD (2021), OECD.Stat, https://stats.oecd.org/ (accessed on 29 October 2021).
While some SDG Targets are, on average, close to being met, performance is very uneven across the 17 Goals of the 2030 Agenda for Sustainable Development. Table 1 presents an overview of Mexico’s progress towards targets based on available data for each of the 17 Goals. It shows that distances to Targets and trends over time differ significantly even when considering a specific goal.
The OECD report The Short and Winding Road to 2030: Measuring Distance to the SDG Targets evaluates the distance that OECD countries need to travel to meet SDG targets for which data are currently available. It also looks at whether countries have been moving towards or away from these targets, and how likely they are to meet their commitments by 2030, based on an analysis of recent trends and the observed volatility in the different indicators.
As most authors and international organisations, this report adopts a rather simple geometric growth model for assessing the direction and pace of recent changes in the context of the SDGs. Yet, instead of making direct estimates of the value of the indicator by 2030, it models the likelihood of achieving a specific level using Monte Carlo simulations.
While the report provides an overview of where OECD countries, taken as a whole, currently stand, country profiles provide details of the performance and data availability of individual OECD countries.
How to read the OECD SDG Wheel?
Progress on SDGs requires a granular understanding of countries’ strengths and weaknesses based on the consideration of the 169 targets of the 2030 Agenda. Figure 1 shows both current achievements (in the inner circle; the longer the bar, the smaller the distance remaining to be travelled) as well as whether OECD countries are on track (or are at least making progress) to meet their commitments by 2030 (in the outer circle).
The length of each bar shows current level of achievement on each target. As detailed in the Methodological Annex, countries’ distance to target is measured as the “standardised difference” between a country’s current position and the target end-value. For each indicator, the standardised measurement unit (s.u.) is the standard deviation observed among OECD countries in the reference year (i.e. the year closest to 2015). Therefore, the longer the bar, the shorter the distance still to be travelled to reach the target by 2030. The colours of the bars applied to the various targets refer to the goals they pertain to.
The outer ring shows how OECD countries are performing over time and how likely they are to meet the different targets by 2030 based on the observed trends of the various indicators. It uses stoplight colours to classify the progress towards the target:
green is used to indicate those countries that (based on the change in the different indicators over a recent period) should meet the target in 2030 just by maintaining their current pace of progress (i.e. more than 75% of (randomised) projections meet the target);
yellow for those countries whose current pace of progress is insufficient to meet the target by 2030 (i.e. less than 75% of randomised projections meet the target, while the correlation coefficient between the indicator and the year is high and statistically significant, implying that a significant trend could be detected); and
red for those countries whose recent changes have been stagnating or moving them further away from the target (i.e. less than 75% of randomised projections meet the target and the correlation coefficient between the indicator and the year is low or statistically insignificant, implying that no statistical trend could be identified).
How to read the Strength and Challenges sections?
With the aim of helping its member countries in navigating the 2030 Agenda and in setting their own priorities for action, this report relies on a unique methodology for measuring the distance that OECD countries have to travel to achieve SDG targets. The identification of the main strengths and challenges proposed in this report relies on current performances only:
A target is considered to be a strength when the distance to the target end-value is lower than 0.5 s.u. (i.e. the distance is deemed to be small) or when the country is closer to the target than the OECD average. For instance, while Korea's distance to Target 2.2 on malnutrition is 1.4 s.u. (i.e. classified as medium distance), the average OECD distance is 2.5 s.u. Therefore, Target 2.2 is categorised as being a strength for Korea.
A target is considered to be a challenge when the distance to target is greater than 1.5 s.u. (i.e. distance is deemed to be long) or when the country is further away from the target than the OECD average. For instance, Estonia's distance to Target 4.2 on pre-primary education is 1.1 s.u. (i.e. medium distance), which is higher than the 0.24 s.u. distance for the OECD average. Target 4.2 is therefore classified as a weakness for Estonia.
While the lack of consistent time series often prevents an exhaustive assessment of trends, they are discussed when available and relevant in nuancing the assessment of current performance.
How to read the Statistical Gaps section?
In total, this report relies on 537 data series supporting 183 of the 247 indicators listed in the global indicator framework (or for close proxies of these indicators). These indicators cover 134 of the 169 SDG targets. Yet, target coverage is uneven across the 17 goals and among OECD member countries.
Figure 2 summarises data availability:
darker blue bars indicate the share of targets for which at least one indicator (including indicators providing context information) is available
lighter blue bars indicate the share of targets for which the available indicator(s) include those having a clear normative direction (i.e. allowing to distinguish between good and bad performance), which are the only ones used to measure distances to target levels.
medium blue bars indicate the share of targets for which progress over time can be gauged (i.e. at least three observations are available over a five-year period).
All methods and concepts are further detailed in the Methodological Annex.