
copy the linklink copied!Chapter 2. Trends in materials consumption and waste generation
This chapter provides an overview of key trends across OECD countries, with some further details on the 11 focus countries. The chapter presents the most recent cross-country statistics available. It should be noted that data limitations create a challenge in comparing cross-country data on material consumption and waste.
“The statistical data for Israel are supplied by and under the responsibility of the relevant Israeli authorities. The use of such data by the OECD is without prejudice to the status of the Golan Heights, East Jerusalem and Israeli settlements in the West Bank under the terms of international law.
This chapter provides an overview of key trends across OECD countries, with some further details on the 11 focus countries. The chapter presents the most recent cross-country statistics available. It should be noted that data limitations create a challenge in comparing cross-country data on material consumption and waste (OECD, 2008a).
copy the linklink copied!2.1. Economic and social context
Income levels play a role in terms of the levels of material consumption and waste generation and the approach to waste treatment. In general, as economies industrialise and incomes rise, material consumption and waste disposal (OECD, 2008b) levels tend to rise. Other key determinants include economic structure – in service-based economies, levels of mining and industrial waste will be relatively low – as well as demographic factors. An increase (or decrease) in population will drive higher waste levels. So will factors such as the number of single-person households, which has risen in many OECD countries: private material consumption and waste generation are likely to increase alongside. However, when income levels reach certain threshold levels, there is evidence to suggest a positive impact on behaviours related to material consumption and waste generation, particularly when effective policy measures are in place. Notably, per capita consumption has been observed to stabilise when incomes reach a certain level as economies move to less material-intensive, more service-based profiles.
When measured at purchasing power parties, the income per capita in OECD countries ranged from about USD 20 000 to over USD 100 000. The 11 focus countries include four countries with per capita incomes below USD 30 000: Colombia, whose accession to OECD is under discussion; Estonia; Hungary, and Poland. Two other countries, Netherlands and Norway, had a per capita income over USD 50 000 (Table 2.1).
Population levels and density may also affect waste management approaches. For example, densely populated countries, such as the Netherlands or Japan, will have less space for landfill sites as well as other waste treatment facilities and may face greater obstacles due to local concerns about siting decisions. At the same time, recycling of municipal waste may also be more challenging in crowded urban areas, if households do not have sufficient space for the separation of waste. In areas where population density is low, it may be challenging to ensure wide coverage of waste collection services at an acceptable cost. In 2016, the population of the 11 focus countries varied from 1.3 million in Estonia to 127.5 million in Japan (Table 2.1). Population density also varied: Estonia and Norway are the most sparsely populated, while Israel, Japan, Korea and the Netherlands had more than 350 persons per square kilometre.
The overall economic structure also varies significantly across the focus countries (Box 2.1). For example, Colombia, Estonia, Norway and Poland have large extractive sectors that will lead to higher levels of mining waste. In contrast, the economies of Japan and the Netherlands are focused on services rather than industry, and have low levels of mining and industrial waste generation.
Colombia saw strong economic growth in the first decade of the century, driven by a commodity price boom, significant economic policy reform, and improved security. Yet extractive industries, livestock grazing, urbanisation and increased transport are creating increasing pressures on the environment.
Czech Republic saw strong economic growth over the last decade and a half. The country’s energy mix has been reliant on domestic coal resources, but energy from waste is now becoming more prominent in the energy mix. The economy is export-oriented and characterised by intensive industrial and agricultural activities.
Estonia has a small population, extensive forests, and significant water resources. Domestic oil shale is the main energy source, creating high resource use.
Hungary has relatively few raw materials and relies on energy and materials imports, with an economy less resource-intensive than other OECD countries. It is the largest electronics producer in Central and Eastern Europe.
Israel is a small, water-scarce, densely populated and highly urbanised territory. It has seen economic and population growth since 2000, which has intensified already significant pressures on the environment.
Japan is the second largest OECD economy and one of the OECD’s most efficient countries in terms of energy and domestic materials consumption, although since the 1990s it has been characterised by sluggish economic growth. With limited natural mineral resources, its strong manufacturing sector is heavily reliant on imports.
Korea has one of the fastest-growing economies in the OECD, driven by the large export-oriented manufacturing sector. This has led to high pollution and resource consumption, especially with coal a core part of the energy sector.
Norway has experienced relatively high economic growth, with oil and gas exploitation accounting for more than 20% of gross domestic product (GDP): the energy sector has intensified environmental pressures.
Poland saw steady economic growth since 2000 but it remains heavily reliant on coal, making it one of the more resource-intensive countries in the OECD.
Slovenia has experienced strong economic growth since its independence in 1991, which has put pressure on its rich environmental resources, with over 60% of the country covered by forests.
The Netherlands is a small, densely populated country with an open, resource-efficient economy focused on services.
Note: GDP at 2010 prices and purchasing power parities.
Source: OECD (2017), "Aggregate National Accounts, SNA 2008 (or SNA 1993): Gross domestic product", OECD National Accounts Statistics (database), https://doi.org/10.1787/data-00001-en.
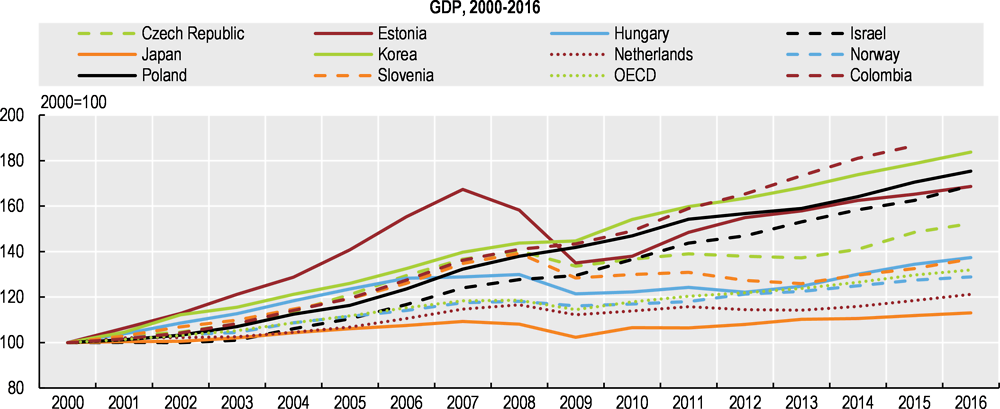
Between 2000 and 2016, economic growth in the 11 focus countries varied significantly (Figure 2.1). The global financial crisis and recession affected all countries, with Estonia and Slovenia among those experiencing the sharpest falls in GDP. Despite the crisis, Colombia, Estonia, Israel, Korea and Poland all saw increases in GDP (at constant purchasing power parities) greater than 60% over this period, while the Czech Republic saw increases of just over 50%. Total growth in GDP was below 40% for the other five countries. The crisis affected materials consumption and productivity, as well as waste generation, though its influence varied across the countries, as described in Sections 2.2 and 2.3.
copy the linklink copied!2.2. Material consumption and productivity
Resource productivity refers to the effectiveness with which an economy or a production process is using natural resources. Material resources include energy carriers (gas, oil, coal), metal ores and metals, construction minerals and other minerals, soil and biomass. Material productivity makes reference to the effectiveness with which an economy or a production process is using materials extracted from natural resources: this can be presented as an indicator that reflects the output or value added per unit of materials used. This section presents domestic material consumption (DMC), an indicator assessed in the Environmental Performance Reviews, which measures the mass of materials physically used in the domestic economic system; it does not include materials used in other economies to produce imported goods.

Note: KOR: 2013 data for DMC productivity, 2010 data for DMC breakdown. Data refer to the indicated year or to the latest available year. They may include provisional figures and estimates. DMC equals the sum of domestic extraction of raw materials used by an economy and their physical trade balance (imports minus exports of raw materials and manufactured products). DMC productivity designates the amount of GDP generated per unit of materials used. GDP at 2010 prices and purchasing power parities. It should be born in mind that the data should be interpreted with caution and that the time series presented here may change in future as work on methodologies for Material Flow accounting progresses.
Source: Eurostat (2016), Material flows and resource productivity (database); OECD (2016), "Material resources", OECD Environment Statistics (database).
OECD countries with highest material productivity tend to be those whose economies are focused on services and high-value products, as seen for Japan and the Netherlands among the focus countries (Figure 2.2). Countries with economies more reliant on extracting material resources tend to have lower material productivity levels: among the focus countries, Estonia and Poland mine domestic fossil fuels, an important factor in their low material productivity levels; although data are not available for Colombia, this country also mines coal, which is an important export.
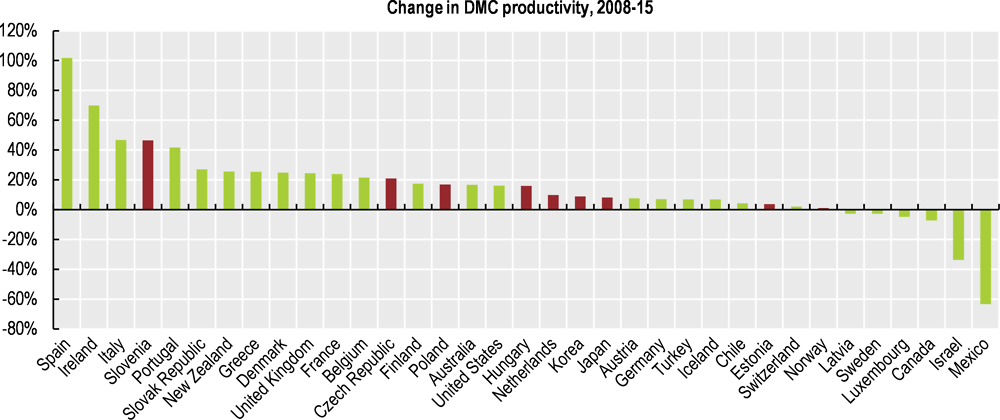
Most OECD countries saw an increase in material productivity, as measured by DMC productivity, between 2008 and 2015 (Figure 2.3). This period covers the global economic crisis and recovery (data are not available for many countries before 2008). The increase in material productivity suggests that the economic recovery has not been based on increased material consumption in most countries. This may indicate that, during the recovery, growth has been stronger in service-based sectors than in resource-intensive sectors such as construction and manufacturing. It should be underlined that data are available only for a relatively short period; moreover, material productivity is influenced by a broad range of factors, including economic cycles. Consequently, these trends can be difficult to interpret.
Note: KOR: 2013 data for DMC productivity, 2010 data for DMC breakdown. Data refer to the indicated year or to the latest available year. They may include provisional figures and estimates. DMC equals the sum of domestic extraction of raw materials used by an economy and their physical trade balance (imports minus exports of raw materials and manufactured products). DMC productivity designates the amount of GDP generated per unit of materials used. GDP at 2010 prices and purchasing power parities. It should be born in mind that the data should be interpreted with caution and that the time series presented here may change in future as work on methodologies for Material Flow accounting progresses.
Source: Eurostat (2016), Material flows and resource productivity (database); OECD (2016), "Material resources", OECD Environment Statistics (database).
Among the focus countries, material productivity increased by more than 40% between 2008 and 2015 in Slovenia. Productivity growth was also reasonably strong in the Czech Republic, Poland and Hungary during this period, while for Japan, Korea and the Netherlands, the growth was close to 10%. In Poland, for example, extraction of metal ores and fossil fuels grew more slowly in the review period (2000 to 2012) than the country’s fast-rising GDP, and it appears that this trend has continued in the period from 2008 to 2015, when material productivity rose by 17%. On the other hand, extraction of construction minerals grew more quickly than GDP, as investment in private buildings and public infrastructure rose. In several other focus countries, including Estonia and Korea, the consumption of construction minerals for buildings and infrastructure has grown. In Spain, on the other hand, a period of intense construction ended with the economic crisis. Decreases in material productivity were observed in only six OECD countries during the period. Israel, for example, experienced a 36% reduction in material productivity, due in part to rising domestic fossil fuels extraction.
copy the linklink copied!2.3. Waste generation and treatment11
This section provides an overview of data from the Environmental Performance Reviews on waste generation and treatment in OECD countries, with a focus on the 11 focus countries. Data is presented on primary waste generation, municipal solid waste (MSW) generation, and treatment of MSW. Data on the generation or treatment of other waste streams, such as industrial, construction or hazardous waste, are not presented here due to the absence of comprehensive time series data across countries.
2.3.1. Total primary waste generation
The generation of total primary waste also varies markedly across OECD countries (Figure 2.4), and this can be linked to several factors, including domestic materials consumption, GDP levels, and differing waste accounting methodologies. The levels of total primary waste generation per capita are high in Estonia, where large amounts of mining and industrial waste arise from the processing of oil shale, a low-grade solid fossil fuel. In Luxembourg, the highest per capita income OECD country, large amounts of waste arise in particular from construction activities (moreover, a high share of Luxembourg’s work force is made of cross-border commuters, so per capita statistics do not provide a good comparison with other countries). Other factors may play a role: in the Netherlands, an important share of total primary waste generation arises from dredging activities.

Note: Total waste exclude secondary waste (e.g. residues from treatment operations).
Source: OECD (2017), "Waste: Waste generation by sector", OECD Environment Statistics (database).
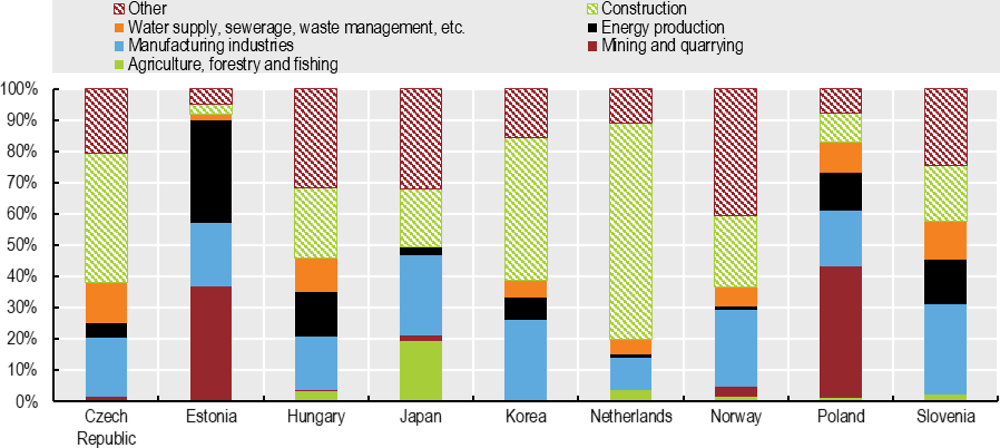
The composition of total primary waste generation varies in the focus countries (Figure 2.5). Mining and quarrying waste make up about 40% primary waste in Estonia and Poland, driven largely by the mining of domestic solid fuel. Mining and quarrying waste is also a major factor in in Colombia, whose coal exports doubled in the review period; moreover, oil and mining are seen as a key economic driver (data are not available for all waste streams in Colombia, however). In contrast, high proportions of construction waste were a feature in Korea and the Netherlands. Manufacturing generated about 25% or more of total primary waste in Korea, Norway and Slovenia. It should be noted that not all countries report waste generation by all economic sectors: these can affect the comparative levels of total primary waste generation (Figure 2.4).
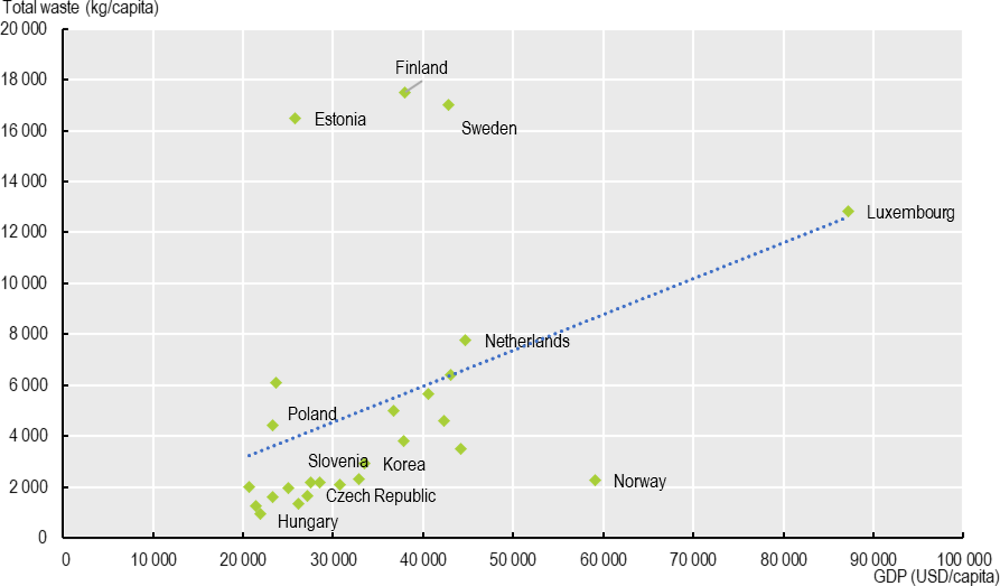
A comparison of primary waste and GDP (Figure 2.6) shows a rather weak correlation. While several high-income countries such as Luxembourg, Finland and Sweden have high primary waste generation per capita levels, other high-income countries (for example, Norway) have relatively low waste generation levels and some low-income countries (Estonia, Turkey) have high waste generation levels. The structure of key sectors, particularly the prominence of the construction and mining sectors in the economy, appear to be a more important factor. As noted for the other figures on total primary waste generation, some countries have not reported for all economic sectors, reducing the comparability of data available.
Note: Total waste exclude secondary waste (e.g. residues from treatment operations). Japan: 2013 data.
Source: OECD (2017), "Waste: Waste generation by sector", OECD Environment Statistics (database).
Note: Total waste exclude secondary waste (e.g. residues from treatment operations). GDP at constant prices and 2010 purchasing power parities. Correlation coefficient = 0.28.
Source: OECD (2017), "Waste: Waste generation by sector", OECD Environment Statistics (database), https://doi.org/10.1787/data-00674-en. OECD (2017), "GDP per capita and productivity levels", OECD Productivity Statistics (database), https://doi.org/10.1787/data-00686-en.
2.3.2. Municipal solid waste generation
The generation of MSW also varies across OECD countries (Figure 2.7). Poland has the lowest per capita generation of MSW among OECD countries, under 300 kg. Colombia – not yet an OECD member country – appears to have even lower per capita waste generation rates of around 200 kg per person, based on the most recent available data. Japan, Estonia, Hungary, the Czech Republic and Korea also had relatively low municipal waste generation rates in 2015, under 400 kg.

Note: * 2014 data. Data may include provisional figures and estimates. Household and similar waste collected by or for municipalities, originating mainly from households and small businesses. Includes bulky waste and separate collection.
Source: OECD (2017), "Waste: Municipal waste", OECD Environment Statistics (database). OECD (2017), Environmental Performance Reviews: Korea, https://doi.org/10.1787/data-00601-en.
Most OECD countries (14 of the 20 for which data was available) reduced the amount of municipal waste generated per capita between 2000 and 2015 (Figure 2.8). While often the Environmental Performance Reviews did not comment on the factors behind these decreases, insights were provided for some countries. In some cases, these decreases may be attributed in part to changes or uncertainties in the reporting of data (for example, Estonia, Poland). In other cases, decreases in MSW generation may be a result of policy measures. For example, the decrease observed in MSW generation were attributed to the introduction of volume-based pricing in Korea and broader waste reduction policies in the Netherlands. At least ten OECD countries experienced an increase in MSW generation per capita: among the focus countries, Norway saw an increase of almost 20% over this period, which was attributed to increased consumption in that country. Of the 11 focus countries, Israel has the highest per capita waste generation and experienced only a moderate reduction (-2%) during the 2000-15 period.
While several factors can influence MSWgeneration (including differences in definitions and measurement among countries), economic activity, particularly the level of private final consumption, has been a key element (Figure 2.9). This is not a rigid relationship: as described below, some OECD countries have decoupled GDP growth from increases in municipal waste generation.
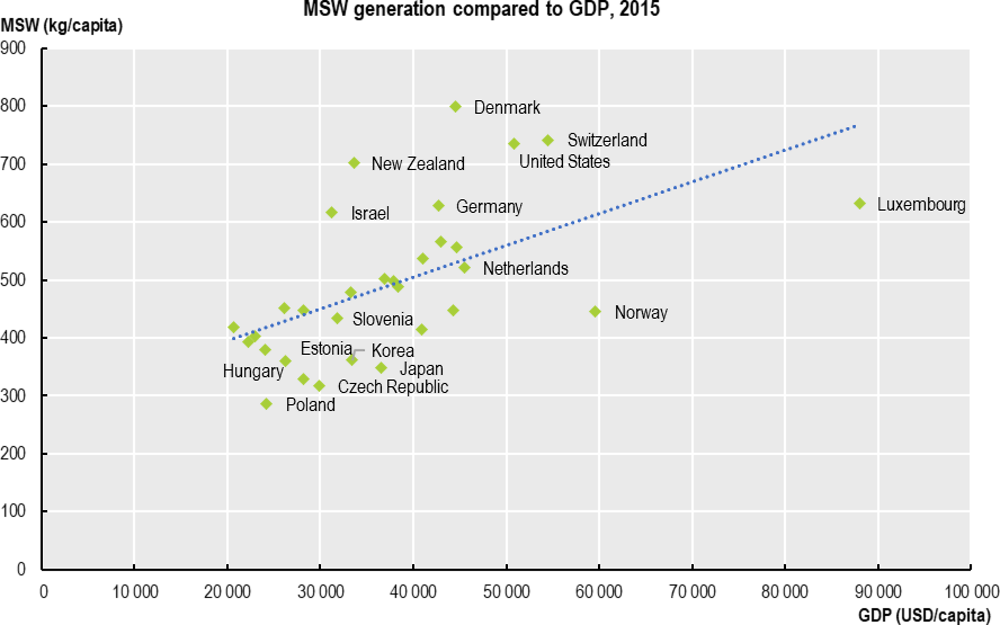
Note: Data refer to the indicated year or to the latest available year. They may include provisional figures and estimates. Household and similar waste collected by or for municipalities, originating mainly from households and small businesses. Includes bulky waste and separate collection. GDP at constant prices and 2010 purchasing power parities.
Source: OECD (2017), "Waste: Municipal waste", OECD Environment Statistics (database),
https://doi.org/10.1787/data-00601-en. OECD (2017), "GDP per capita and productivity levels", OECD Productivity Statistics (database), https://doi.org/10.1787/data-00686-en.
2.3.3. Treatment of municipal solid waste
In 2015, a few of the focus countries still send the majority of MSW to landfills: Colombia (86% in 2015), Israel (80% in 2015), Hungary (54% in 2015) and Czech Republic (53% in 2015) (Figure 2.10). Several other countries – including Japan, Netherlands, Norway and Estonia – had largely eliminated landfilling, replaced by incineration and recycling. In Norway and the Netherlands, over 40% of MSW went to recycling; in contrast, recycling rates were lower in Estonia and Japan.

Note: * 2014 data. Data may include provisional figures and estimates. Household and similar waste collected by or for municipalities, originating mainly from households and small businesses. Includes bulky waste and separate collection.
Source: OECD (2017), "Waste: Municipal waste", OECD Environment Statistics (database), https://doi.org/10.1787/data-00601-en.
The decline of landfilling of MSW has been a broad trend across many countries, with the rise of waste recycling and recovery. The Performance Reviews found an increase in waste recycling in most countries. Many OECD countries saw a rise in MSW incineration with energy recovery (and a decline in incineration without energy recovery). These trends were particularly dramatic in Estonia, where nearly all MSW was sent to landfills in 2000, but only 8% in 2015, due to a shift to incineration mainly and recycling. Slovenia achieved a steady increase in the recovery and recycling of MSW since 2002, and a corresponding fall in landfilling. The landfilling of MSW in Japan fell from 19% in 2000 to 13% in 2007, with a corresponding increase in recycling; Norway also saw a steady decline in landfilling and an increase in recycling.
A broad range of policies – including landfill bans, landfill taxes and extended producer responsibility(EPR) – have supported the shift away from landfilling (see Chapter 4 on policy instruments); so have investments, which in several countries were supported by government financing (see Chapter 5).
2.3.4. Evidence of decoupling between waste generation and GDP
The Performance Reviews identified some progress in decoupling primary waste levels and GDP. For example, primary waste generation remained stable in Poland during the 2000-12 period, while GDP grew by 50%. In Japan, primary waste generation grew more slowly than GDP between 1997 and 2007, with a decline in particular in mining waste; however, waste from the energy production and manufacturing sectors grew faster than GDP. The Environmental Performance Reviews do not provide a comprehensive overview of the factors behind this trend. This relative decoupling may be linked to the nature of the economic recovery in these countries, with a potential shift away from production and consumption that generates high levels of waste. It may also point to the impact of policy developments in these countries, with Poland acceding to the EU environmental acquis during this period, and Japan adopting its Fundamental Plan for Establishing a Sound Material-Cycle (SMC) Society, which sets out targets for waste generation and material productivity.
Other countries did not achieve a decoupling in waste generation from economic growth. In Korea, waste generation appears to be closely linked with economic growth. Between 2000 and 2014, primary waste generation increased by 71%, in line with economic growth (+74%). Norway has been unable to meet its objective of decoupling waste generation from economic growth, with annual waste generation growing at a disproportionately higher rate (+17%) than GDP (+9%) during the period from 2004 to 2011.
For the period 2006-12, where data are available across most of the review countries, only two saw a clear decoupling trend: Poland and Slovenia. It should be noted that this is a relatively short time period for an assessment of decoupling. Moreover, there may be differences in statistical methods over time and across countries. Consequently, these results provide only an initial overview of trends.
The Environmental Performance Reviews reported a decoupling trend between the generation of MSW and economic growth in some focus countries. The Environmental Performance Reviews of Japan and the Netherlands highlighted these countries’ policy actions, including waste disposal charges, as a factor in reductions in municipal waste generation. Some countries, such as Israel and Hungary, saw a relative decoupling: MSW generation grew over their review periods, but at a slower rate than GDP. Here too, differences in statistical methods limit the data availability across countries.
References
OECD (2008a), Household Behaviour and the Environment: Reviewing the Evidence, 183, OECD Publishing, Paris, www.oecd.org/environment/consumption-innovation/42183878.pdf .
OECD (2008b), Resource Productivity in the G8 and the OECD, A report in the Framework of the Kobe 3R Action Plan, OECD Publishing, Paris, www.oecd.org/env/waste/47944428.pdf.
OECD (2010), OECD Environmental Performance Reviews: Japan 2010, OECD Publishing, Paris, https://doi.org/10.1787/9789264087873-en.
OECD (2011a), OECD Environmental Performance Reviews: Israel 2011, OECD Publishing, Paris, https://doi.org/10.1787/9789264117563-en.
OECD (2011b), OECD Environmental Performance Reviews: Norway 2011, OECD Publishing, Paris, https://doi.org/10.1787/9789264098473-en.
OECD (2012), OECD Environmental Performance Reviews: Slovenia 2012, OECD Publishing, Paris, https://doi.org/10.1787/9789264169265-en.
OECD/ECLAC (2014), OECD Environmental Performance Reviews: Colombia 2014, OECD Publishing, Paris, https://doi.org/10.1787/9789264208292-en.
OECD (2015a), OECD Environmental Performance Reviews: The Netherlands 2015, OECD Publishing, Paris, https://doi.org/10.1787/9789264240056-en.
OECD (2015b), OECD Environmental Performance Reviews: Poland 2015, OECD Publishing, Paris, https://doi.org/10.1787/9789264227385-en.
OECD (2017a), OECD Environmental Performance Reviews: Korea 2017, OECD Publishing, Paris, https://doi.org/10.1787/9789264268265-en.
OECD (2017b), OECD Environmental Performance Reviews: Estonia 2017, OECD Publishing, Paris, https://doi.org/10.1787/9789264268241-en.
OECD (2018a), OECD Environmental Performance Reviews: Hungary 2018, OECD Publishing, Paris, https://doi.org/10.1787/9789264298613-en.
OECD (2018b), OECD Environmental Performance Reviews: Czech Republic 2018, OECD Publishing, Paris, https://doi.org/10.1787/9789264300958-en.
Note
← 1. 1 The term “treatment” is understood in its broad sense and designates disposal and recovery operations as well as pre-treatment of waste prior to recovery or disposal.
Metadata, Legal and Rights
https://doi.org/10.1787/9789264309395-en
© OECD 2019
The use of this work, whether digital or print, is governed by the Terms and Conditions to be found at http://www.oecd.org/termsandconditions.
