
Chapter 5. Material resources available at school
This chapter explores how material resources - including the physical infrastructure of a school and the educational materials available in the school - are related to student performance and equity in education. The chapter highlights the availability and quality of computers and Internet access at school, and whether teachers are adequately prepared to use these digital tools effectively in their lessons.
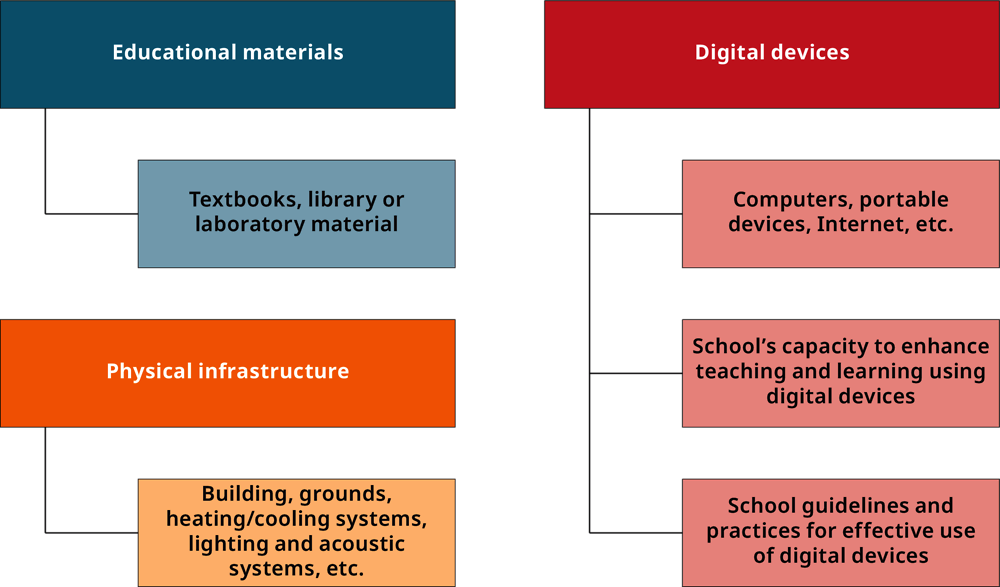
The physical infrastructure of a school and the educational materials available to teachers and students – which are referred to here collectively as “material resources” – are important components of a high-quality education. Teachers need educational materials, such as textbooks, computers, library materials or laboratories, in order to provide instruction that is up-to-date, and that is challenging and responsive to students’ needs (Oakes and Saunders, 2004[1]; Murillo and Román, 2011[2]). In addition, a school environment that is conducive to teaching and learning requires adequate physical infrastructure and facilities, such as buildings, grounds, heating and cooling systems, and lighting and acoustic systems (Conlin and Thompson, 2017[3]; Gunter and Shao, 2016[4]; Neilson and Zimmerman, 2014[5]).
Yet the relationship between material resources and student outcomes is complex. As shown throughout this chapter, in order to make a difference in student learning, school infrastructure and educational materials need to meet at least three conditions.
First, material resources need to be available where they are most needed and in sufficient quantity. This chapter examines the levels of material resources by various school types (e.g. socio-economically disadvantaged and advantaged schools, rural and urban schools, public and private schools), and the relationship between material resources and student performance in PISA 2018.
Second, available material resources need to be of an appropriate quality and type to meet students’ needs. For example, if textbooks are not updated to include recent advances in scientific knowledge or curricular reforms in learning standards, or if computers’ connection to the Internet is too slow, then the pedagogical value of these materials is limited.
Finally, material resources need to be used effectively. The availability and quality of instructional materials, in themselves, do not guarantee better learning; schools and teachers must be able to use these resources to enhance learning and teaching. This is particularly clear with regard to information and communication technology (ICT) in education. Research shows that the impact of computers and digital devices on student learning has remained limited, partly because the rapid adoption of ICT technology by schools has not been accompanied by the development of teachers’ capacity to integrate digital devices in their practice (OECD, 2015[6]; Tamim et al., 2011[7]). This chapter explores whether schools provide guidelines and rules to guarantee that instructional materials and digital devices are used effectively. It also explores whether teachers have the technical and pedagogical skills, and the support they need, to integrate digital devices into instruction practices.
Students attending schools whose principal reported fewer shortages of material resources scored higher in reading, on average across OECD countries and in 12 countries and economies, after accounting for students’ and schools’ socio-economic profile. At the system level, more shortages of educational materials were correlated with lower mean performance in reading, even after accounting for per capita GDP, across OECD countries, and across all participating countries and economies in PISA 2018.
In countries and economies with higher mean performance in reading, there tended to be smaller differences in material resources between advantaged and disadvantaged schools; in some cases, disadvantaged schools tended to have more material resources than advantaged schools.
While more digital devices, such as computers and portable computers, were available in schools in 2018 than in 2015, the availability of these devices was not associated with student performance, on average across OECD countries, and in most countries and economies that participated in PISA 2018.
After accounting for students’ and schools’ socio-economic profile, in 11 countries/economies, students in schools where a larger share of the computers available to students for educational purposes is connected to the Internet scored higher in reading; but in 7 countries/economies students in such schools scored lower.
On average across OECD countries in 2018, 36% of students attended a school that has a specific programme to promote teacher collaboration on the use of digital devices, and less than 44% of students attended a school that has a scheduled time for teachers to meet to share, evaluate or develop instructional materials and approaches that incorporate digital devices.
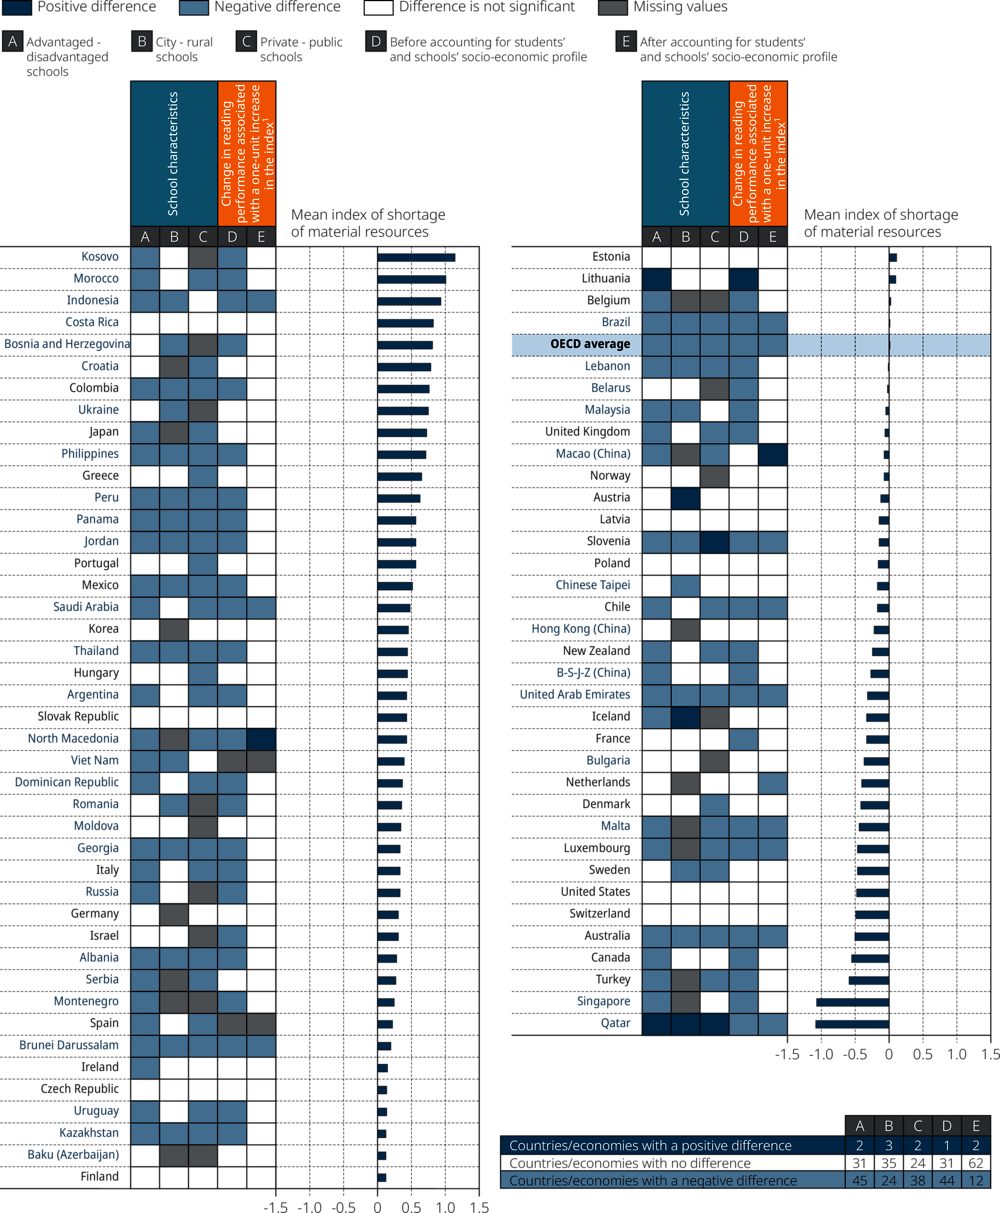
PISA measures the availability and quality of material resources in schools by asking school principals if their school’s capacity to provide instruction is hindered by: a lack of educational materials (i.e. textbooks, ICT equipment, library or laboratory material); inadequate or poor quality educational materials; a lack of physical infrastructure (i.e. building, grounds, heating/cooling systems, lighting and acoustic systems); or inadequate or poor quality physical infrastructure. Principals’ answers to these questions were combined in a single index, the index of shortage of material resources, which was standardised to have a value of 0 equal to the average value in the index across OECD countries (for technical details, see Annex A3). Positive values in this index indicate more shortages of quality material resources than on average across OECD countries; negative values in the index indicate greater availability and quality of material resources than on average across OECD countries (Figure V.5.2). For interpretation purposes, it is important to keep in mind that the index measures the perception of school principals, rather than an objective measure of shortage. School principals in different countries may have different perceptions of what constitutes a shortage of educational materials and physical infrastructure in their school.
1. This analysis is restricted to schools with the modal ISCED level for 15-year-old students.
Note: Higher values in the index indicate greater shortages of material resources.
Countries and economies are ranked in descending order of the index of shortage of material resources.
Source: OECD, PISA 2018 Database, Table V.B1.5.2.
In PISA 2018, the index of shortage of material resources was 0.8 or higher in Bosnia and Herzegovina, Colombia, Costa Rica, Croatia, Indonesia, Kosovo and Morocco, a value that indicates comparatively more shortages of material resources, as perceived by school principals (Figure V.5.2). In these countries, between 50% of students (in Costa Rica) and 80% of students (in Kosovo) were in schools whose principal reported that the school’s capacity to provide instruction is hindered by inadequate or poor quality educational materials (Table V.B1.5.1).
In Canada, Qatar, Singapore and Turkey, the index of shortage of material resources was -0.6 or lower, a value that indicates comparatively fewer shortages of material resources, as perceived by school principals (Figure V.5.2). In Singapore and Qatar, less than 10% of students were in schools whose principal reported shortages of physical infrastructure, and less than 3% of students were in schools whose principal reported shortages of educational materials (Table V.B1.5.1).
Socio-economically disadvantaged schools were more likely than advantaged schools to experience shortages of material resources, on average across OECD countries and in 47 education systems. Disparities in material resources related to schools’ socio-economic profile were comparatively large in six Latin American countries (Argentina, Brazil, Colombia, Mexico, Panama and Peru) and three Southeast Asian countries (Indonesia, the Philippines and Thailand) (Table V.B1.5.2).
Disparities in shortages of material resources were also observed between rural and urban schools (in 25 education systems, rural schools suffered from more shortages) and between public and private schools (in 39 education systems, public schools suffered from more shortages; Figure V.5.2) (Table V.B1.5.2).
Students attending schools with fewer shortages of material resources performed better in reading, on average across OECD countries and in 44 countries and economies. In 31 countries and economies, shortages of material resources were unrelated to student performance.
After accounting for students’ and schools’ socio-economic profile, in 12 countries and economies, students in schools with fewer shortages scored higher in reading (Table V.B1.5.3). In Macao (China) and the Republic of North Macedonia students in such schools scored lower. In 62 countries and economies material resources and reading scores were unrelated, after accounting for students’ and schools’ socio-economic profile.
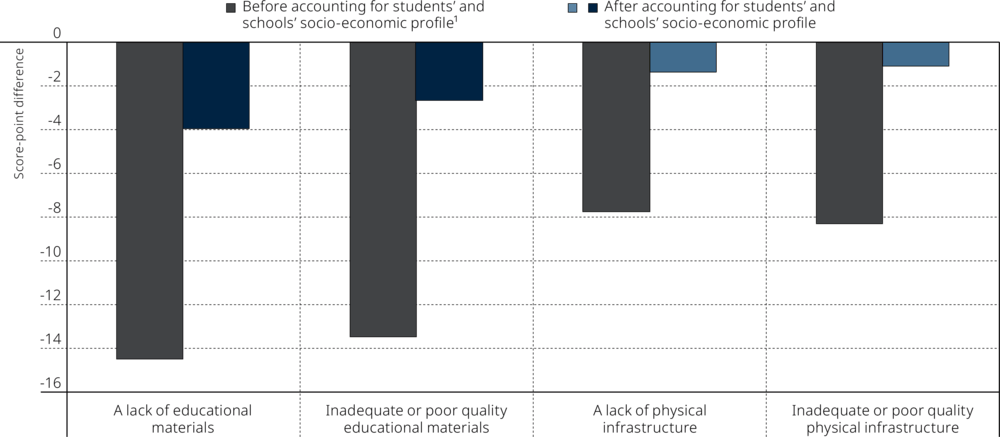
On average across OECD countries, shortages of educational materials were more strongly associated with lower reading performance than shortages of physical infrastructure (Figure V.5.3). Before accounting for other factors, shortages of educational materials, as well as shortages of physical infrastructure, were both associated with lower student performance in reading, on average across OECD countries. However, after accounting for students’ and schools’ socio-economic profile, while the association between students’ reading scores and schools’ physical infrastructure became statistically insignificant, the association with schools’ educational materials remained negative and statistically significant (Table V.B1.5.3).
1. The socio-economic profile is measured by the PISA index of economic, social and cultural status.
Notes: Statistically significant values are shown in a darker tone. All values are statistically significant before accounting for students’ and schools’ socio-economic profile (see Annex A3).
Educational materials include textbooks, ICT equipment, library, laboratory material, etc. Physical infrastructure includes school building, grounds, heating/cooling systems, lighting and acoustic systems, etc.
This analysis is restricted to schools with the modal ISCED level for 15-year-old students.
Source: OECD, PISA 2018 Database, Table V.B1.5.3.
As new generations of students are familiar with information technology from an early age, many countries are making efforts to bring a broader array of computers and ICT equipment into their schools and classrooms (OECD, 2019[8]). Computers and other digital devices, such as laptops, tablets, interactive whiteboards or computer-assisted learning programmes, are deemed important for the educational process; they are being developed to serve as pedagogical tools and help prepare students for today’s digital economy (Barrow, Markman and Rouse, 2009[9]; Lee, 2010[10]). Yet the impact of education technology on student learning has proven more difficult to discern than initially expected (OECD, 2015[6]). Also, the “digital divide” in education (i.e. unequal access and more advanced and effective use of ICT in schools) remains a concern for researchers and policy makers (Dolan, 2016[11]). Schools still need to improve their practices in using these devices, which are increasingly integrated throughout the home and work place. Support from principals, collaboration amongst teachers, and adapting software to students’ needs can all help (Means, 2010[12]; McKnight et al., 2016[13]).
Computers
On average across OECD countries in 2018, there was almost one computer available at school for educational purposes for every 15-year-old student (computer-student ratio equal to 0.8) (Figure V.5.4). In Austria, Iceland, Luxembourg, Macao (China), New Zealand, the United Kingdom and the United States, the computer-student ratio was 1.25 or more, while in Albania, Brazil, Greece, Kosovo, Montenegro, Morocco, Turkey and Viet Nam, there was only one computer available for every 4 students (ratio = 0.25) or less (Table V.B1.5.7).
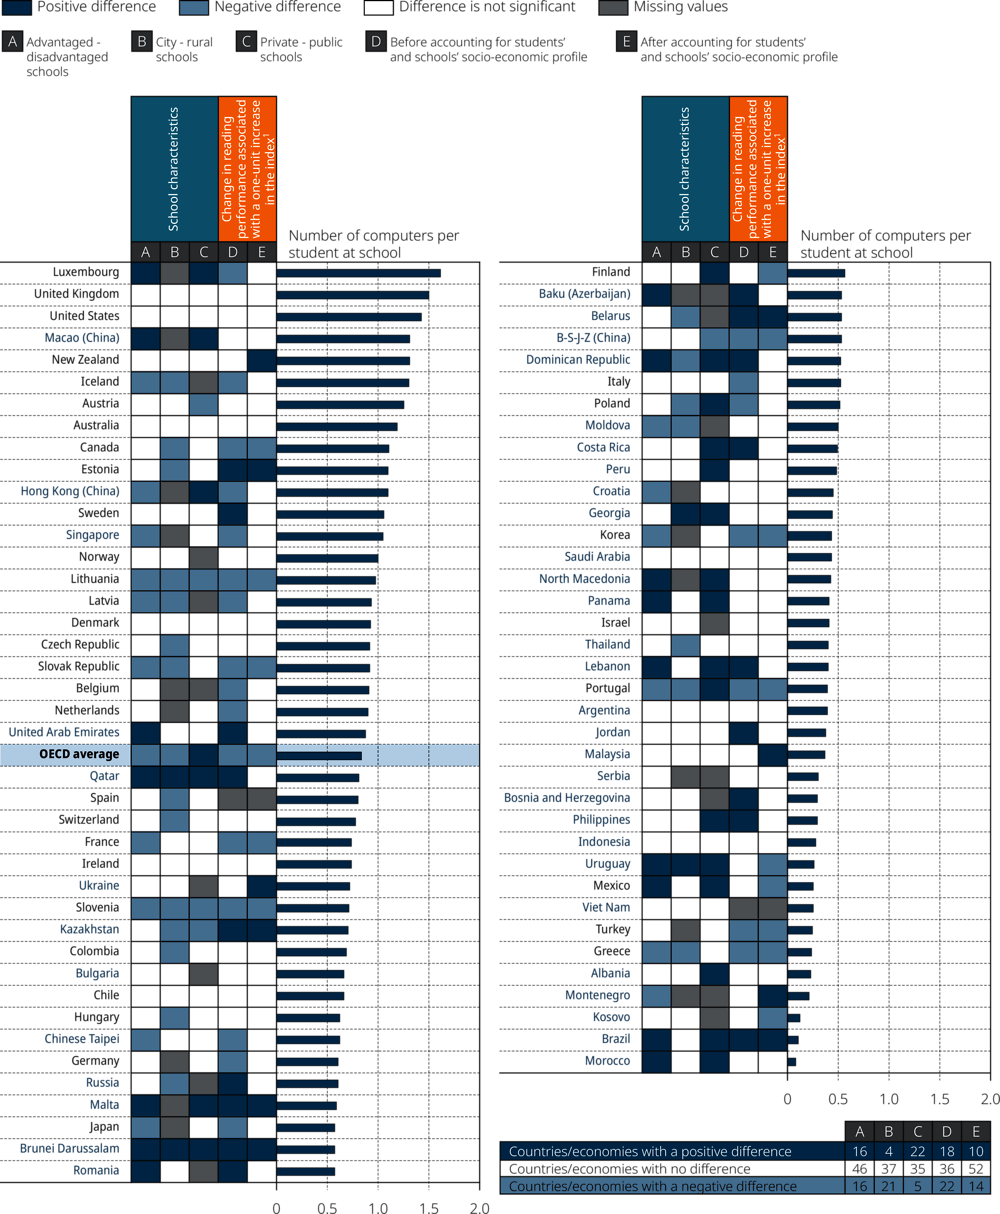
1. This analysis is restricted to schools with the modal ISCED level for 15-year-old students.
Countries and economies are ranked in descending order of the ratio of computers available at school for educational purposes per 15-year-old student.
Source: OECD, PISA 2018 Database, Table V.B1.5.6.
Contrary to what might be expected, socio-economically disadvantaged schools tended to have more computers per student (ratio = 0.89) than advantaged schools (ratio = 0.76), on average across OECD countries. In 16 countries and economies, the computer-student ratio was greater in disadvantaged schools than in advantaged schools. The disparity in computers-per-student in favour of disadvantaged schools was the largest in Iceland, Korea, Latvia, Lithuania and Chinese Taipei (Table V.B1.5.6). However, in 17 countries and economies, the number of computers available per student was greater in advantaged schools than in disadvantaged schools.
Differences in the availability of computers were observed according to school type (i.e. public/private) and school location. On average across OECD countries, more computers per student were available in private schools (ratio = 0.97) than in public schools (ratio = 0.80). In 21 countries and economies, more computers per student were available in private schools, but in 5 countries and economies the opposite was true (i.e. more computers per students in public schools) (Table V.B1.5.6). On average across OECD countries, more computers per student were available in rural schools (ratio = 1.04) than in urban schools (ratio = 0.80). In 22 countries and economies, more computers per student were available in rural schools, but in 5 countries more computers per student were available in urban schools.
There was a widespread increase in the computer-student ratio between 2009 and 2018. The computer-per-student ratio increased in 47 out of the 63 countries and economies for which data for this period are available. The largest increases in the average number of computers per 15-year-old student were observed in Estonia, Iceland, Lithuania, Luxembourg, Sweden, the United Kingdom and the United States. On average across OECD countries, there was one additional computer available per every four students in 2018 than was available in 2009 (0.26 of an additional computer per student) (Table V.B1.5.7).
Consistent with previous PISA analyses, data from PISA 2018 show that students attending schools with more computers per student scored lower in the assessment than their peers in schools with fewer computers per student (Figure V.5.6). On average across OECD countries, one additional computer per student in a school was associated with a 12-point drop in reading scores before accounting for other factors, and with a 6-point decline after accounting for students’ and schools’ socio-economic profile (Table V.B1.5.6). This negative association between computers-per-student and students’ scores in reading was significant in 14 countries and economies, after accounting for socio-economic factors. The relationship was strongest (-15 points or more) in Beijing, Shanghai, Jiangsu and Zhejiang (China), Greece, Korea, Kosovo, Mexico, Portugal, the Slovak Republic, Turkey and Uruguay (Table V.B1.5.6). By contrast, in Belarus, Brazil, Brunei Darussalam, Estonia, Kazakhstan, Malaysia, Malta, Montenegro, New Zealand and Ukraine, students in schools with more computers per student scored higher in reading.
Portable computers
Up to this point, the discussion about computers available to 15-year-olds in school has not distinguished between desktop and portable computers, the latter of which are more likely to be used in the classroom, as opposed to in a computer lab. To differentiate between these two kinds of computers, PISA 2018 asked school principals how many of all of the computers available to 15-year-olds in school are portable. According to some studies, portable computers lead to improved learning by facilitating the development of constructivist approaches to teaching (i.e. placing the students at the centre of classroom process) (Jaillet, 2004[14]). However, laptop computers in the classroom can also introduce distractions (Fried, 2008[15]; Sana, Weston and Cepeda, 2013[16]), and seem to be less effective as tools for taking notes than pen and paper (Mueller and Oppenheimer, 2014[17]).
Portable computers, such as laptops and tablets, represented about 40% of all computers available to 15-year-olds in school, on average across OECD countries in 2018 (Table V.B1.5.8). In a few high-income countries, most computers available at school were portable: in Denmark, Norway, Singapore and Sweden, 9 out of 10 computers were portable; in the United States, 8 out of 10 computers were portable. Across OECD countries, countries with greater equity in student performance tended to have larger shares of portable computers available to students at school.1 By contrast, in 50 countries and economies, only 30%, at most, of all computers available at school were portable. In Georgia, Jordan, Malta, Morocco, the Philippines and Thailand, only 1 in 10 computers, at most, available to 15-year-olds at school were portable (Table V.B1.5.8).
The share of portable computers available to 15-year-olds at school was larger in 2018 than in 2015, on average across OECD countries (by nine percentage points) and in 44 countries and economies (Figure V.5.5). Increases in the share of portable computers were generally larger in higher-performing countries. Across all countries and economies in PISA 2018, there was a strong positive correlation between mean reading performance and the share of portable computers, even after accounting for per capita GDP (partial correlation coefficient = 0.29). In Canada, Estonia, Finland, Hong Kong (China), Iceland and the Netherlands, the share of portable computers at school grew 20 percentage points or more during the period (Table V.B1.5.9).
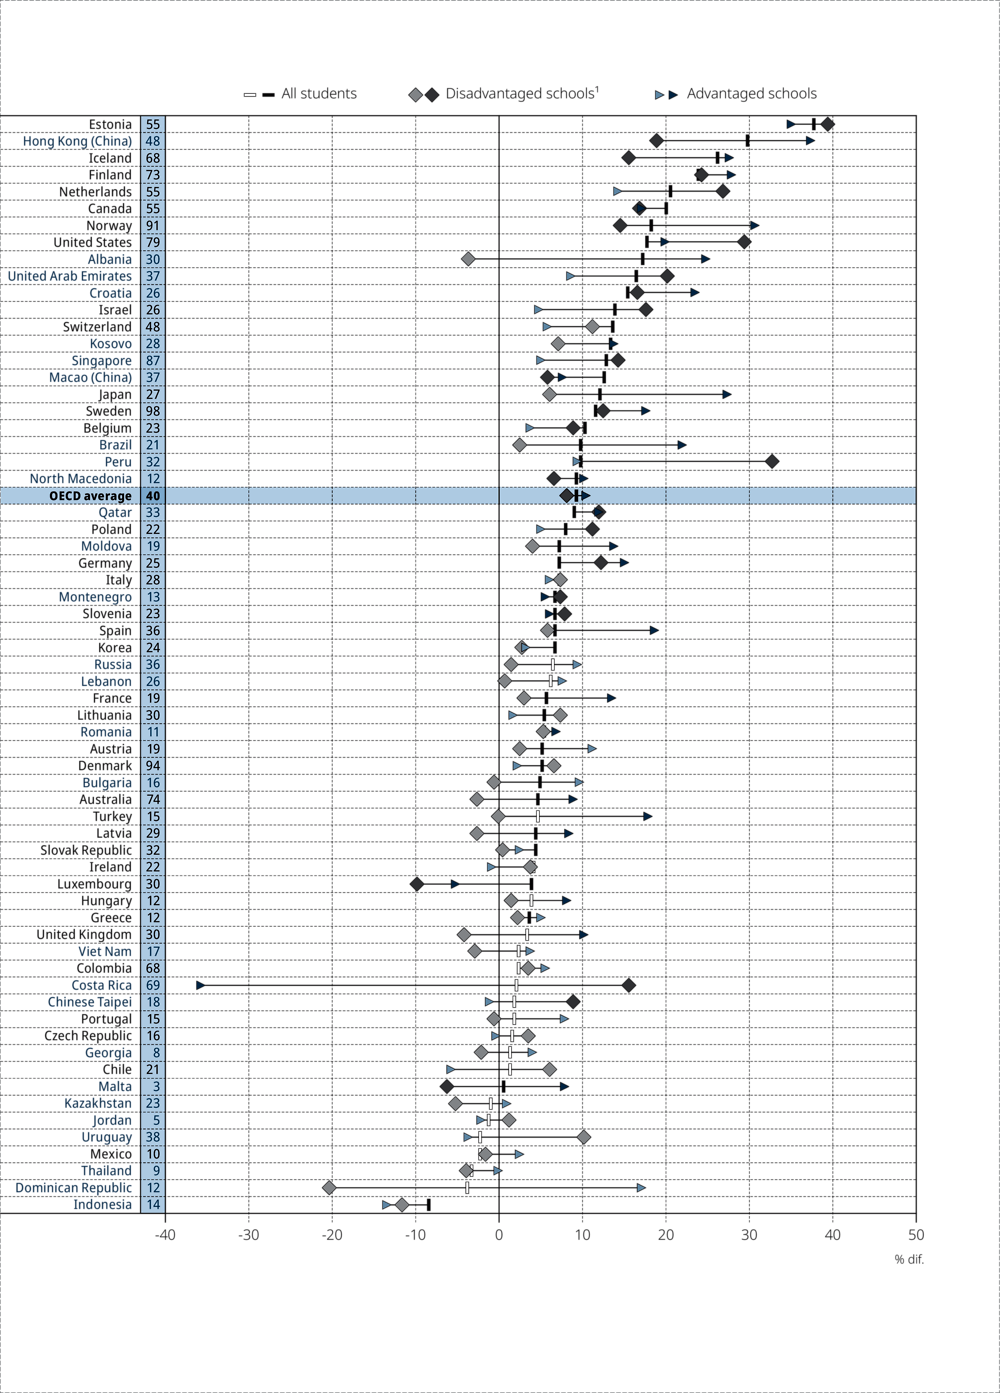
1. The socio-economic profile is measured by the PISA index of economic, social and cultural status (ESCS). A socio-economically disadvantaged (advantaged) school is a school in the bottom (top) quarter of the ESCS index in the relevant country/economy.
Notes: Statistically significant values are shown in darker tones (see Annex A3).
The percentage of portable computers available to students in 2018 is indicated next to the country/economy name.
Countries and economies are ranked in descending order of the change between PISA 2015 and PISA 2018 for all students.
Sources: OECD, PISA 2018 Database, Table V.B1.5.8 and Table V.B1.5.9.
Portable computers were more frequently available in socio-economically advantaged than in disadvantaged schools, on average across OECD countries and in 21 education systems that participated in PISA 2018. This was not the case in PISA 2015 (Table V.B1.5.9). On average across OECD countries between 2015 and 2018, the proportion of portable computers in disadvantaged schools grew by 8 percentage points (from 30% to 38%) while the proportion of portable computers in advantaged schools grew by 11 percentage points (from 29% to 41%) (Figure V.5.5).
In 2018, in 47 out of 77 PISA-participating countries/economies, the proportion of portable computers in school was unrelated to students’ reading scores. After accounting for students’ and schools’ socio-economic profile, in 5 countries/economies, a 10 percentage-point increase in the share of portable computers in school was associated with higher student performance, while in 7 countries/economies such an increase was associated with lower performance (Table V.B1.5.8).
Internet connection at school
Access to the Internet is virtually universal in most education systems that participated in PISA 2018. In 55 out of 79 countries and economies, 9 out of 10 computers available to 15-year-olds for educational purposes at school were connected to the Internet (Figure V.5.6). Although in OECD countries connection to the Internet was already widespread a decade ago, there is a clear trend of increasing Internet connectivity at school. In 29 countries and economies, the percentage of computers connected to the Internet increased between 2009 and 2018. In 11 of these countries and economies, the share increased by more than 10 percentage points, and in Albania, Georgia, Indonesia, Kazakhstan and the Republic of Moldova, it increased by 30 percentage points or more (Table V.B1.5.14). However, in Kosovo, Morocco and the Philippines, only half of the computers, at most, available to 15-year-old students at school were connected to the Internet in 2018 (Table V.B1.5.14).
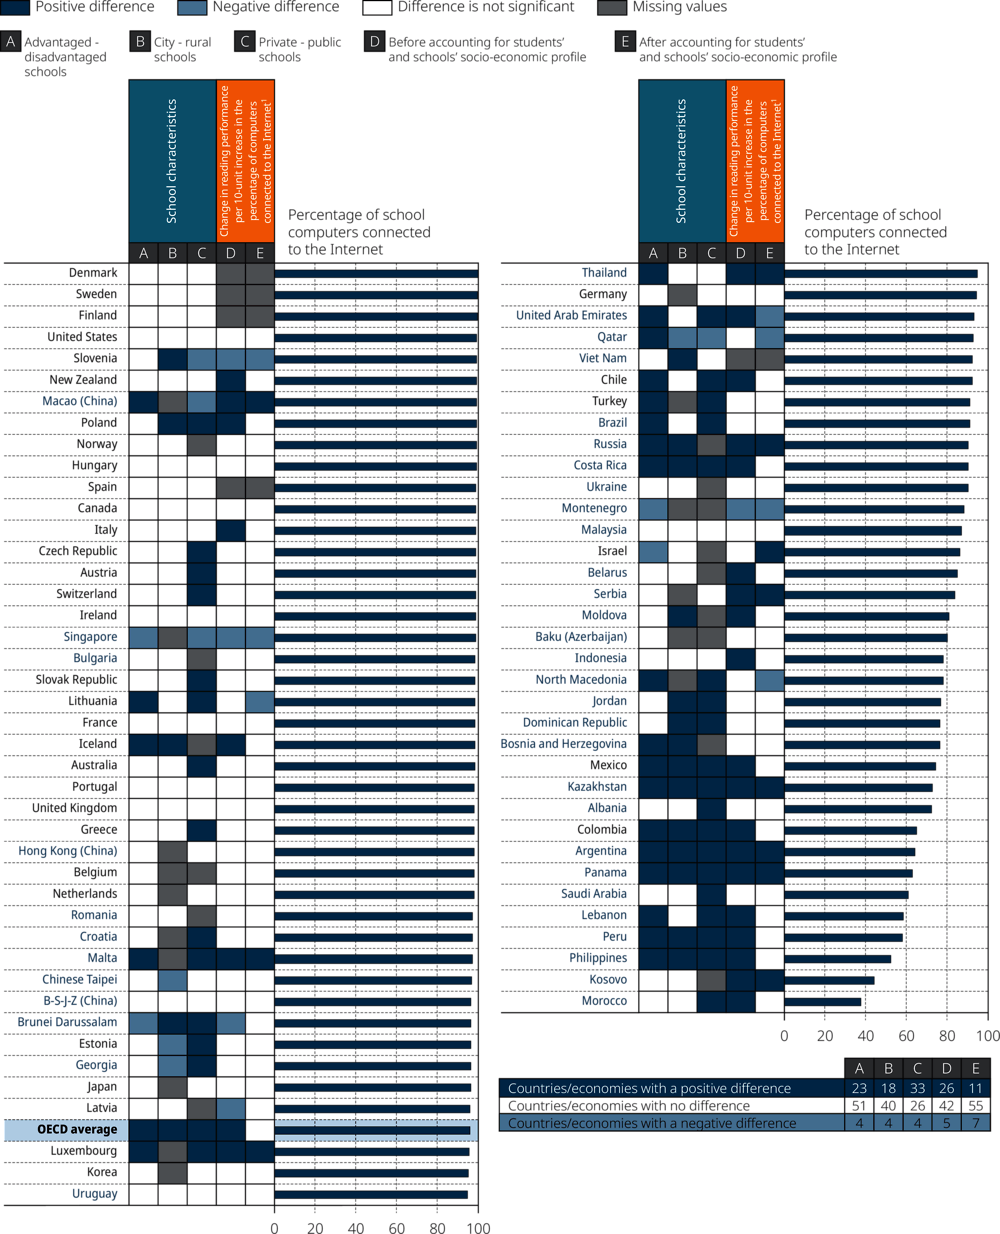
1. This analysis is restricted to schools with the modal ISCED level for 15-year-old students.
Countries and economies are ranked in descending order of the percentage of computers that are connected to the Internet amongst all school computers available to 15-year olds for educational purposes.
Source: OECD, PISA 2018 Database, Table V.B1.5.13.
Furthermore, socio-economically advantaged schools tended to have a larger share of computers connected to the Internet compared with disadvantaged schools, on average across OECD countries and in 23 education systems. In Argentina, Colombia, Lebanon, Mexico, Peru and the Philippines, the share of computers connected to the Internet was more than 40 percentage points larger in advantaged schools than in disadvantaged schools (Table V.B1.5.14).
On average across OECD countries, having more computers at school that are connected to the Internet was positively associated with reading performance, but after accounting for students’ and schools’ socio-economic profile, this average association disappeared. In 11 countries and economies, there was a positive association between students’ access to computers connected to the Internet and students’ reading scores, after accounting for students’ and schools’ socio-economic profile; in 7 countries and economies the association was negative (Table V.B1.5.13).
Schools’ capacity to enhance teaching and learning using digital devices
PISA 2018 asked school principals about different aspects of their school’s capacity to enhance teaching and learning using digital devices (Figure V.5.7). Some of these aspects referred to the availability or quality of ICT infrastructure (e.g. computing capacity, software, Internet speed, etc.), while others referred to teachers’ and the school’s capacity to integrate digital devices in instruction (e.g. digital skills, technical support, incentives, etc.).
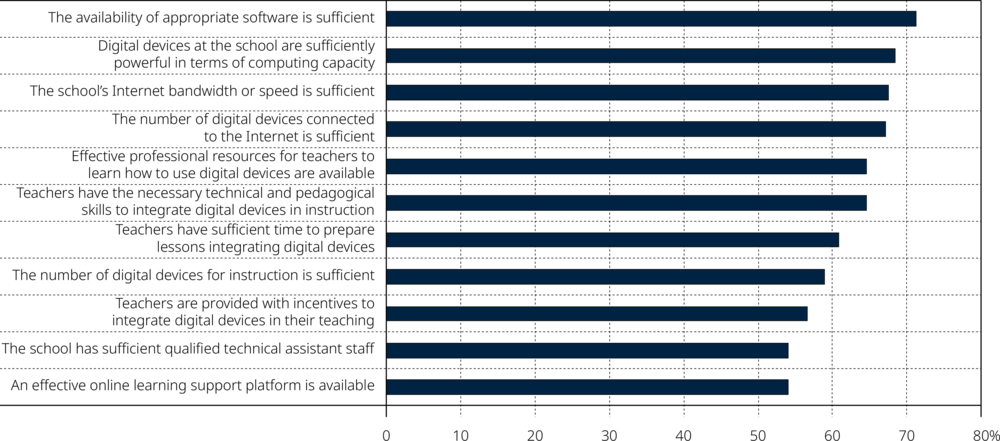
Source: OECD, PISA 2018 Database, Table V.B1.5.15.
According to principals’ reports, schools’ capacity to use digital devices effectively was greater when it involved ICT infrastructure. On average across OECD countries, more than 65% of students attended a school whose principal reported that the school’s capacity to enhance learning and teaching using digital devices is sufficient in terms of the adequacy of software available, the computing capacity of digital devices, the Internet bandwidth or speed, and the number of digital devices connected to the Internet. Around 55% of students attended a school where an effective online learning platform is available to them, on average across OECD countries (Table V.B1.5.15).
Aspects related to teachers’ capacity and motivation to integrate digital devices in instruction were somewhat weaker. On average across OECD countries, about 55% of students were in schools where teachers are provided with incentives to integrate digital devices into their teaching or have sufficiently qualified technical assistant staff, and about 60% were in schools where teachers have sufficient time to prepare lessons integrating digital devices (Table V.B1.5.15).
School capacity to enhance teaching and learning using digital devices is greater in socio-economically advantaged schools than disadvantaged schools. On average across OECD countries, in 10 out of the 11 indicators included in Figure V.5.7, students in advantaged schools were more likely to attend a school whose principal agreed that the school’s capacity to use digital devices is sufficient (Table V.B1.5.16). The only indicator where no socio-economic disparities were observed was whether teachers have sufficient time to prepare lessons integrating digital devices.
Students attending schools with a greater capacity to enhance teaching and learning using digital devices scored higher in reading, on average across OECD countries. For example, students in schools whose principal reported that the school’s Internet bandwidth or speed is sufficient scored 10 score points higher in reading, on average across OECD countries, while students in schools where teachers have the necessary technical and pedagogical skills to integrate digital devices in instruction scored 5 points higher (Table V.B1.5.17).
However, after accounting for students’ and schools’ socio-economic profile, differences in reading scores turned out to be not statistically significant for 9 out of the 11 indicators included in Figure V.5.7, on average across OECD countries. Students in schools where teachers are provided with incentives to integrate digital devices into their teaching scored lower than those in schools where such incentives where not provided, on average across OECD countries; but in 63 countries/economies, the association was not significant (Table V.B1.5.17). Similarly, students in schools that have sufficient numbers of qualified technical assistant staff scored lower than those in schools that do not have sufficient numbers of qualified technical staff, on average across OECD countries; but in 60 countries/economies, the association was not significant.
School practices for using digital devices effectively
Using digital devices and ICT effectively, to enhance teaching and learning, may also depend on schools’ policies and practices. PISA 2018 asked school principals whether they had formal guidelines (e.g. written statements, programmes or policies) or specific practices (e.g. regularly scheduled meetings) that focus on how to use digital devices effectively in the classroom.
On average across OECD countries, the most common school practices intended to improve learning through the use of digital devices were: having regular discussions between principals and teachers about the use of digital devices for pedagogical purposes (63% of students attended schools that practice this); having written school statements about the use of digital devices (62% of students); and having a specific programme to prepare students for responsible Internet behaviour (60% of students) (Figure V.5.8).
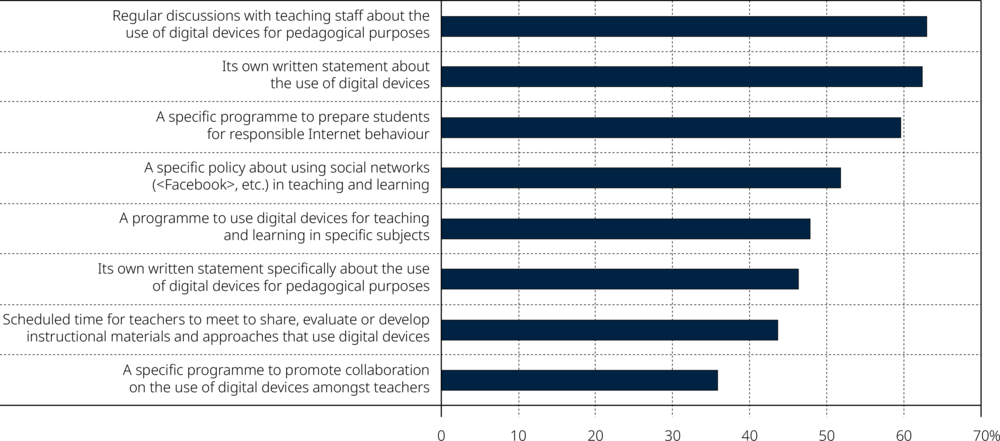
Source: OECD, PISA 2018 Database, Table V.B1.5.18.
By contrast, on average across OECD countries, the least common practices were: having a specific programme to promote collaboration amongst teachers on the use of digital devices (36% of students attended schools that have such a programme); having a scheduled time for teachers to meet to share, evaluate or develop instructional materials and approaches that use digital devices (44% of students); and having a written statement specifically about the use of digital devices for pedagogical purposes at school (46% of students) (Figure V.5.8).
School guidelines and practices to enhance teaching and learning using digital devices are more likely to be found in socio-economically advantaged schools than in disadvantaged schools. On average across OECD countries, for seven of the eight indicators included in Figure V.5.8, students in advantaged schools were more likely to attend a school whose principal agreed that the school has guidelines and practices for using digital devices (Table V.B1.5.19). Only when it came to scheduling time for teachers to meet to share, evaluate or develop instructional materials and approaches that use digital devices, were no socio-economic disparities observed, on average across OECD countries.
Four of the eight indicators of school practices for effectively using digital devices were associated with higher reading scores, on average across OECD countries (Table V.B1.5.20). For example, students in schools whose principal reported that the school had a specific programme to prepare students for responsible Internet behaviour scored eight points higher in reading, on average across OECD countries. Students in schools whose principal reported that the school had a specific programme to promote collaboration on the use of digital devices amongst teachers scored four points higher in reading, on average across OECD countries.
However, after accounting for students’ and schools’ socio-economic profile, none of the indicators of school practices for effectively using digital devices was associated with higher reading scores, on average across OECD countries (Table V.B1.5.20).
This section examines whether measures of material resources are related to education outcomes at the system level. Two education outcomes are considered: mean performance in reading and equity in reading performance. As in previous PISA reports, equity in reading performance is measured by the percentage of variation in reading performance accounted for by differences in students’ socio-economic status; the smaller the variation in performance explained by socio-economic status, the greater the equity in performance (OECD, 2018[18]; OECD, 2019[19]).
Figure V.5.9 shows system-level correlation coefficients between material resources on the one hand, and reading performance and equity in reading performance on the other. Correlational analyses were conducted separately for OECD countries and for all countries and economies that participated in PISA 2018. In addition, correlations were computed before and after accounting for per capita GDP, to account for the level of economic development of a country/economy.
![Figure V.5.9 [1/2]. Selected indicators of material resources, student performance and equity](images/eps/g05-09-01.png)
1. The percentage of variance in student performance explained by the PISA index of economic, social and cultural status was used as measure of inequity in performance. In a first step, the correlation coefficients between measures of material resources and inequity were computed. In a second step, the sign of the correlation coefficients was reversed (i.e. multiplied by -1) to simplify reporting (i.e. report correlation with equity instead of with inequity).
Notes: Only statistically significant coefficients are shown. Values that are statistically significant at the 10% level (p < 0.10) are in italics. All other values are statistically significant at the 5% level (p < 0.05).
Correlation coefficients range from -1.00 (i.e. a perfect negative linear association) to +1.00 (i.e. a perfect positive linear association). When a correlation coefficient is 0, there is no linear relationship between the two measures.
Source: OECD, PISA 2018 Database, Table V.B1.5.21.
![Figure V.5.9 [2/2]. Selected indicators of material resources, student performance and equity](images/eps/g05-09-02.png)
1. The percentage of variance in student performance explained by the PISA index of economic, social and cultural status was used as measure of inequity in performance. In a first step, the correlation coefficients between measures of material resources and inequity were computed. In a second step, the sign of the correlation coefficients was reversed (i.e. multiplied by -1) to simplify reporting (i.e. report correlation with equity instead of with inequity).
Notes: Only statistically significant coefficients are shown. Values that are statistically significant at the 10% level (p < 0.10) are in italics. All other values are statistically significant at the 5% level (p < 0.05).
Correlation coefficients range from -1.00 (i.e. a perfect negative linear association) to +1.00 (i.e. a perfect positive linear association). When a correlation coefficient is 0, there is no linear relationship between the two measures.
Source: OECD, PISA 2018 Database, Table V.B1.5.21.
At the system level, countries and economies with fewer shortages of material resources generally performed better in PISA. As shown in Figure V.5.10, differences in the index of shortage of material resources accounted for about 25% of the differences in mean reading performance across all participating countries and economies in PISA 2018. Across all participating countries and economies, the index of shortage of material resources was negatively correlated to mean performance in reading, mathematics and science even after accounting for per capita GDP (partial correlation coefficients around -0.25) (Table V.B1.5.21). Figure V.5.10 also shows that, before accounting for per capita GDP, the relationship between material resources and reading performance was weaker, but statistically significant, across OECD countries than across all countries/economies. This is partly because the level of material resources tends to be more similar across OECD countries than across all countries/economies. This system-level association between material resources and reading achievement is consistent with the same association, at the student level, observed in many countries and on average across OECD countries (Figure V.3.EDUSHORT Table V.B1.5.2).
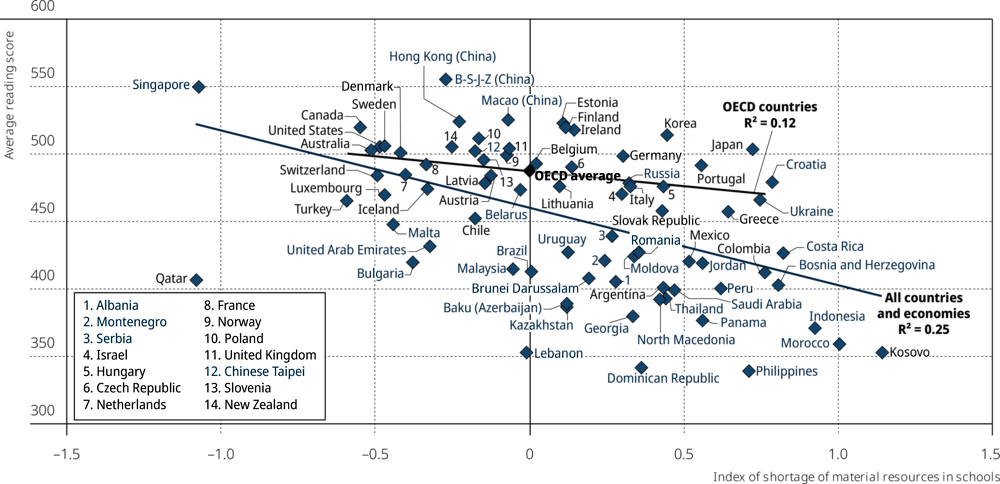
Positive values in this index indicate more shortages of quality material resources than on average across OECD countries; negative values indicate greater availability and quality of material resources than on average across OECD countries.
Sources: OECD, PISA 2018 Database, Tables I.B1.4 and V.B1.5.2.
When considering the components of the index of educational materials separately, it was observed that, at the system level, mean reading performance was more strongly correlated with educational materials than with physical infrastructure. This is consistent with student-level analyses (Figure V.5.3). Countries with a higher percentage of students in schools whose principal reported that a lack of educational materials hinders learning generally showed lower mean reading scores, even after accounting for per capita GDP, both across OECD countries (partial r = -0.36) and across all participating countries and economies (partial r = -0.33) (Figure V.5.9). The lack of school infrastructure was correlated with lower mean reading performance, even after accounting for per capita GDP, across all participating countries and economies, (partial r = -0.24); but across OECD countries, the correlation was not statistically significant (Figure V.5.9).
Furthermore, school systems where material resources are allocated equitably amongst socio-economically advantaged and disadvantaged schools – or, in some cases, where disadvantaged schools have more material resources than advantaged schools – generally performed better in PISA. Across all participating countries and economies, the index of equity in the allocation of material resources2 was positively correlated with mean performance in reading, mathematics and science, even after accounting for per capita GDP (partial r coefficients ranging from 0.43 to .48) (Table V.B1.5.21). As shown in Figure V.5.11, differences in the allocation of material resources in relation to schools’ socio-economic profile accounted for about 24% of the differences in mean reading performance across all participating countries and economies in PISA 2018.3
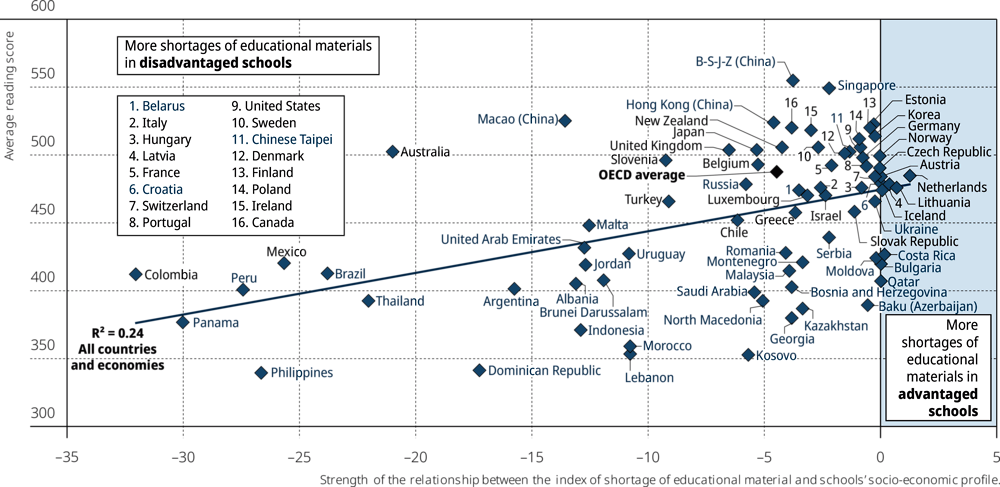
1. This is the strength of the association between the school’s socio-economic profile and the principal’s concern about the educational material at the school. Positive values indicate that principals of socio-economically advantaged schools are more concerned than principals of disadvantaged schools. Negative values indicate that principals of disadvantaged schools are more concerned than principals of advantaged schools. A value of 0 means there is no difference between advantaged and disadvantaged schools.
Sources: OECD, PISA 2018 Database, Tables I.B1.4 and V.B1.5.5.
When it comes to the availability of digital resources, Internet connectivity is the most strongly associated with mean reading scores. At the system level, there was a strong positive association between the percentage of school computers (those available to 15-year-olds for educational purposes) that are connected to the Internet and mean reading performance, even after accounting for per capita GDP, across all participating countries and economies (Figure V.5.9). As shown in Figure V.5.12, differences in Internet connectivity accounted for as much as 57% of the differences in mean reading performance across all participating countries and economies in PISA 2018.4 In addition, schools’ Internet bandwidth or speed is positively correlated to mean reading performance and to equity in reading performance, across OECD countries, and across all countries and economies, before and after accounting for per capita GDP (Figure V.5.9).
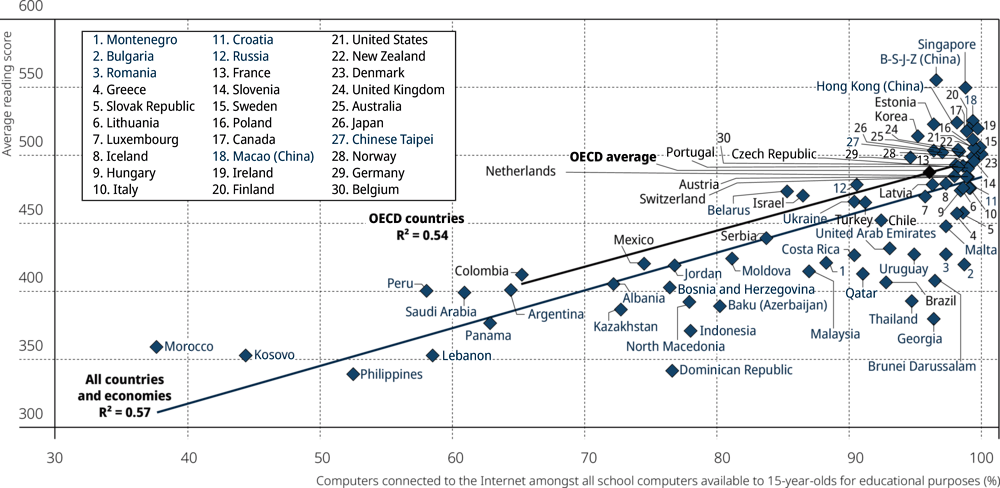
Sources: OECD, PISA 2018 Database, Tables I.B1.4 and V.B1.5.13.
Some measures of schools’ capacity to enhance teaching and learning using digital devices were positively correlated with mean reading performance, even after accounting for per capita GDP, across OECD countries, and across all participating countries and economies (Figure V.5.9). For example, some 34% of the variation in mean reading performance across all countries/economies could be accounted for by differences in the availability of adequate software (Figure V.5.13).
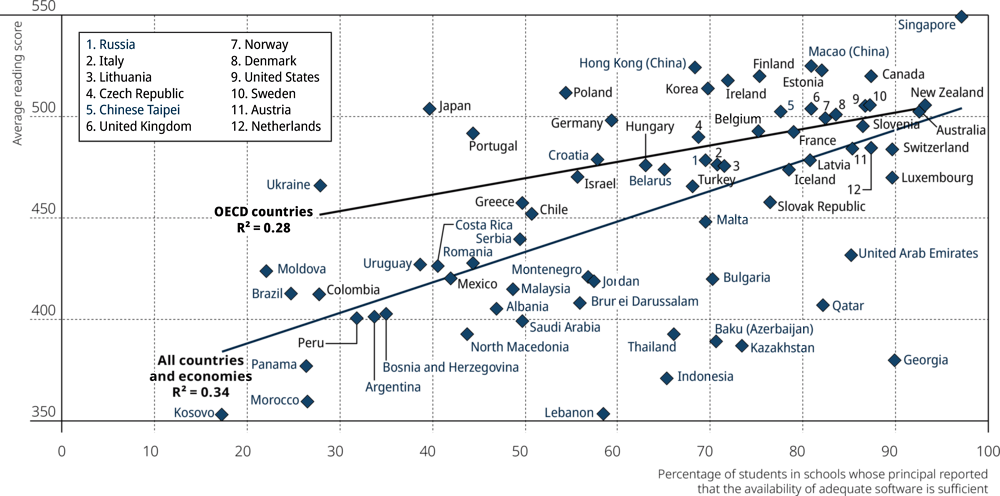
Sources: OECD, PISA 2018 Database, Tables I.B1.4 and V.B1.5.15.
Most measures of schools’ capacity to enhance teaching and learning using digital devices were weakly related to equity in education. However, one particular measure, namely access to an effective online learning support platform, was related to equity in student performance in all core subjects, across OECD countries, and across all countries and economies, before and after accounting for per capita GDP (Table V.B1.5.21). Across OECD countries, about 15% of the differences in equity in reading performance can be accounted for by the percentage of students in schools whose principal agreed or strongly agreed that “an effective online learning support platform is available” (Figure V.5.14).5 The correlation is weaker, but statistically significant, across all countries/economies. Effective online learning support platforms are more often available in advantaged schools than disadvantaged schools, on average across OECD countries (a difference of 10 percentage points) and in 34 countries (Table V.B1.5.16).
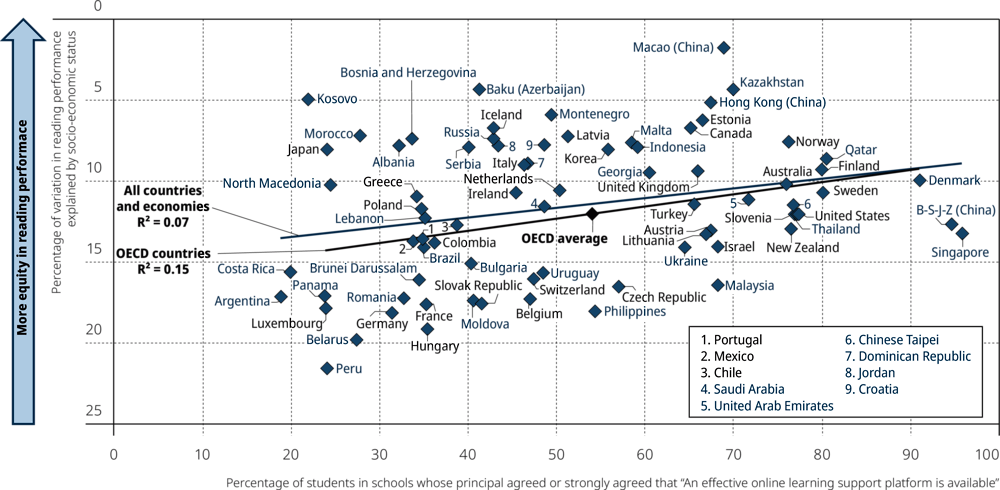
Note: This analysis is restricted to schools with the modal ISCED level for 15-year-old students.
Sources: OECD, PISA 2018 Database, Tables II.B1.2.3 and V.B1.5.15.
Some school practices for using digital devices were also related to education outcomes at the system level. For example, across OECD countries, and across all countries and economies, school systems with a higher percentage of students in schools whose principals reported that their school has its own written statement about the use of digital devices generally showed higher mean performance in reading, mathematics and science (Table V.B1.5.21). Having a written statement about the use of digital devices could be a proxy for regulatory practices that aim to ensure the efficacy of using those devices for learning. As shown in Figure V.5.15, the association is somewhat stronger across OECD countries than across all countries/economies. Across OECD countries, some 23% of the differences in equity in reading performance can be accounted for by the percentage of students in schools whose principal reported that their school has its own written statement about the use of digital devices.6
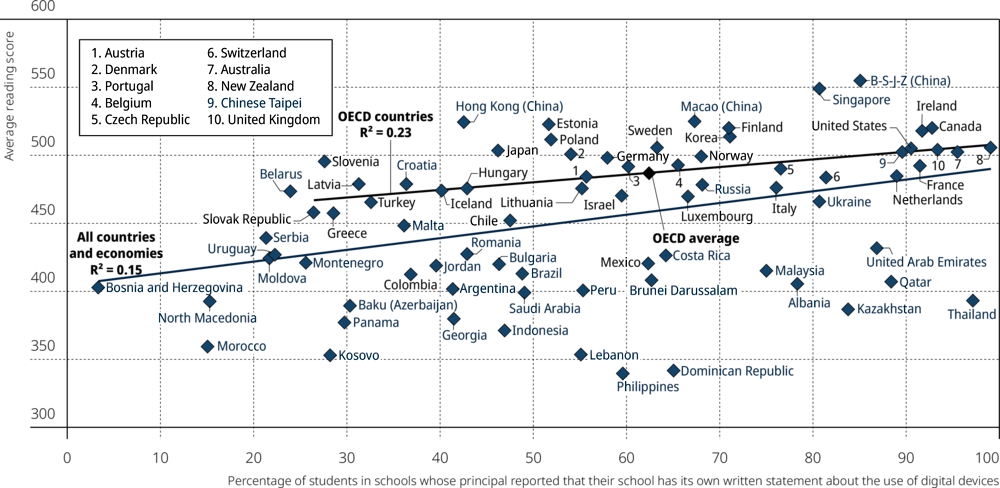
Sources: OECD, PISA 2018 Database, Tables I.B1.4 and V.B1.5.18.
References
[9] Barrow, L., L. Markman and C. Rouse (2009), “Technology’s Edge: The Educational Benefits of Computer-Aided Instruction”, American Economic Journal: Economic Policy, Vol. 1/1, pp. 52-74, https://doi.org/10.1257/pol.1.1.52.
[3] Conlin, M. and P. Thompson (2017), “Impacts of new school facility construction: An analysis of a state-financed capital subsidy program in Ohio”, Economics of Education Review, Vol. 59, pp. 13-28, https://doi.org/10.1016/j.econedurev.2017.05.002.
[11] Dolan, J. (2016), “Splicing the Divide: A Review of Research on the Evolving Digital Divide Among K–12 Students”, Journal of Research on Technology in Education, Vol. 48/1, pp. 16-37, https://doi.org/10.1080/15391523.2015.1103147.
[15] Fried, C. (2008), “In-class laptop use and its effects on student learning”, Computers and Education, Vol. 50/3, pp. 906-914, https://doi.org/10.1016/j.compedu.2006.09.006.
[4] Gunter, T. and J. Shao (2016), Synthesizing the effect of building condition quality on academic performance, MIT Press Journals, https://doi.org/10.1162/EDFP_a_00181.
[22] Hawkins, E. and K. Hawkins (2003), “Bridging Latin America’s Digital Divide: Government Policies and Internet Access”, Journalism & Mass Communication Quarterly, doi: 10.1177/107769900308000310, pp. 646-665, https://doi.org/10.1177/107769900308000310.
[14] Jaillet, A. (2004), What Is Happening With Portable Computers in Schools?.
[10] Lee, M. (2010), “Interactive whiteboards and schooling: the context”, Technology, Pedagogy and Education, Vol. 19/2, pp. 133-141, https://doi.org/10.1080/1475939X.2010.491215.
[13] McKnight, K. et al. (2016), “Teaching in a digital age: How educators use technology to improve student learning”, Journal of Research on Technology in Education, Vol. 48/3, pp. 194-211, https://doi.org/10.1080/15391523.2016.1175856.
[12] Means, B. (2010), “Technology and education change: Focus on student learning”, Journal of Research on Technology in Education, Vol. 42/3, pp. 285-307, https://doi.org/10.1080/15391523.2010.10782552.
[17] Mueller, P. and D. Oppenheimer (2014), “The pen is mightier than the keyboard: Advantages of longhand over laptop note taking”, Psychological Science, Vol. 25/6, pp. 1159-1168, https://doi.org/10.1177/0956797614524581.
[2] Murillo, F. and M. Román (2011), “School infrastructure and resources do matter: analysis of the incidence of school resources on the performance of Latin American students”, School Effectiveness and School Improvement, Vol. 22/1, pp. 29-50, https://doi.org/10.1080/09243453.2010.543538.
[5] Neilson, C. and S. Zimmerman (2014), “The effect of school construction on test scores, school enrollment, and home prices”, Journal of Public Economics, Vol. 120, pp. 18-31, https://doi.org/10.1016/j.jpubeco.2014.08.002.
[1] Oakes, J. and M. Saunders (2004), Education’s most basic tools: Access to textbooks and instructional materials in California’s public schools, Teachers College, Columbia University, https://doi.org/10.1111/j.1467-9620.2004.00423.x.
[21] OECD (2019), Education at a Glance 2019: OECD Indicators, OECD Publishing, Paris, https://dx.doi.org/10.1787/f8d7880d-en.
[19] OECD (2019), PISA 2018 Results (Volume II): Where All Students Can Succeed, PISA, OECD Publishing, Paris, https://dx.doi.org/10.1787/b5fd1b8f-en.
[8] OECD (2019), Trends Shaping Education 2019, OECD Publishing, Paris, https://dx.doi.org/10.1787/trends_edu-2019-en.
[18] OECD (2018), Equity in Education: Breaking Down Barriers to Social Mobility, PISA, OECD Publishing, Paris, https://dx.doi.org/10.1787/9789264073234-en.
[20] OECD (2018), Responsive School Systems: Connecting Facilities, Sectors and Programmes for Student Success, OECD Reviews of School Resources, OECD Publishing, Paris, https://dx.doi.org/10.1787/9789264306707-en.
[6] OECD (2015), Students, Computers and Learning: Making the Connection, PISA, OECD Publishing, Paris, https://dx.doi.org/10.1787/9789264239555-en.
[16] Sana, F., T. Weston and N. Cepeda (2013), “Laptop multitasking hinders classroom learning for both users and nearby peers”, Computers and Education, Vol. 62, pp. 24-31, https://doi.org/10.1016/j.compedu.2012.10.003.
[7] Tamim, R. et al. (2011), “What Forty Years of Research Says About the Impact of Technology on Learning”, Review of Educational Research, Vol. 81/1, pp. 4-28, https://doi.org/10.3102/0034654310393361.
Notes
← 1. Across OECD countries, after accounting for per capita GDP, there was a positive correlation between the share of computers that are portable and equity in reading (partial r = -0.44), mathematics (partial r = -0.43) and science (partial r = -0.41) performance (Table V.B1.5.21). Across all countries and economies, the correlation was not statistically significant.
← 2. The index of equity in the allocation of material resources is the percentage of the variation in the index of shortage of educational materials explained by the PISA index of economic, social and cultural status of the school multiplied by a negative or positive sign, depending on the sign of the relationship. A value of 0 indicates that there is no difference between socio-economically advantaged and disadvantaged schools in the index of shortage of educational materials; positive values (greater equity) indicate that advantaged schools show higher values in the index of shortage of educational materials than disadvantaged schools.
← 3. The correlation was also strong across OECD countries; however, it was entirely driven by two outliers, Colombia and Mexico, which have lower levels of equity in allocation of material resources and lower mean reading performance than other OECD countries. After excluding the countries with the lowest levels of equity in the allocation of material resources (i.e. values lower than -20 in the index), the association remained significant across all countries and economies (R2 = 0.20), but across OECD countries the association weakened substantially (including all OECD countries, the R2 was 0.54; after excluding Mexico and Colombia, the R2 was 0.15).
← 4. As with the index of equity in material resources, the correlation between Internet connectivity and mean reading performance was also strong across OECD countries; however, it was entirely driven by two outliers, Colombia and Mexico, which have less Internet connectivity and lower mean reading performance than other OECD countries. After excluding the countries with the lowest percentage of computers connected to the Internet at school (i.e. lower than 80%), the association remained unchanged across all countries and economies (R2 = 0.57), but across OECD countries the association disappears (R2 = 0.01).
← 5. After excluding low-performing countries/economies (i.e. mean performance in reading lower than 413 points), the strength of the association across OECD countries remained almost unaltered (after exclusion, R2 = 0.14), whereas across all countries/economies, the association strengthened slightly (after exclusion, R2 = 0.10).
← 6. After excluding low-performing countries/economies (i.e. mean performance in reading lower than 413 points), the association across OECD countries weakened slightly (after exclusion, R2 = 0.20), whereas the across all countries/economies the association strengthened markedly (after exclusion, R2 = 0.27).