copy the linklink copied!Chapter 3. The current experience of OECD countries
This chapter presents the results of a survey of the OECD Working Party for Territorial Indicators on the existence of predominant concepts of functional areas in OECD countries. The chapter discusses the current experience of OECD countries and gives and overview of the policy relevance of functional areas. Furthermore, the chapter provides more detailed examples and explanations of six cases where functional areas have become a vital tool for statistical and policy purposes.
This chapter reviews the current experience of OECD countries with the application of functional areas for statistical purposes. It presents an overview of applied methods, types of data sources and implementation strategies to identify functional areas in all territories to support policymaking.
The review of existing practices is twofold. First, the results of a survey on the use of functional areas among member countries of the OECD Working Party on Territorial Indicators (WPTI) are assessed. Second, for selected individual OECD countries, existing practices are scrutinised in more detail. Specifically, approaches for delineating functional areas are compared between a North American country (Canada), the pan-European work conducted by Eurostat, as well as four individual European countries (Estonia, France, Italy and the United Kingdom) that use different concepts.
copy the linklink copied!Survey of OECD countries
In a number of OECD countries, functional areas, or similar geographic concepts such as labour market or travel to work areas, are already well established. In spring 2018, the OECD WPTI conducted a survey on existing concepts and policy use of functional areas. Jointly with an earlier cross-national OECD survey in 2002 that examined the relevance of functional delineation of regions on the basis of travel-to-work areas, the WPTI survey highlights the importance of functional areas in OECD member countries (OECD, 2002[1]).
Nine countries reported that a prominent definition or concept of functional areas exists nationally (Figure 3.1). These nine countries also use their respective functional area concept for policy making, either in underlying analysis, the delivery of policies, their monitoring, or their evaluation, showcasing the relevance and potential of functional areas beyond purely statistical aspects. In contrast, one country identifies functional areas solely for a statistical purpose, i.e. not with specific public policies in mind.
A majority of the responding OECD countries use their functional areas to produce and disseminate official statistics. The data on functional areas include indicators on employment statistics, wages, housing demand and supply. Furthermore, indicators also cover demographic topics such as migration patterns and population dynamics. Finally, various countries also provide mobility and commuting flow data for their respective national functional areas. These indicators provide not only the necessary information for policy design and evaluation in a range of policy areas (see the following section for more detail) but also feed into academic research.
In light of the increasing importance of functional areas, Eurostat initiated in 2013 the Task Force on Harmonised Labour Market Areas to make an official proposal of the European Commission’s position on the subject. The group included representatives of national statistical offices (NSOs) from France, Hungary, Italy, the Netherlands, Poland and the United Kingdom, all of which are OECD member countries. The task force exchanged research as well as existing approaches and new ideas on delineating labour market areas in European Union (EU) countries. It developed a harmonised methodology based on standardised definitions, replicable in all EU countries and presented the final report to the Eurostat Working Group on regional, urban and rural development statistics. Eurostat then launched a grant to produce harmonised national labour market area (LMA) geographies according to the European methodology.1
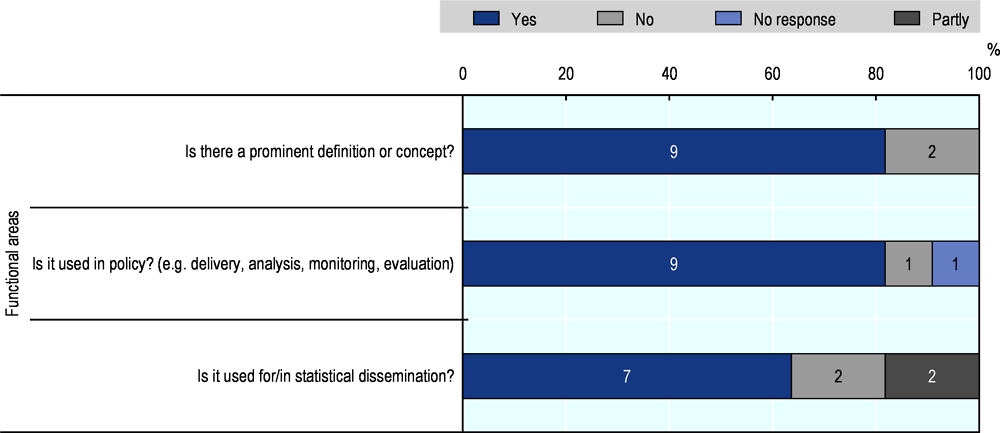
Note: Responses as given by WPTI delegates. Apart from Eurostat, the following members participated: Denmark, France, Germany, Italy, Mexico, the Netherlands, Poland, Spain, Switzerland, the United Kingdom and the United States. No responses were received from the remaining OECD member countries.
Source: OECD Working Party on Territorial Indicators (OECD, 2018[2]).
The grant was the occasion to support the further development of LMAs in Europe in a number of ways. First, Istat developed an information technology (IT) tool, the R package LabourMarketAreas, containing modules to deal with any stage of the LMAs delineation process, from algorithm implementation to fine-tuning, visualisation, analysis and dissemination (see Franconi et al. (2017b). Furthermore, as part of the grant, documentation and training material related to the computation of LMAs, including specific training on the software package R organised by Istat, were published. Finally, the Guidelines for Labour Market Area Delineation Process: From Definition to Dissemination2 were shared among the participants and released. In 2018, Eurostat promoted a task force on Establishment of a European set of labour market areas which aims to be a platform for exchange and reflection regarding possible future refinements but also future challenges to functional areas, i.e. the regular availability of commuting flows data. The task force develops typologies for characterising LMAs and methods to further harmonise and make LMAs comparable across Europe.
copy the linklink copied!Examples of policy application in OECD countries
Functional areas, including functional urban areas (FUAs), have found wide use in policy design, analysis and policy evaluation in OECD countries. Below is a selected but not exhaustive list of topics that demonstrates the variety of subjects that can benefit from functional areas:
-
Employment policies: The most prominent policy domain for which functional areas have been used. In France, the “Macron law” proposes to utilise functional areas as units of analysis for employment policies such as reinforcing competition is certain professions. Germany uses information on several indicators such as unemployment rate and wage rates for its 258 labour market areas to allocate resources from a joint federal/state aid programme for lagging regions.
-
Industrial development: In the United Kingdom (UK), functional areas have been used to target funding for industrial development.
-
Industrial renewal policy: Italy uses labour market areas to first identify territories of industrial crisis and then monitor the effect of revamping policies.
-
Public transport planning: Several countries such as Estonia use data on daily traffic flows in their national labour market areas to improve public transport provision.
-
Housing needs: In the UK, housing market areas have been used to assess housing needs in the country by identifying and comparing local housing supply and demand.
-
Market rents/rent control: The United States uses the geographies of metropolitan areas to assess income limits for rental subsidy programme eligibility. Additionally, metropolitan and micropolitan areas are used to establish maximum loan amounts for federally insured mortgages.3
-
Land use: Travel to work areas in Denmark have proven useful for the analysis of land use and have featured in various publications on that topic.
-
Cross-border commuting: The high level of foreign workers who commute to work in Luxembourg has led to efforts in identifying and analysing cross-border flows and commuting patterns between Belgium, France, Germany and Luxembourg. Similarly, Switzerland has produced cross-border labour market areas to account for the large flows of workers travelling across borders every day.
-
Local government collaboration and restructuring: In order to have a better fit of municipalities with the functional reality of territorial economic linkages, Finland has taken into account the boundaries of its labour market areas.
The list above demonstrates the manifold and diverse possibilities to make use of functional areas in analysis and policy making. The concept of functional areas can help design, monitor and scale programmes and policies at the right geographic level.
copy the linklink copied!Detailed country examples of functional areas
The following subsections describe different existing sets of functional areas in several OECD countries in more detail. The list includes both countries that have functional areas covering the entire national territory (typically with a multidirectional-flow-based approach) and countries that delineate functional areas only for a subset of their territory (typically with a core-flow-based approach). The example of Estonia provides an alternative approach, illustrating how novel sources of data can replace or refine traditional sources of data in identifying territorial linkages.
Several European countries have been working together on the labour market areas (LMAs) concept of functional areas. The collaboration began in 2013/14 with the Task Force on Harmonisation, which aimed to support the switch from national concepts to a common, harmonised EU method. The work was continued with the 2016/17 grant exercise, which focused on efforts to produce national and cross-border LMAs based on a common IT tool. A new task force was initiated in 2018 to establish a European dataset of labour market areas.4
Countries participating in these various activities with the aim of developing a harmonised geography are Bulgaria, Denmark, Finland, France, Germany, Hungary, Italy, the Netherlands, Poland, Portugal, Switzerland and the United Kingdom. It has not been used so far at EU level but several Directorate Generals (DGs) of the European Commission (e.g. Regional and Urban Policy, Employment, and Transport) have expressed interest in utilising LMAs for their work. So far, labour market areas have only found application in analytical publications at the European level. The task force strives to harmonise the concept of labour market areas in Europe to reach its full potential for EU policy making (Eurostat, 2017[3]).
The Eurostat task force computed functional areas for a number of participating countries. The delineation of functional areas in those countries followed an experimental approach agreed upon in the task force. Annex A presents the examples of four participating countries: Bulgaria, Finland, Hungary and Portugal.
The comparability issue is of extreme importance in an international setting. In Europe, harmonisation and comparability are crucial. In the initial task force, a first step has been made with the creation of a common European method. However, it is evident that different countries adopt different parameters because they have different aims, different commuting structures and different distributions in the territories. Therefore, further steps need to be taken to improve comparability. Harmonisation was the key topic of the final workshop of the grant.5 Several ideas came out; in particular, Thomas Thorsen from Statistics Denmark6 suggested two approaches: method and output-oriented harmonisation.
The 2018 task force studies the “method-oriented harmonisation” approach: national (local) LMAs are aggregated to reach European (regional) LMAs. The idea is that the aggregation process made by means of the same R package LabourMarketAreas and common European parameters will lead to comparable functional regions.
Another perspective, the “output-oriented harmonisation”, is based on the definition of common criteria that output should meet. Examples of such criteria could be:
-
All EU LMAs should be more than 50% self-contained – supply side as well as demand side.
-
At least 70% of employed persons should live in EU LMAs that are at least 70% self-contained supply side – and similarly for demand side.
Canada
Statistics Canada has developed two types of functional areas. The first, census metropolitan areas (CMA) and census agglomerations (CA), consist of the area of one or more adjacent municipalities (census subdivisions, CSDs) centred around a population centre (known as the core) (Statistics Canada, 2012[4]). While a CMA needs to have a total population of at least 100 000 of which 50 000 or more must live in the core, a CA must have a core population of at least 10 000 but has no other total population requirement. Municipalities belong to a CMA or CA if they are highly integrated with the core, as measured by commuting flows. CMA and CA delineation methodology imposes a higher commuting requirement than the current OECD functional urban areas (FUAs). A municipality belongs to a CMA or CA if at least 50% of the labour force living in a municipality work in the core of the CMA/CA.
In addition to core-based functional areas, Statistics Canada has also experimented with a functional area geography called self-contained labour areas (SLAs). Compared to CMAs/CAs, SLAs offer much larger geographic coverage. They define all municipalities using commuting data in Canada. Each area consisting of one or several CSDs where the majority of residents both work and live constitute a self-contained grouping of areas (Alasia, 2016[5]). Self-containment has two aspects: i) self-containment of workers (percentage of area jobs that are filled by area residents); and ii) self-containment of residents (percentage of area residents who have jobs in the area). The minimum threshold for self-containment is 75%.
The concepts of CMAs and CAs have found wide use in policy and programme delivery. In contrast, SLAs only contribute to policymaking in some Canadian provinces. Statistically, CMAs and CAs are well established within the national statistical system and a multitude of statistical indicators is available at that scale. For SLAs, some federal departments have started requesting tabulation of labour market indicators using this geography.
United Kingdom
Functional areas have a long tradition in the UK. Travel to work areas (TTWAs) were first delineated and became the official British labour market areas in the 1960s. Today, there are 228 travel to work areas in the UK based on 2011 Census data, of which 149 are in England, 45 in Scotland, 18 in Wales, 10 in Northern Ireland and 6 extend across borders (Figure 3.2).7
TTWAs intend to approximate LMAs. They aim to reflect self-contained areas, i.e. areas in which most people both live and work. Currently, 75% of an area’s resident workforce needs to work in the area and at least 75% of the people who work in the area must also live in the area in order for that area to be self-contained. Furthermore, the economically active population of the area needs to be at least 3 500. In areas with a working population of more than 25 000, the self-containment criterion is only 66.7%, thereby allowing a trade-off between workforce size and level of self-containment.
Coombes (2015[6]) identified the 2011 TTWAs through a matrix of commuting flow data by origin and destination for workers aged 16 and over, based on residence postcode and address of the main job’s workplace, all derived from the 2011 Census. The following statistical geographies are the building blocks for TTWAs in 2011: lower layer super output areas (LSOAs) in England and Wales, data zones (DZs) in Scotland, and super output areas (SOAs) in Northern Ireland.
The Office of National Statistics (ONS) provides a rich set of statistical information on the full set of the 2011 version of TTWAs in the UK. Apart from population data, territorial statistics of TTWAs also cover labour market participation (employment and participation rates, full- and part-time employment and self-employment), social benefits data, educational attainment and other relevant demographic, socioeconomic information such as gender or age, and information on the respective method of travel to work.8
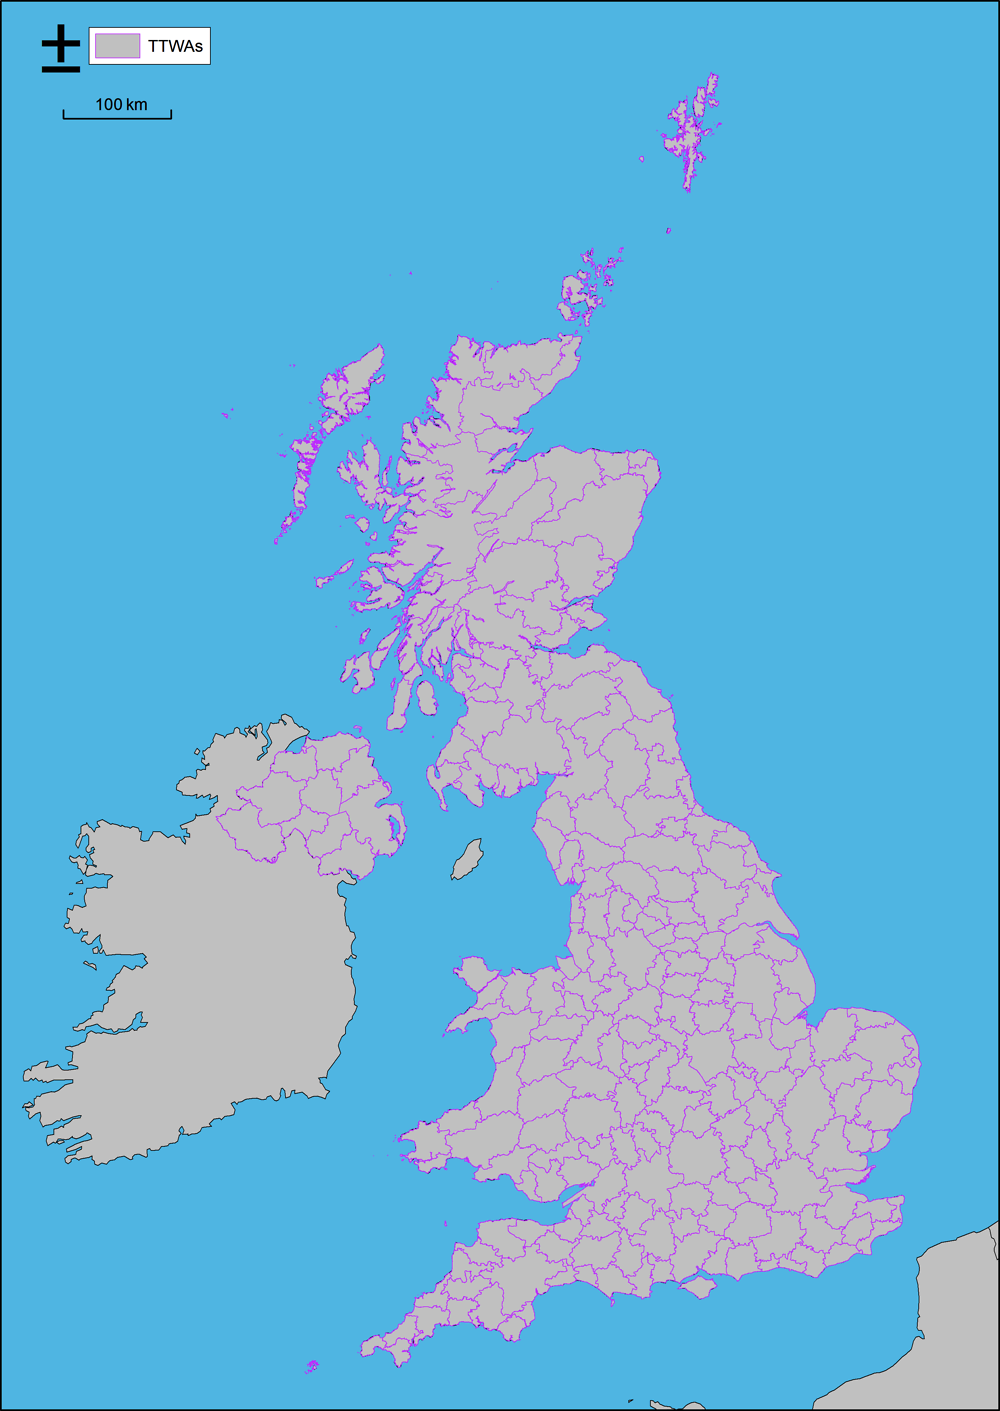
Source: Authors elaboration on travel to work area boundaries (ONS, 2019[7]).
France
The INSEE, the French national statistical office, has developed two types of functional areas. Aires urbaines or urban areas identify the economic extent of cities, i.e. cities and their areas of economic influence. They consist of neighbouring municipalities, encompassing an urban centre (urban unit) that accounts for at least 10 000 jobs and rural districts or urban periphery where at least 40% of the employed resident population works in the centre or in the municipalities belonging to this centre (Insee, 2016[8]).
Following the 2010 zoning of urban areas, this concept has been extended:
-
Average areas: a group of municipalities, without pockets of empty land, consisting of a centre with 5 000 to 10 000 jobs and rural districts or urban units where at least 40% of the employed resident population works in the centre or in the municipalities belonging to this centre.
-
Small areas: a group of municipalities, without pockets of empty land, consisting of a centre with 1 500 to 5 000 jobs and rural districts or urban units where at least 40% of the employed resident population works in the centre or in the municipalities belonging to this centre.
The second major functional area concept is zones d’emploi or employment zones. An employment zone is a geographical area within which most of the labour force lives and works, and in which business establishments can find the main part of the labour force necessary to occupy the jobs on offer (Insee, 2016[9]). The division into employment zones provides a breakdown of the territory adapted to local employment patterns and covers both metropolitan France and the French overseas departments (Figure 3.3). The extended classification of employment zones divides them into six categories: i) densely populated areas with an over-representation of managerial jobs; ii) relatively low specialised areas in terms of the tertiary sector; iii) public service-oriented areas; iv) areas with industrial specialisation; v) low-density areas with an agricultural or agri-food orientation; and vi) areas with a tourism orientation. The current delineation of employment zones rests on the commuting flows from residence to work of active persons observed in the 2006 census. The employment zones find application in several labour policies such as the Macron law.9 Furthermore, the extended classification presents useful information on changes in employment patterns or access to services.
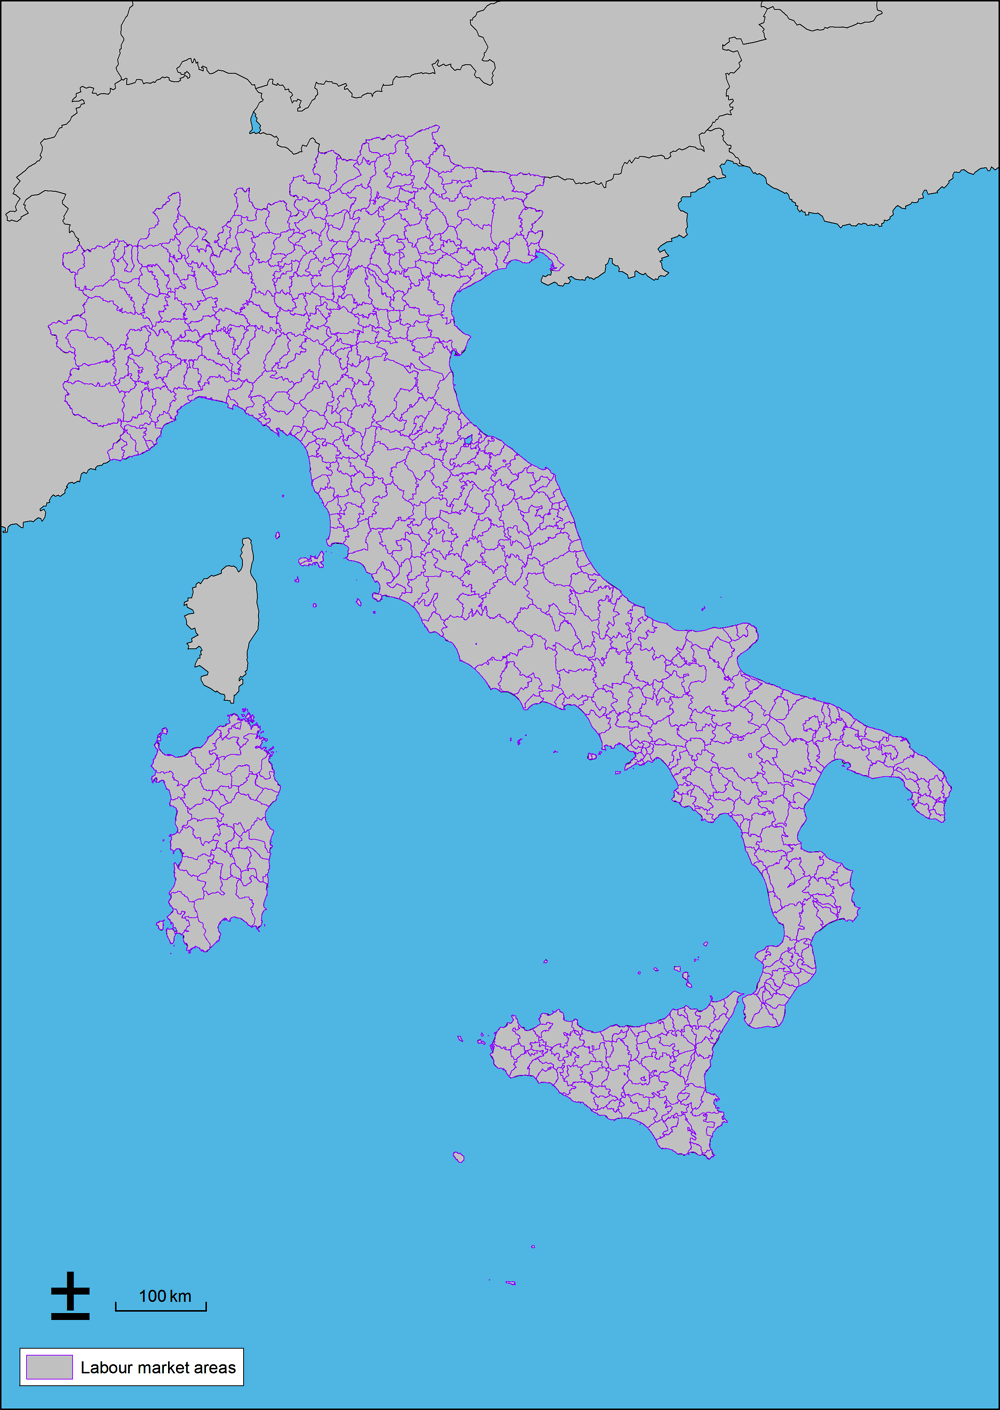
Italy
The Italian National Statistics Institute (Istat) has released the 2011 round (Istat, 2014[10]) of LMAs following a consolidated tradition (1981, 1991, 2001). In Italy, LMAs are developed through an allocation process based on the analysis of commuting patterns between municipalities (LAU2). The Italian 2011 LMAs are based on commuting data stemming from the 15th Population Census using the allocation process implemented in the R package LabourMarketAreas, illustrated in Figure A.C.1 in the Annex C. In total, there are 611 distinct Italian LMAs.
Italian LMAs are not designed to respect any administrative boundary constraints: 56 of them (9.2%) cut across regional boundaries and 185 (30.3%) span across different provinces (TL3). Milan is the biggest LMA in Italy in terms of population size: it encompasses 3.7 million inhabitants, 174 municipalities belonging to 7 out of the 12 provinces in Lombardy (TL2). Rome, with its 3 892 square kilometres, is the LMA in Italy with the largest territory, the smallest being Capri (10.5 square kilometres).10
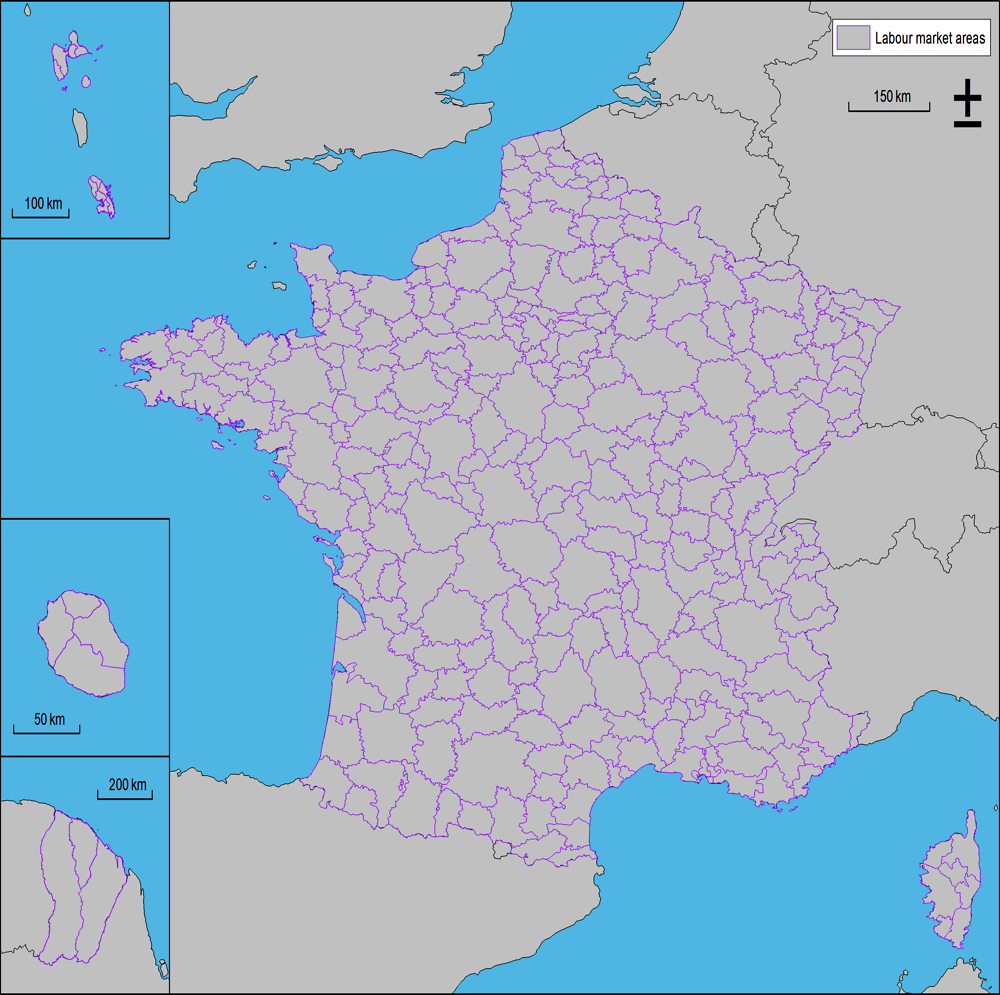
Note: The figure presents French labour market areas.
Sources: Observatoire des territoires (2019); INSEE; Institut d’aménagement et urbanisme de la région Ile-de-France (IAU-IdF).
In order to qualify as an LMA, the local, economically active population of an area needs to be of at least 1 000. In areas with a working population of more than 10 000, the self-containment criterion is only 60%, again acknowledging the potential trade-off between workforce size and level of self-containment.
Nearly half of Italian LMAs (279) fall into the 10-50 000 inhabitant size class, whereas the highest proportion of the population (35.0%) lives in LMAs with 100 000 to 500 000 inhabitants. In 332 LMAs (combing over 70% of the national population), more than three-quarters of the labour force lives and works in the same LMA (self-containment is more than 75%).
The 2011 LMAs show a high level of consistency with the previous 2001 edition: 556 current LMA also exist in the previous list of LMAs (91.0%) and represent 96.6% of the Italian population. Among them, 201 (36.7%) show the same number of constituent municipalities. Due to the merger of two municipalities in the south of Italy, the number of LMAs dropped to 610 in 2018 (Figure 3.4). To characterise these territorial units, Istat has produced several LMA classifications ranging from socio-demographic to cultural and from territorial to the identification of the prevailing economic activities.
Istat releases indicators and statistical data on labour market participation (employment and unemployment rate from 2006 onwards) and labour productivity (from 2015 onwards) for the whole set of Italian LMAs.11
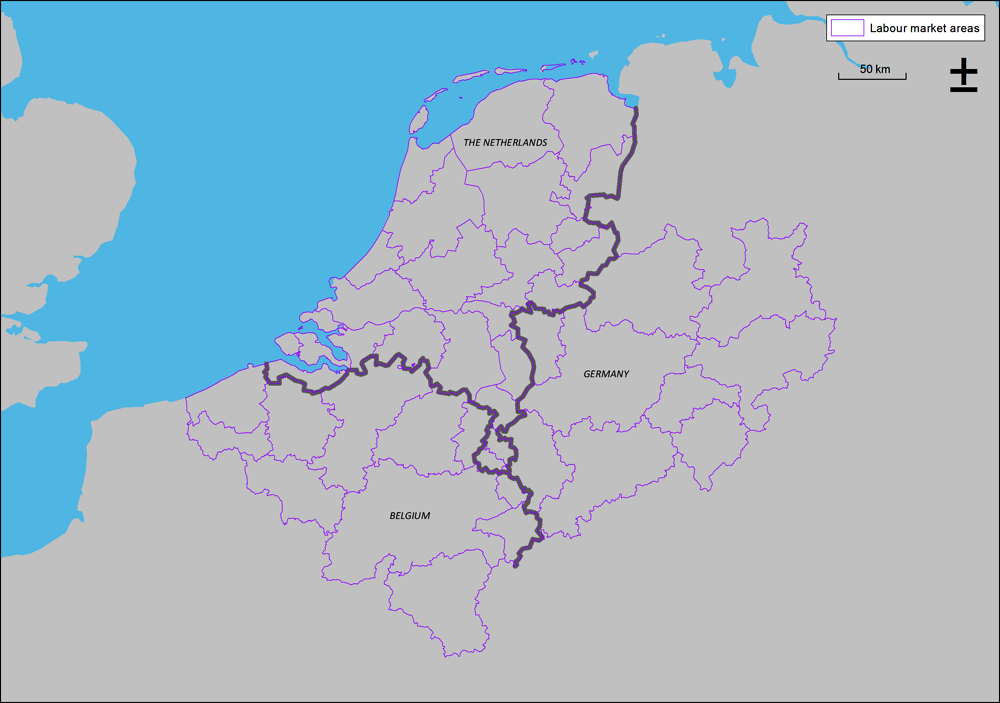
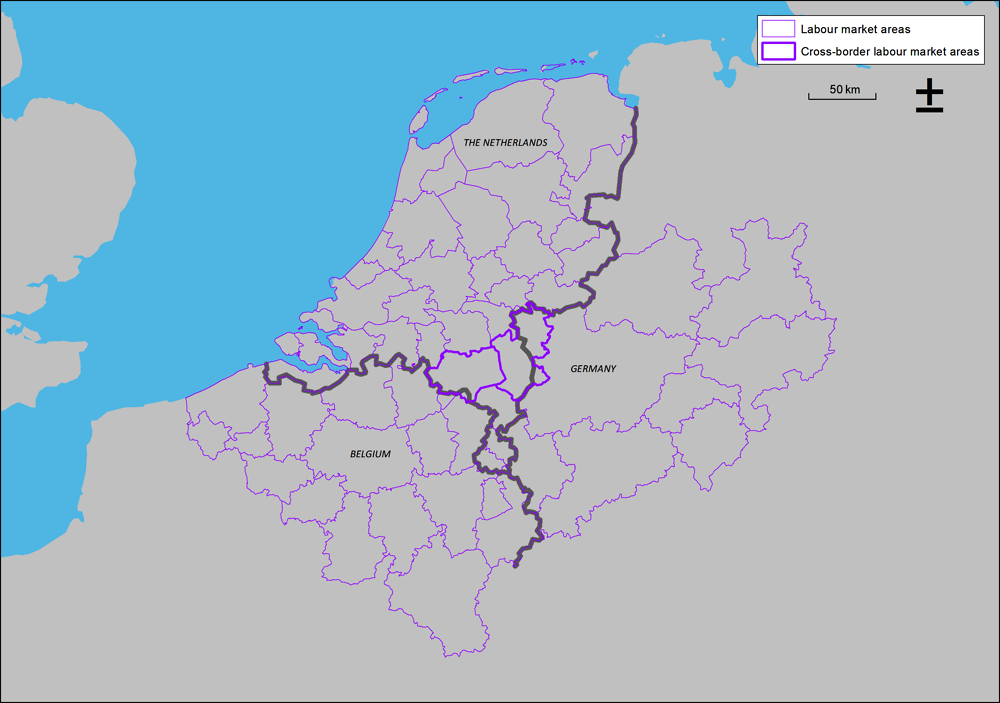
Dutch-German-Belgian cross-border functional areas
In the European Union, freedom of movement of goods, people and labour has led to the emergence of significant transnational commuting flows. Thus, multiple integrated cross-border labour markets have developed over the past decades. Conceptually, the delineation of functional areas can extend beyond the national border. Given the use of functional areas for domestic policy or territorial statistics, countries, however, tend not to consider cross-border flows and identify functional areas only for their national territory.
Including or excluding cross-border commuting flows can have a considerable impact on the configuration of delineated functional areas. As part of an experimental mapping exercise, Statistics Netherlands computed cross-border LMAs at the Dutch-German-Belgian border, a territory characterised by both historically intensive commuting flows and high population density and cross-border economic clusters.
The exercise demonstrated the consequences of ignoring country borders, i.e. of additionally considering cross-border commuting flows (Eurostat, 2017[3]). By including data on employees that are resident in and commute from a foreign region, the exact shape and extent of functional areas changed along the border. For example, considering flows across the Dutch-German border not only generates more logical clusters and gives rise to cross-border LMAs, but it also has large effects on the construction of LMAs inside a country’s boundaries (Figures 3.5 and 3.6). The Statistics Netherlands initiative as well as previous work (Coombes, 1995[11]) indicate the potential benefits of international, cross-border co-operation in terms of data collection and spatial analysis.
Estonia: Mobile positioning data for delineation of functional areas
Estonia offers an illustrative example of the possibilities that new or unconventional sources of data might yield for both identifying functional, territorial linkages and producing territorial statistics for those areas. In Estonia, functional areas have been delineated by mobile positioning data in two studies commissioned by the Ministry of the Interior and conducted by the Mobility Lab of the University of Tartu (Ahas and Silm, 2013[12]; Ahas et al., 2010[13]). These studies have served as an input to administrative reform, such as the Estonian Regional Development Strategy 2014-2020, the National Spatial Plan of Estonia 2030 and several other county spatial plans.
Source: Authors elaboration on labour market areas provided by Istat (2019).
Source: Shapefiles provided by Statistics Netherlands.
Source: Shapefiles provided by Statistics Netherlands.
The methodology for the delineation of functional areas is based on passive mobile positioning data. These data are automatically stored in the memory files of mobile network operators. The Estonian case studies used the most common form of passive mobile positioning data, which are call detail records (CDR). A CDR database contains all call activities initiated by a mobile phone user: incoming and outgoing calls and sent messages (SMS, MMS). Call activities are recorded in the host mobile network, while these are received via the roaming service when abroad. The data contain the following variables: i) a unique identification code for each phone user (usually randomly generated by the mobile network operator to anonymise the database for researchers); ii) the start time of the call activity; and iii) the geographical co-ordinates of the network antenna that provided the network signal for the call activity. The spatial accuracy of passive mobile positioning depends on the geographical division of the mobile network, which is not equally distributed in space. Call activities are initially registered within one second.
Locations of call activities have been considered as a proxy for human presence. Home, work-time location and secondary anchor points for each individual can be identified based on call activities. Anchor points are determined using a special model based on the location and the timing of the call activities of each user over a period of one month (Ahas et al., 2010[14]). The Estonian studies have shown that the locations of the call activities recorded during the course of a long observation period (at least one calendar month) could be used to describe the activity space and important anchor points (residence, work) of an individual rather well (Silm and Ahas, 2010[15]; Ahas et al., 2010[14]). The movements between individuals’ anchor points are aggregated to identify home-work and home-secondary anchors commuting flows. Only the most important secondary anchor point of each individual is taken into account in the aggregation, as there could be several secondary anchors for an individual. For secondary anchor points, it is not known which activities are actually performed at these anchor points; these are most probably related to leisure time activities.
As a next step, municipalities are identified as centres to specify which is the most important working/leisure destination for those moving outside the municipality of residence (home anchor point). Municipalities that are commuting destination for at least three other municipalities are defined as centres. In this way, the centres and hinterlands or city regions were created. It is clear that not all centres are of equal importance. The relative strength (or relevance) of the centres is found using a simple indicator based on the number of municipalities for which the centre is the most important destination. Similarly, the methodology identifies urban regions. An urban region is made up of municipalities, which have intensive communication with the centre. The indicator of the strength of communication is the proportion of the working-age residents commuting to the city centre. In Estonia, the main guideline is to use a threshold level of 30% of the people working in the centre when defining an urban region, i.e. a municipality belongs to an urban region if more than 30% of the working-age population commutes to the centre (Tammaru, Kulu and Kask, 2004[16]). The methodology for delimiting urban regions based on mobile positioning data has not limited the number of commuters to the centre to the working-age population, as the database also includes daily commuting for school-age and retired people.
In the studies described above, the functional regions have been delineated based on municipalities but mobile positioning data also enable the use of smaller spatial units, such as territorial communities (https://mobilitylab.ut.ee/OD/). Equally, in the cited studies, the functional areas have been found to be based on movements within Estonia, but mobile positioning data also allow to estimate flows for cross-border movements based on mobile network operators roaming data. Each mobile network operator can provide data related to its own country (domestic, inbound and outbound) so that movements and directions related to a country can be elicited. For example, the data reveal where people go from Estonia and from where people come to Estonia. If similar data were available for all countries, the same methodology could be used for finding cross-border movements and functional regions. In addition, if there are also social characteristics of the people (for example gender, age, nationality, etc.) taken into account, the commuting flows could be found for different social groups. Functional regions for different types of movers (for example tourists, regular movers, students, etc.) could be identified the same way. Besides physical movements, the mobile positioning data allow delineating the functional areas based on social networks, for example flows between callers’ and calling partners’ places of residence.
The more mobile network operators’ data are included in a structured database, the more comprehensive the dataset becomes. In these studies, data from one mobile network operator were used. The main limitation of using passive mobile positioning data is access to the data because mobile network operators are hesitant to provide it. There is a relatively long value chain of implementing mobile positioning data, which requires expertise from several research fields simultaneously (Ahas et al., 2008[17]). Besides ethical issues and privacy concerns, lack of ground truth data to validate obtained mobility findings have hindered the implementation of the method so far.
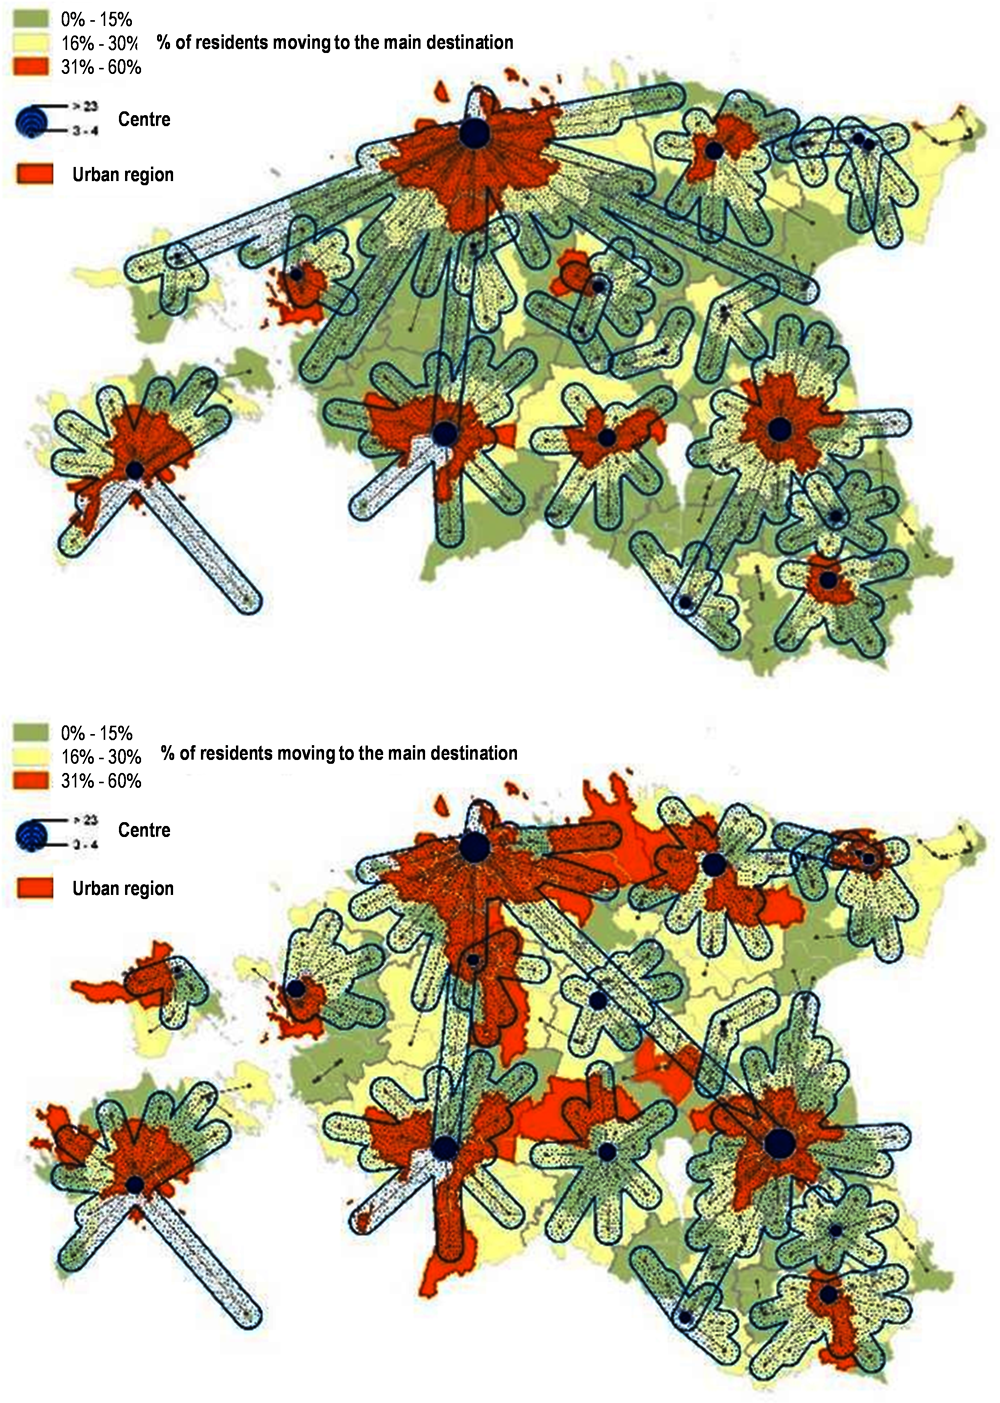
Note: Centres, urban regions and hinterlands found by home and work-time anchor points (top panel) and by home and secondary anchor points (bottom panel).
Source: Ahas, R. et al. (2010[13]), Regionaalne pendelrändeuuring (Regional Commuting Study), Report, Chair of Human Geography and Regional Planning, University of Tartu.
References
[17] Ahas, R. et al. (2008), “Evaluating passive mobile positioning data for tourism surveys: An Estonian case study”, Tourism Management, Vol. 29/3, pp. 469-486.
[12] Ahas, R. and S. Silm (2013), Regionaalse pendelrände kordusuuring (Re-study of Regional Commuting), Chair of Human Geography and Regional Planning, University of Tartu.
[14] Ahas, R. et al. (2010), “Using mobile positioning data to model locations meaningful to users of mobile phones”, Journal of Urban Technology, Vol. 17/1, pp. 3-27.
[13] Ahas, R. et al. (2010), Regionaalne pendelrändeuuring (Regional Commuting Study), Report, Chair of Human Geography and Regional Planning, University of Tartu.
[5] Alasia, A. (2016), “Operationalizing ‘Self-contained Labour Areas’ as a potential standard geography for disseminating Statistics Canada data”.
[11] Coombes, M. (1995), “The impact of international boundaries on labour market area definitions in Europe”, Area, Vol. 27/1, pp. 46-52.
[19] Coombes, M. and S. Bond (2008), “Travel-to-Work Areas: the 2007 review”, Office for National Statistics, London.
[6] Coombes, M. and ONS (2015), Travel to Work Areas, https://www.ncl.ac.uk/media/wwwnclacuk/curds/files/RR2015-05.pdf.
[18] Eurostat (2019), https://ec.europa.eu/eurostat/cros/content/labour-market-areas_en.
[3] Eurostat (2017), The Concept of Labour Market Areas – Summary Report.
[9] Insee (2016), Employment Zone, Institut national de la statistique et des études économiques, https://www.insee.fr/en/metadonnees/definition/c1361.
[8] Insee (2016), Urban Area, Institut national de la statistique et des études économiques, https://www.insee.fr/en/metadonnees/definition/c2070.
[10] Istat (2014), Labour Market Areas 2014.
[2] OECD (2018), Survey OECD WPTI.
[1] OECD (2002), Redefining Territories: The Functional Regions, OECD Publishing, Paris, https://dx.doi.org/10.1787/9789264196179-en.
[7] ONS (2019), Boundaries of travel to work areas.
[15] Silm, S. and R. Ahas (2010), “The seasonal variability of population in Estonian municipalities”, Environment and Planning, Vol. A, pp. 2527-2546.
[4] Statistics Canada (2012), Census Dictionary, https://www12.statcan.gc.ca/census-recensement/2011/ref/dict/98-301-X2011001-eng.pdf.
[16] Tammaru, T., H. Kulu and I. Kask (2004), “Urbanization, suburbanization, and counterurbanization in Estonia”, Eurasian Geography and Economics, Vol. 45/3, pp. 212-229.
Notes
← 1. Functional areas in all territories correspond to local labour markets. In EU countries, the predominant term for this geography is LMA. For EU countries, the terms functional areas and LMAs are used interchangeably.
← 2. https://ec.europa.eu/eurostat/cros/system/files/guidelines_for_lmas_production08082017_rev300817.pdf.
← 3. https://www.hud.gov/program_offices/housing/fhahistory.
← 4. Eurostat has established a dedicated web portal for the work and discussion of the task force on labour market areas in the EU: https://ec.europa.eu/eurostat/cros/content/labour-market-areas_en (Eurostat, 2019[18]).
← 5. Slides available at: https://ec.europa.eu/eurostat/cros/content/labour-market-areas-current-development-and-future-use-rome-16-june-2017_en.
← 6. Available at: https://ec.europa.eu/eurostat/cros/content/optimizing-parameters-%E2%80%93-or-maybe-not_en.
← 7. Mike Coombes from the University of Newcastle led the work producing the 2011 TTWAs in the UK, following earlier work outlined in (Coombes and Bond, 2008[19]).
← 8. For more detailed information see: https://www.ons.gov.uk/employmentandlabourmarket/peopleinwork/employmentandemployeetypes/articles/traveltoworkareaanalysisingreatbritain/2016.
← 9. The full name of the law is “Loi pour la croissance, l’activité et l’égalité des chances économiques”.
← 10. Shape files are available at: http://www.istat.it/storage/sll2011/SLL2011_shapefile.zip.
← 11. More information exists under the following link: https://www.istat.it/en/labour-market-areas.
Metadata, Legal and Rights
https://doi.org/10.1787/07970966-en
© OECD 2020
The use of this work, whether digital or print, is governed by the Terms and Conditions to be found at http://www.oecd.org/termsandconditions.