Chapter 2. Overview of the food and agriculture situation in Latvia
This chapter describes the general geographic, economic, social and environmental context in which the food and agriculture sector in Latvia operates. It also gives an overview of the natural resource base upon which it relies. The chapter outlines the share of food and agriculture in the economy and portrays the sector’s main structural characteristics, its main outputs and markets, and analyses the main trends in agricultural productivity and sustainability.
2.1. General geographic and economic context
The territory of Latvia stretches 450 km from the Baltic Sea in the West to the Russian Federation and Belorussia in the East (longitudes 20 to 28) and 210 km South to North, from Lithuania to Estonia (latitudes 55 to 58). It has a coastline of 531 km (CSB, 2017). Its area is among the smallest OECD members.
There are close to 2 million inhabitants in Latvia (Table 2.1). The share of its population under age 15 is below the OECD average, while the share of its population over age 65 is above (OECD, 2017a). The average population density of 32 inhabitants per km2 masks regional disparities. About 68% of the population lives in urban localities and the capital city of Riga is home to 32% of the Latvia’s population. In the past 20 years, the total population of Latvia has decreased by 20%, with an observed acceleration in a context of economic slowdown during 2009-10, to which both urban and rural areas contributed (CSB, 2017).
A maritime climate with low temperatures and high precipitations prevails almost uniformly across the Latvian territory.1 The temperature averages at 5.9ºC, precipitations at 667 mm and there are 1 790 hours of sunshine per year (LEGMC, 2018). Latvia’s vegetation period is short and the highest temperatures together with the highest precipitations typically occur in July and August.
Since 1995, Latvia’s GDP has been growing at a faster rate than the OECD average and its GDP per capita was slightly below that of other Baltic countries at 63% of the OECD average in 2017 (Table 2.1). Latvia is mostly a services economy (80% of GDP); it ranked first among OECD countries for openness in trade in services in 2017 (OECD, 2018b). Manufacturing accounts for 13% of GDP to which the food industry contributes about 15% of manufacturing value added in 2016 (CSB, 2017).
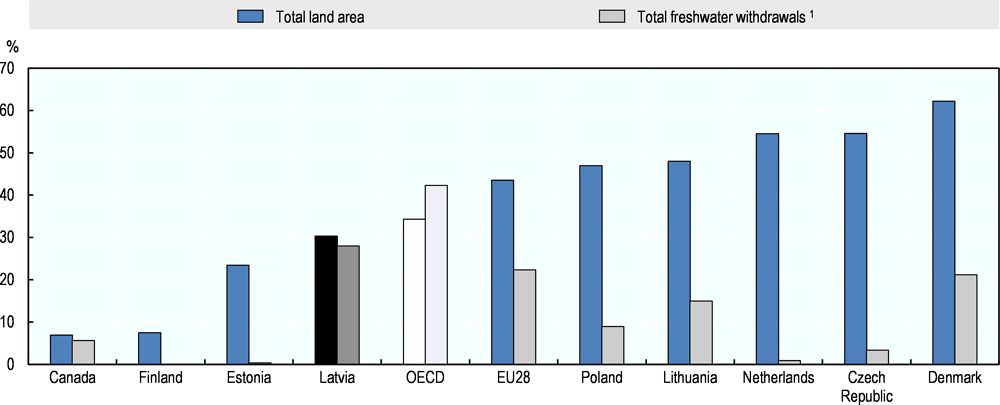
Latvia’s environmental performance is high (Figure 2.1) and no area of national concern has been identified. However, current trajectories of increasing environmental pressures from agriculture, such as increasing fertiliser use and positive balances of both Nitrogen and Phosphorus (i.e. excess application compared to needs), could, if continued, cause problems in the future. Local environmental issues do occur, such as greenhouse gas emissions released from drained organic soils or peatlands (Lupikis et al., 2017). They require careful management.
As a member of the European Union, Latvia implements EU environmental directives and regulations. Latvia ratified the UNFCCC Paris Agreement on 16 March 2017. Per capita greenhouse gas (GHG) emissions are well below EU average as renewable energy, mostly wood, supply around 40% of total primary energy use. Relatively low household incomes and the absence of heavy industry contribute to this favourable situation. Environmental tax revenue, mostly energy and transport-related taxes, make up about 3.7% of GDP and nearly 10% of total government revenue (Eurostat, 2017b; OECD, 2018a).
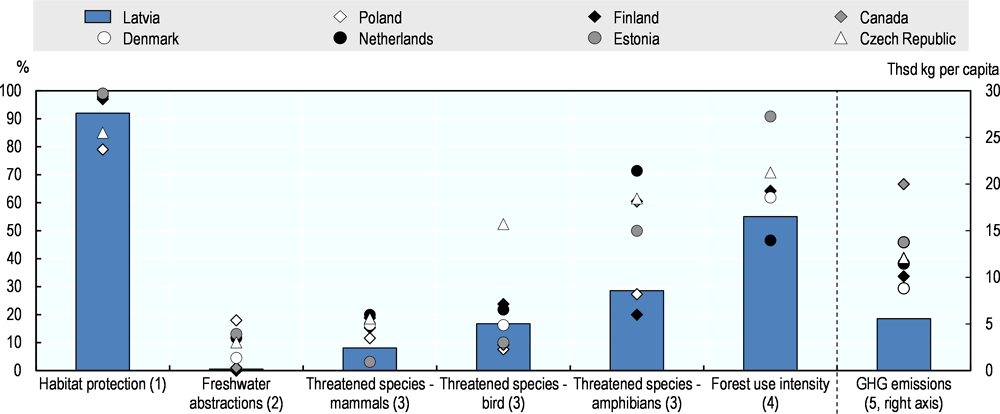
1. Habitat protection: percentage sufficiency of terrestrial sites designated under the EU Habitats Directive for 2013. For Canada, data are not available.
2. Freshwater abstraction: share of gross freshwater abstractions in total renewable freshwater resources for 2015 for Latvia, Poland, Estonia and the Czech Republic, 2014 for Denmark, 2013 for Canada and 2012 for Netherlands. For Finland, data are not available.
3. Threatened species: share of threatened species in total known species (by category) for latest year available, generally late 2000s. For Denmark, data on threatened amphibians are not available.
4. Forest use intensity: ratio of actual fellings to annual productive capacity, expressed as a percentage, for 2014 for Latvia, Denmark, Estonia and the Czech Republic, 2013 for the Netherlands and 2010 for Finland and Poland. For Canada, data are not available.
5. Greenhouse gas emissions: thousand kilograms of greenhouse gas emissions per capita for 2015.
Source: OECD (2018a), Environment (database), http://stats.oecd.org/.
2.2. The role of agriculture in the Latvian economy
Agriculture, hunting, forestry and fishing contribute to about 4% of Latvia’s economy, 16% of trade2 and 7% of employment; a higher share on all accounts than the average of EU and OECD countries (Figure 2.2). The significance of agriculture is even higher in rural areas where it contributes to around 20% of employment (CSB, 2018a).
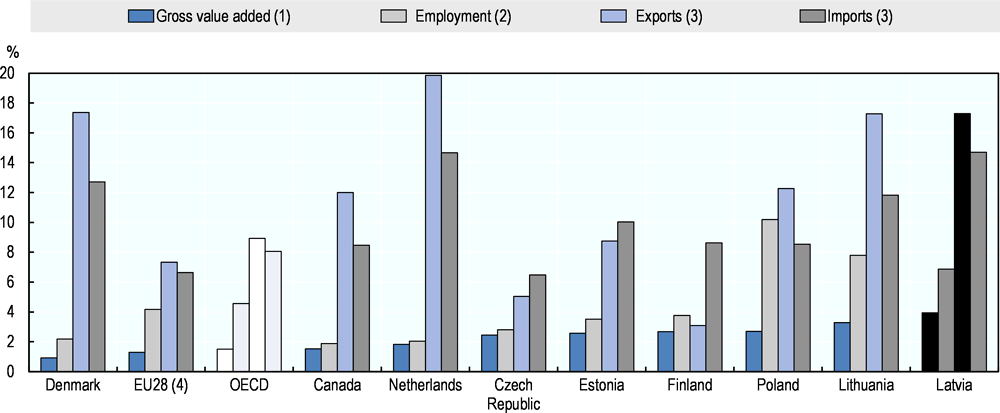
Notes: Countries are ranked according to gross value added levels.
1. Value added in agriculture, hunting, forestry and fishing as a share of total value added. For Canada, data refer to 2014.
2. Share of employed persons, aged 15 years and over, in agriculture, hunting, forestry and fishing in total NACE activities. In most OECD countries, the labour force survey covers the population aged 15 years and over, however both lower and upper limits may vary. In Latvia, the surveyed population is 15-74 years old. Data refer to 2017.
3. The definition of agro-food trade does not include fish and fish products. Agro-food codes in H0: 01, 02, 04 to 24 (excluding 1504, 1603, 1604 and 1605), 3301, 3501 to 3505, 4101 to 4103, 4301, 5001 to 5003, 5101 to 5103, 5201 to 5203, 5301, 5302, 290543/44, 380910, 382360.
4. Extra-EU trade.
Sources: OECD (2018a), System of National Accounts (database) and Annual Labour Force Statistics (database), http://stats.oecd.org/; UN (2018), UN Comtrade (database), https://comtrade.un.org/; Eurostat (2018), Annual National Accounts Main Aggregates (database) [nama10_a10] and Labour Force Annual Survey (database) [lfsa_egan2], http://ec.europa.eu/eurostat/data/database.
Although robust, the growth of the agricultural sector is outpaced by the overall economic growth. Hence the share of agriculture in Latvia’s economy has declined from 3.2% of Gross Value Added (GVA) in 2000 to 1.9% in 2016 and the share of the food processing industry3 is halved to 2.5% (Figure 2.3). The decline of the share of agriculture in the workforce was more rapid than that in GVA, from 12.9% in 2000 to 5.1% in 2017 (Eurostat, 2018; MoA, 2018), whereas employment in the food processing sector was down from 4% in 2000 to 2.9% of total employment in 2016 (Eurostat, 2018).
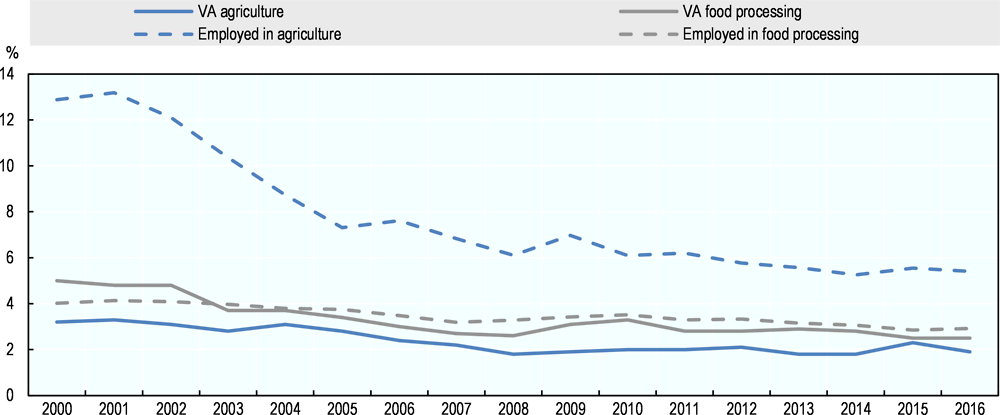
Note: Agriculture includes crop and animal production, hunting and related service activities (A01). Food processing includes the manufacture of food products, beverages and tobacco products (C10-C12).
Sources: CSB (2018), Total gross value added by kind of activity (database) [IKG10_06], www.csb.gov.lv; Eurostat (2018), National accounts employment data by industry (database) [nama_10_a64_e], http://ec.europa.eu/eurostat/data/database.
The share of agro-food products in Latvian exports has doubled since Latvia’s accession to the European Union (Figure 2.4). In 2017, it represented 17% of Latvia’s foreign trade and exceeded the average in EU and OECD countries, comparable to the levels of Denmark and Lithuania (Figure 2.2). After a moderate decline to about 10% in the early years of EU accession, the share of agro-food imports in total imports resumed pre-accession levels at 12.5% in 2008 and represented 15% in 2017. The rapid increases in agro-food export and import values result from commodity prices converging to higher EU price levels and to higher volumes traded through the wider market outlets.
The total area of Latvia is 6.45 million ha, of which 96% is land. In 2015, agricultural land accounted for 29% of the total area of Latvia (i.e. 2.3 million ha, of which 1.9 million ha is accounted for as utilised agricultural area — UAA) (Figure 2.5). The forest cover has increased in the past 25 years and forests currently occupy approximately half of the total land area (CSB, 2017), while swamps represent about 3.4% of the total land area and some areas historically farmed are idle (SLS, 2018). Latvia ranks second in the EU28, behind Lithuania, for arable land per capita (Table 2.1).
The country’s available internal freshwater resources amount to approximately 17 billion m3, nearly 8 500 m3 per capita, close to the OECD average and nearly three times the EU28 average figure. With high levels of water resources per capita, land drainage and related melioration systems play a more important role than irrigation for Latvia’s agriculture.
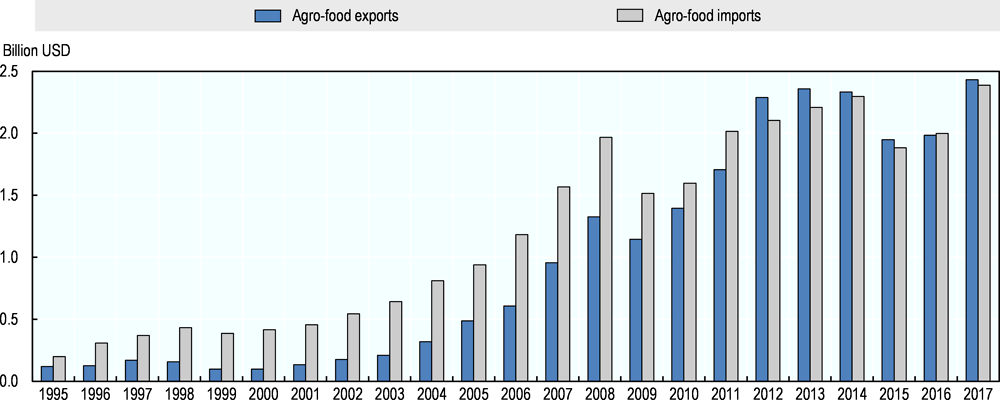
Note: The definition of agro-food trade does not include fish and fish products. Agro-food codes in H0: 01, 02, 04 to 24 (excluding 1504, 1603, 1604 and 1605), 3301, 3501 to 3505, 4101 to 4103, 4301, 5001 to 5003, 5101 to 5103, 5201 to 5203, 5301, 5302, 290543/44, 380910, 382360.
Source: UN (2018), UN Comtrade (database), https://comtrade.un.org/.
Notes: Countries are ranked according to shares of total land area.
1. For the total water withdrawals, 2015 data were replaced by the nearest available year: by 2013 for Canada and by 2014 for the Netherlands. For Finland, data are not available. The OECD and EU28 aggregates were calculated based on the most recent available data.
Sources: World Bank (2018), World Development Indicators (database), http://data.worldbank.org; OECD (2018a), Water: Freshwater abstractions, Environment (database), http://stats.oecd.org/; Eurostat (2018), Annual freshwater abstraction by source and sector (database) [env_wat_abs], http://ec.europa.eu/eurostat/data/database.
Land use changes
After a sharp decrease, from 2.5 million ha in 1990 to 1.6 million ha in 1999, the UAA expanded between 2004 and 2006 but stayed below pre-1990 levels (Figure 2.6). This increase is partly explained by the introduction of the EU Common Agricultural Policy’s (CAP) area payments and by the widened market opportunity for the farm sector that resulted from EU accession. Until 2014 only land that had been identified as responding to specific conditions4 prior to 30 June 2003 within the UAA and was available for farming, was eligible for CAP payments. Notwithstanding, other land converted to agriculture became eligible for payments after 2014.
Currently the total agricultural land area covers 2.3 million ha of both utilised and unutilised agricultural land, including areas overgrown with bushes and trees (CSB, 2017). An assessment carried out in 2014 by the LLU estimates the potential for Latvia’s UAA to expand to up to 2 million hectares. Idle areas could be brought into either agricultural or forest usage (SLS, 2018) or any other sustainable land use, in line with the EU assessment on the consequences of farmland abandonment that result in uniform ecosystems and biodiversity loss under certain conditions (EU, 2011).
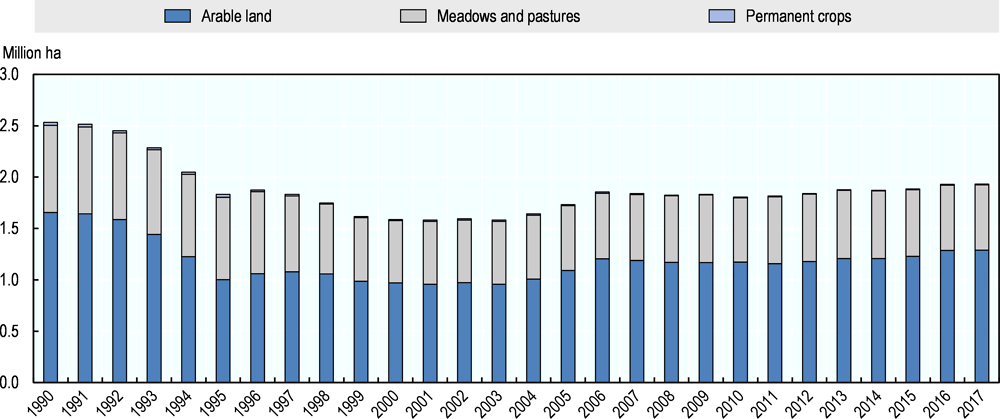
Note: Utilised agricultural area consists of arable land, meadows and pastures and permanent crops.
Source: CSB (2018), Farm structure survey and agricultural census, Land use (database) [LSSA13_II02], http://data1.csb.gov.lv.
In 2017, the share of arable land reached 67% of utilised agricultural land, compared to 60% in 2003, mostly reflecting cereal production growth. Permanent meadows and pasture land accounted for 33% and the area of permanent crops was relatively small (0.4%) (Figure 2.6).
In 2016, there were fewer than 70 000 farms in Latvia, only half their number in 2000. Farms with less than 5 ha have decreased by 67%. Small farms; typically with one or two livestock units, often non-commercial, account for most outgoing farms. The number of specialised farms has dropped most rapidly in dairy and pig farming. Growth opportunities are limited for smaller farms facing increased production costs and lack the capacity to invest in new production systems and land. More attractive employment opportunities outside agriculture and abroad, as well as an ageing farmer population with no successors have also contributed to this decline.
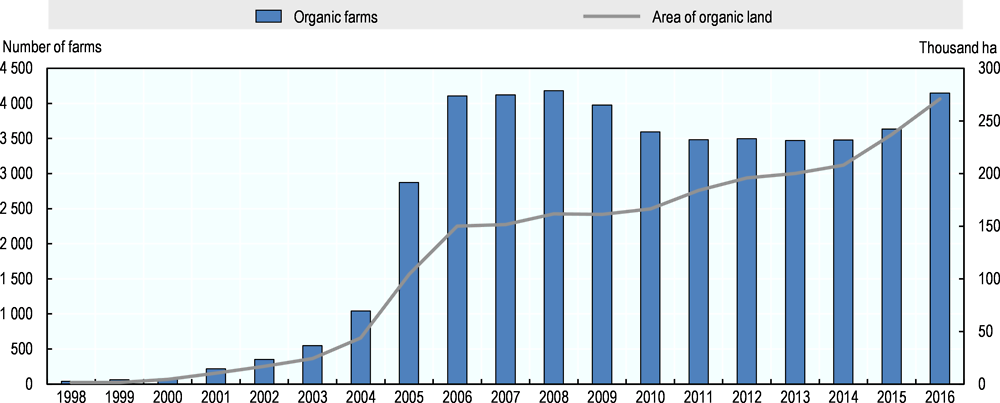
The area under organic farming was slightly above 271 000 ha in 2017, which is about 14% of total UAA, more than in most EU Member States. Perennial grassland, meadows and pastures and cereals make up the largest share of area under organic farming while dairy farming leads in the organic livestock sector (MoA, 2018). The rapid development of certified organic agriculture in Latvia began with the introduction of CAP organic farming payments after accession to the European Union in 2004 (Figure 2.7). From the use standpoint, organic products sales also increase every year, however supply exceeds demand as part of the organic production is sold to conventional processors. This is the case for half (52%) of organic milk and eggs production. Whereas a larger share of organic meat and grain are valorised as organic 65% and 70% respectively in 2017 and 88% of organic vegetables reach consumers in the organic value chain (MoA calculations based on Agricultural Data Centre (ADC) data, 2018).
Sources: MoA (2012), MoA (2017).
Agriculture in Latvia has a dual structure. While 64% of farms have a standard output below EUR 4 000, the standard output exceeds EUR 100 000 in nearly 3% of farms. These farms contribute 62% of the total agricultural standard output and their contribution is growing (Figure 2.8). Farms with 100 ha and more in production account for 3.5% of the total number of farms and hold more than half of the UAA (CSB, 2017). At the other end of the spectrum 90% of farms hold less than 30 ha of UAA, altogether they used about 30% of the total UAA in 2013. Non-commercial farms market no agricultural production; they include households with agricultural land, kitchen gardens and subsistence and hobby farms. They typically hold less than 30 ha and account for 46% of all farms in 2016, a 16% decline since 2010 (Table 2.2).
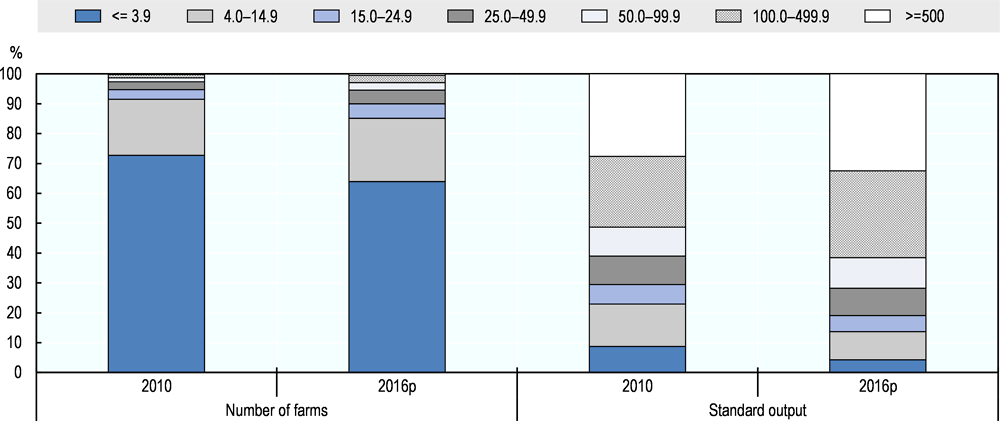
Note: Data for 2016 are provisional.
Source: CSB (2018), Farm structure survey and agricultural census, Economically active agricultural holdings (database) [LSSA13_I07], http://data1.csb.gov.lv.
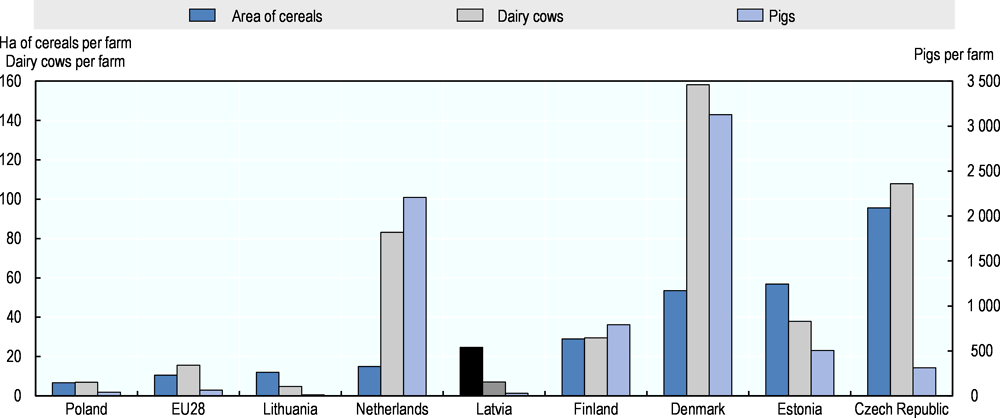
At the same time, average farm-sizes have increased. In 2016, the cereal farm size was 31 ha, the average dairy farm held 9 dairy cows and a significant increase was also observed in pig farms, with an average of 76 pigs per farm, compared to 11 pigs in 2005. Compared to other EU countries, the average farm size in Latvia is still one of the lowest in dairy and pig farming, while the average size of cereal farms in Latvia exceeds the EU average size considerably (Figure 2.9).
Despite the fall in the number of farms, the structure of farm ownership is practically unchanged since 2000; most farms in Latvia are owned by a natural person as the sole holder (98.3%) and only 0.2% of farms are owned by a legal person (CSB, 2017). Nearly half of the total UAA used by commercial farms is rented. This share compares to 44% in 2003 (EU FADN, 2017).
Note: Countries are ranked according to average cereal farm-size.
Source: Eurostat (2018), Farm Structure Survey (database) [ef_m_farmleg], http://ec.europa.eu/eurostat/data/database.
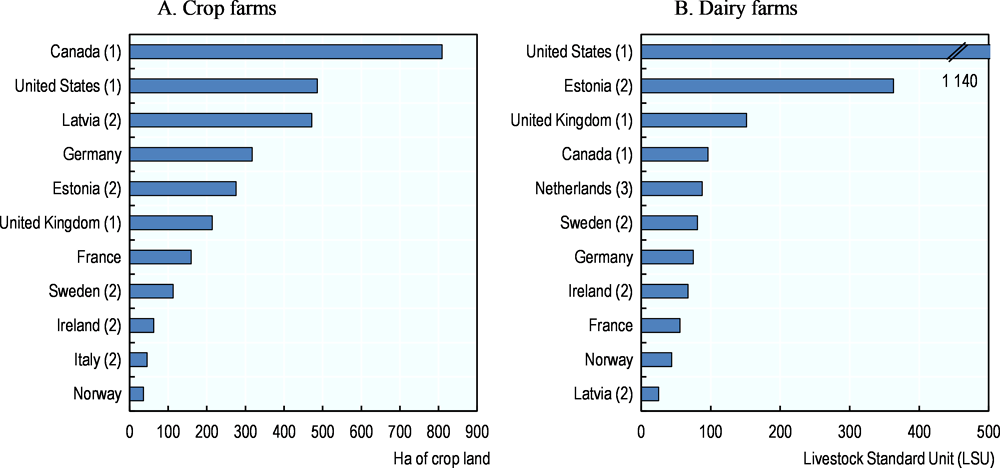
Based on analysis of the FADN survey, which covers farms with a Standard Output higher than EUR 4 000, the mid-point farm size in crop farms in Latvia was 472 ha in 2010, which is higher than most represented countries (Figure 2.10, Panel A). Alternatively, the mid-point farm size for crop farms falls to 7 ha when taking into account all farms declared for the CAP area payment. In the dairy sector, and based on the analysis of the FADN, the mid-point farm size was 25 livestock units, which is the smallest indicator among the analysed countries (Figure 2.10, Panel B).5
Notes: Panel A: The mid-point farm size applied to crop farms is the hectare-weighted median. It corresponds to a farm size that separates the farm size distribution into two parts: 50% of the total area of the national farmland operated by the crop farms of a larger size and the other 50% by the crop farms of smaller size than the hectare-weighted median. Panel B: The mid-point statistics used to measure the distribution of dairy farm size is the livestock unit-weighted median.
1. Data for 2010 are replaced by the nearest available year: by 2011 for Canada, by 2009 for the United Kingdom (England) and by 2012 for the United States.
2. Based on sample data. For Latvia and Estonia, it excludes farms with a Standard Output less than EUR 4 000, that is 64% of Latvian farms.
3. For the Netherlands, data are on all farms having cropland and dairy cows, respectively.
Source: Bokusheva and Kimura (2016).
Farm income and wealth
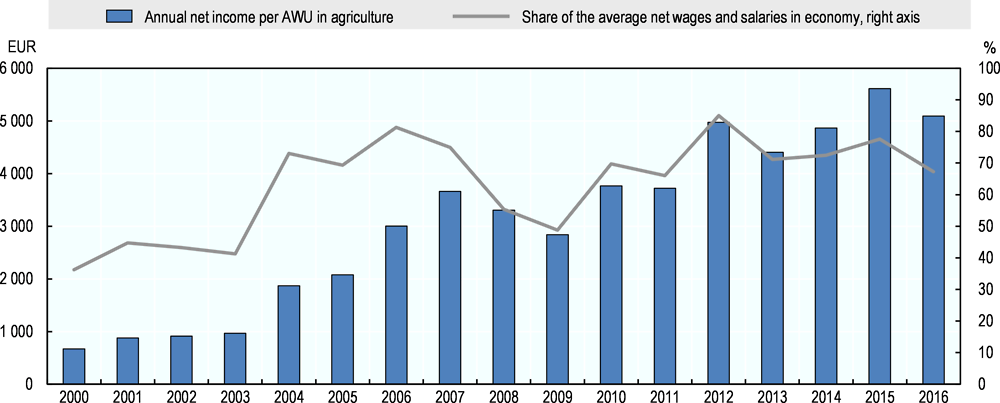
Agricultural income in Latvia has increased significantly in real terms, from less than EUR 1 000 net annual income per full time employee (for all labour) in 2003 to EUR 5 100 in 2016. About 76% of the total labour input in Latvian agriculture is unpaid family labour. While the annual income for all labour compares to 67% of the economy wide average net wages and salaries (Figure 2.11) the net average salary of paid labour in agriculture, forestry and fishing is almost aligned (96%) with the average salary level in economy at EUR 7 572 annually in 2016 (CSB, 2017). The net average agricultural income takes into account agricultural support and income taxes. The most rapid increase was observed in 2004, when it almost doubled with the introduction of CAP support after accession to the European Union (MoA, 2009). Currently, Latvian farmers’ income compares to about 50% of the EU28 average farmer income (Eurostat, 2017d).
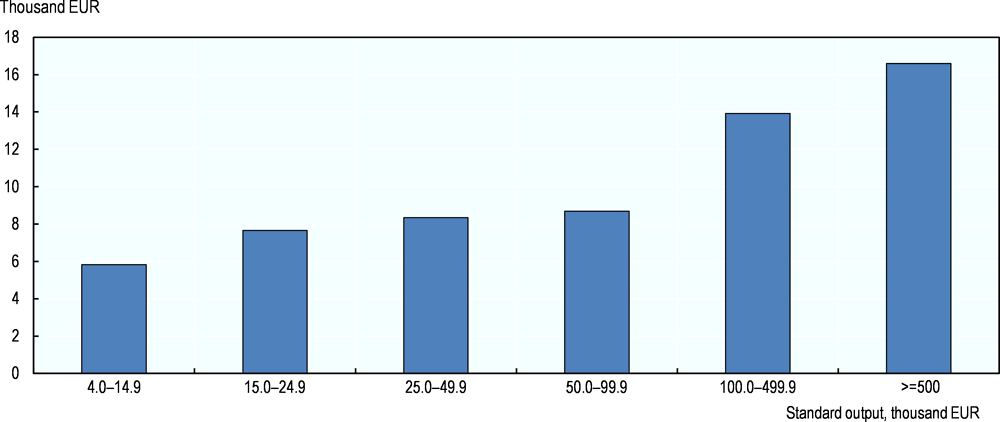
The income distribution by size groups of farms shows that the highest incomes per work unit are earned by farms with a Standard Output above EUR 100 000, where they are almost twice higher than the overall average (Figure 2.12). Small farm holders, especially in the smallest group, rely on sources of income outside farming.
Sources: AREI EAA (2017); CSB (2017), Social Processes (database) [DIG020], http://data1.csb.gov.lv.
Note: Gross income is calculated from net value added subtracting rents and interest payments.
Source: AREI FADN (2017).
The food processing and retail
Food processing is a large contributor to Latvia’s relatively small manufacturing sector. In 2017, it contributes one-fifth of manufacturing value added (MoA, 2018).
The Latvian food culture is based on local products. In turn, the Latvian food industry is mainly focused on the internal market and offers local consumers a large variety of local products. About 65% of the food and drink industry production is consumed on the domestic market. Food processing and retail serve a population who, on average, spend 26% of their monthly income on food. The average food basket is composed of meat products (24%), dairy products and eggs (19%), bread and grain products (15%) and vegetables (13%) (CSB, 2018).
About 1 100 enterprises operate in the food and drink processing sector of Latvia, 30% more than in 2005. This mostly reflects an increased number of enterprises with less than nine employees and fewer businesses in other groups (CSB, 2017). Compared to 2000, the contribution of the food processing industry to the economy has declined in terms of employment and value added. The sector’s share of employment was down from 4% to 3.1% of total employment in 2014 (Eurostat, 2018) and its share in total value added was halved, down to 2.5% in 2014 (CSB, 2017) (Figure 2.3). Food retail is an important component of the retail sector: it accounts for 16% of retail employment and 41% of retail turnover in 2017; a 3.9% increase compared to the previous year.
Less than 2% of food processing enterprises have more than 250 employees; they contribute about one-third of the total turnover of the food sector in Latvia. While a similar structure is observed in other countries, the average turnover across all size-classes of the Latvian food industry is among the lowest in the European Union (Table 2.3).
The processing of dairy products (25% of total turnover), and meat and meat products (22%) have been Latvia’s main food processing sectors. In 2015, 44 companies operated in the milk processing industry and had an average turnover of EUR 8.4 million per company. There were 151 enterprises involved in meat processing, with an average turnover of EUR 2.1 million (CSB, 2017).
The small size of the domestic agricultural production, combined with a weak freight infrastructure, seem to limit opportunities to scale up or develop processed food products. Furthermore, having very few internationally recognised brands and a small-scale production capacity limit export opportunities in non-price based competition. As is the case for other sectors, better integration in global value chains would help overcome domestic market size limitations and improve prospects for the Latvian food industry (OECD, 2017a).
2.3. Agricultural output and trade
Output
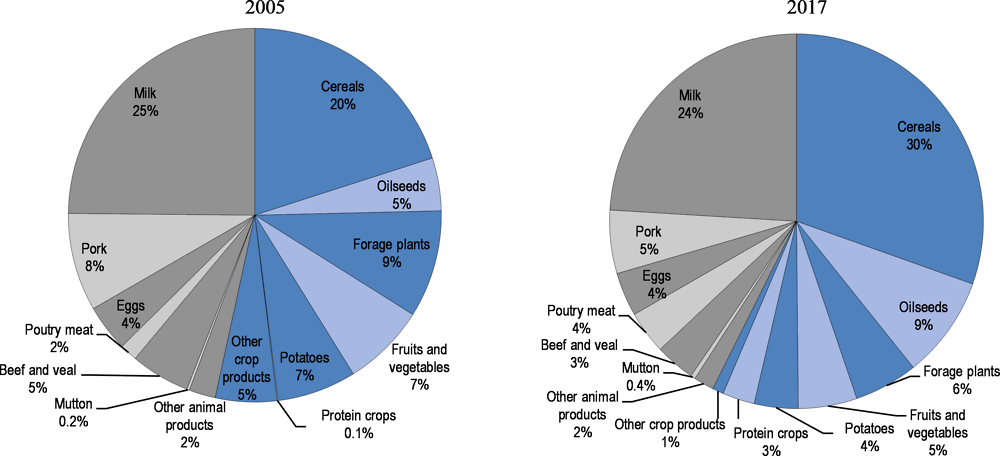
Overall crop production contributes 57% of the total value of Latvian agricultural goods output in 2017, an increase from 53% in 2005. Cereals and dairy farming make up most of Latvia’s agricultural output, they account for 30% and 24% respectively of the total agricultural goods output in 2017, while the share of meat production was about 13% (Figure 2.13).
Note: Commodities are grouped by sector then sorted according to their output levels in 2017. Numbers may not add up to 100 due to rounding.
Source: Eurostat (2018), Economic accounts for agriculture (database) [aact_eaa01], http://ec.europa.eu/eurostat/data/database.
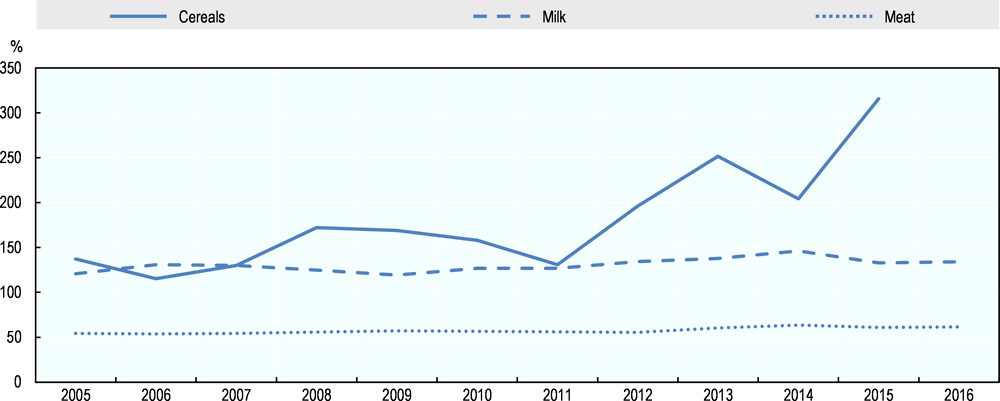
Latvia’s cereal production is export oriented and the sector produces more than three times the level of domestic consumption (Figure 2.14). The increase in milk production combined with the more rapid increase of deliveries have strengthened the sector’s export capacity of both processed and raw milk. Raw milk makes up more than half of dairy exports, primarily exported to Lithuanian dairy processing enterprises.
The meat sector has a smaller share in Latvia’s agricultural output and while individual commodity shares have changed over time, pig meat remains the primary meat commodity produced. Production is below domestic needs for pig and poultry meat.
Note: Self-sufficiency is calculated as volume produced less total domestic consumption (in primary product equivalent).
Source: RSS (2017), Agricultural product balance sheets.
Trade
Beverages, cereals, dairy, fish and fruits are Latvia’s five most traded agro-food commodity groups and together make up more than half of Latvia’s agro-food trade. Beverages are Latvia’s largest agro-food imports (18%) re-exported in a large proportion, while imports of fruits, fish, meat, cereals and dairy each account for 6% to 8% (Table 2.4). Latvia’s exports of cereals and beverages each account for around 20% of the total agricultural and food export value in 2016. Dairy products and fish6 contribute a significant proportion, 10% and 6% respectively. In terms of trade balance of agricultural and food products, the most positive contribution is made by cereals, followed by dairy products, oilseeds, beverages, meat and fish products, as well as live animals with a significantly smaller contribution (Table 2.4). According to the UN Comtrade database, the negative trade balance was reversed in 2012; however, the trade surplus has narrowed since (Figure 2.4).
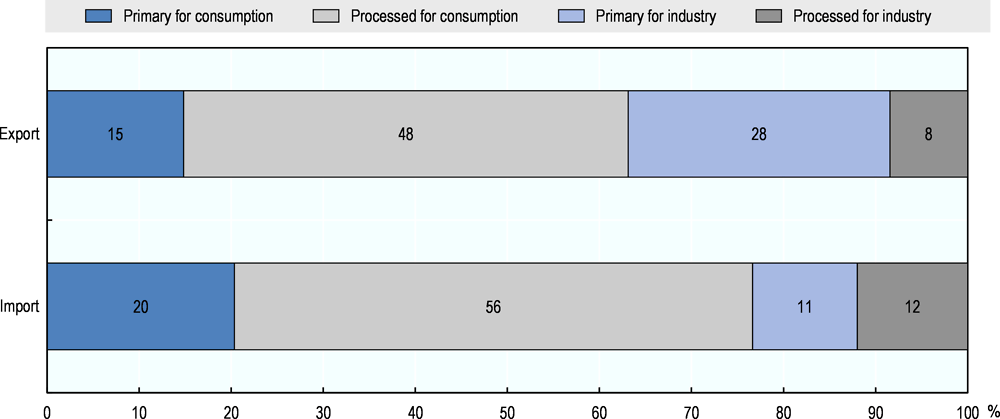
Households’ final consumption absorbs 77% of agro-food imports, of which processed products alone account for more than half of the total agro-food imports. Latvia mainly exports processed agricultural and food products for household consumption and primary products for processing (Figure 2.15).
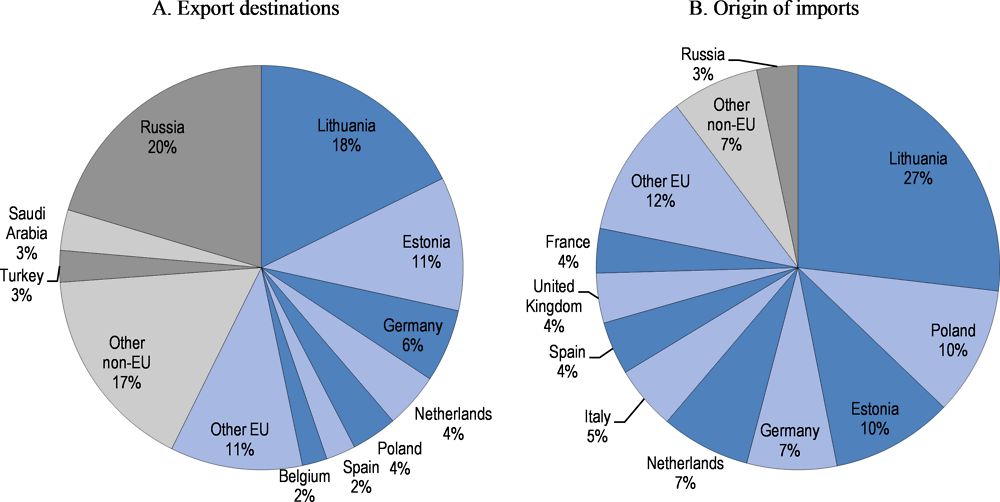
The European Union is Latvia’s main trading partner. In 2017, it was the export destination for 57% of Latvian agro-food products, of which 28% to other Baltic States, and sources 90% of Latvian imports. Lithuania alone accounts for more than one-fourth and, together with Estonia, the two Baltic States account for 37% of Latvian imports and Poland another 10%. The share of export to the Russian Federation amounted to 20% in 2017 (Figure 2.16).
Note: Numbers may not add up to 100 due to rounding. The definition of agro-food trade does not include fish and fish products. Agro-food codes in H0: 01, 02, 04 to 24 (excluding 1504, 1603, 1604 and 1605), 3301, 3501 to 3505, 4101 to 4103, 4301, 5001 to 5003, 5101 to 5103, 5201 to 5203, 5301, 5302, 290543/44, 380910, 382360.
Source: UN (2018), UN Comtrade (database), https://comtrade.un.org/.
2.4. Trends in productivity
In the 1990s, Latvian agriculture was characterised by a negative trend in output and input. Since the early 2000s, the TFP growth has been key to output recovery as inputs have declined on average while output growth has been positive (Figure 2.17).
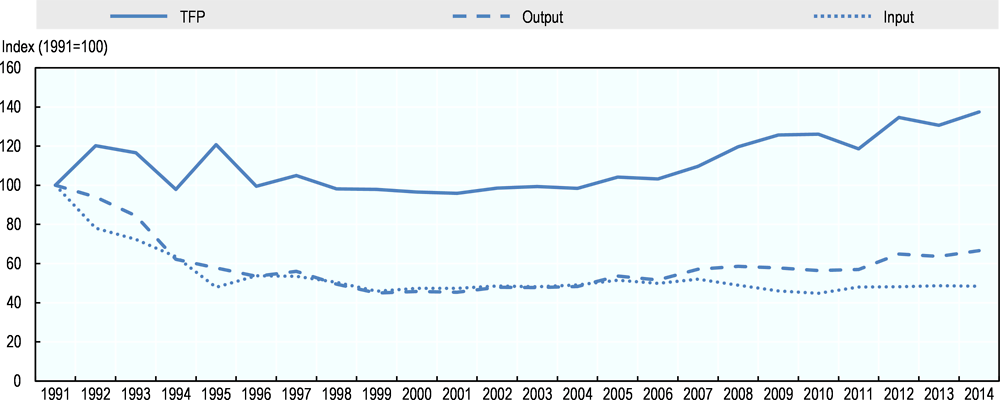
Source: USDA (2017), Economic Research Service, International Agricultural Productivity, www.ers.usda.gov/dataproducts/international-agricultural-productivity.aspx.
As shown in Table 2.5, the negative average input growth masks different paths of input elements. On average and since 1991, labour has declined, while the growth of machinery has been positive. The average growth of the land area and of fertiliser use have been positive during 2004-14 and livestock numbers have stabilised (Table 2.5).
Advanced production technologies apply in some parts of the sector and increase labour productivity. Since joining the European Union, the volume of on-farm investment has increased significantly. In the period from 2004 to 2016 approximately EUR 3.2 billion was invested. Around 65% of investment in holdings have been in machinery and equipment (including transport vehicles), while 30% in buildings and construction. While around two-thirds of investments has been made thanks to investment support, other measures have also contributed. The investment support for the RDP 2007-13 alone has contributed to an increase in labour productivity in agriculture by around EUR 2000 per annual work unit (AWU). Investment has contributed to a 3.5 times increase in agricultural incomes during the period from 2003 to 2017 and the average income for full-time employees has increased by more than six times (from EUR 970 to 6250/AWU). The value of output has increased 2.65 times (Eurostat, 2018). By investing in the most productive seed materials and animals of breeds with higher genetic material in herds, crop yield and milk yield have also increased.
While labour efficiency is less of an economic concern for about half of the agricultural producers who are engaged in non-commercial farming, Latvian commercial farms face increasing domestic production costs, in particular labour, land and inputs. They also face costs imposed by weak transport infrastructures and distance to first consumers and export destinations. The weather conditions combined with the short vegetation period are also part of the production costs equation together with changing market conditions and distortions created by the differences in support levels in, and choices of instruments by, EU Member States. Recourse to risk management tools is part of the farm-level management response-package together with productivity investment choices that contribute to the farm competitiveness through time.
The agricultural TFP growth in Latvia from 1991 to 2014 was the most rapid among the Baltic countries, and part of the faster growth countries when compared to other EU Member States (Figure 2.18).
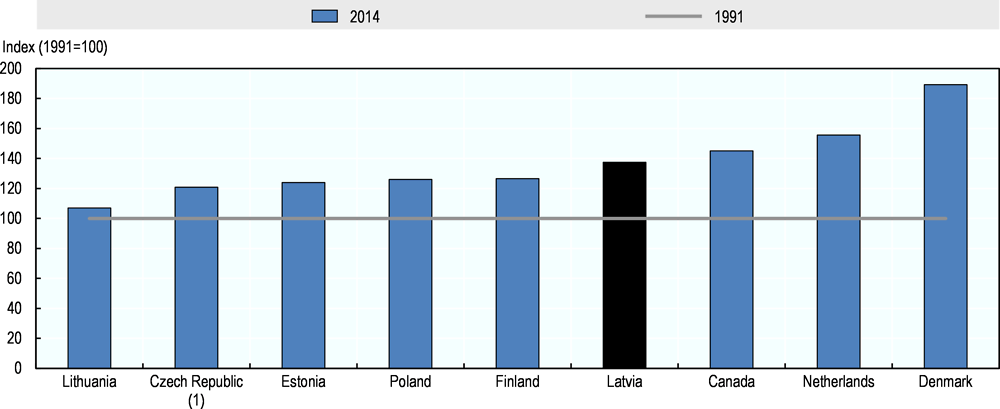
1. Data for the Czech Republic and the Slovak Republic are aggregated under “Czech Republic”.
Source: USDA (2017), Economic Research Service, International Agricultural Productivity, www.ers.usda.gov/data-products/international-agricultural-productivity/.
Crop yields
During the last 25 years, cereal yields, mostly wheat, have nearly doubled in Latvia. The fastest yield increase was observed in the most recent five years. In 2015, thanks to favourable weather conditions, wheat yield hit a record five tonnes per ha (CSB, 2017). Although wheat yield in the Baltic States has increased faster than in the other analysed countries it still lags considerably behind the more intensive agricultural systems such as Denmark and the Netherlands (Figure 2.19). Rapeseed yields increased almost by half from 2004 (CSB, 2017). Rapeseed production is export-driven and feeds into the development of the EU, mostly German, biofuel sector (CSB, 2017).
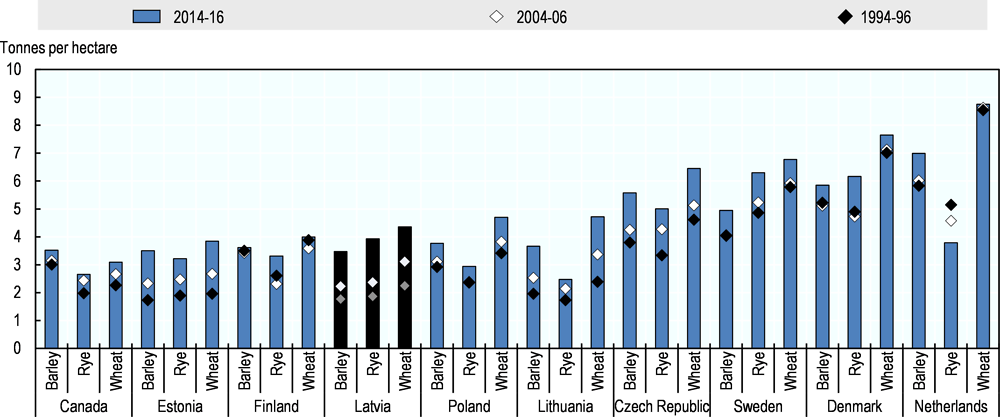
Note: All cereals harvested for dry grains. Countries are ranked according to wheat 2014-16 levels.
Source: FAO (2018), FAOSTAT, Crops (database) [Yield], www.fao.org/faostat/en/.
Milk yield
Despite fewer numbers of dairy cows, the increase in yields in a more intensive and efficient dairy sector allowed a higher volume of milk to be produced. The average milk yield in Latvia grew by 4% annually and reached 6.2 tonnes per cow per year in 2016 (CSB, 2017). Compared to other countries, Latvia’s milk yield is still about 30% less than the more productive countries represented in Figure 2.20.
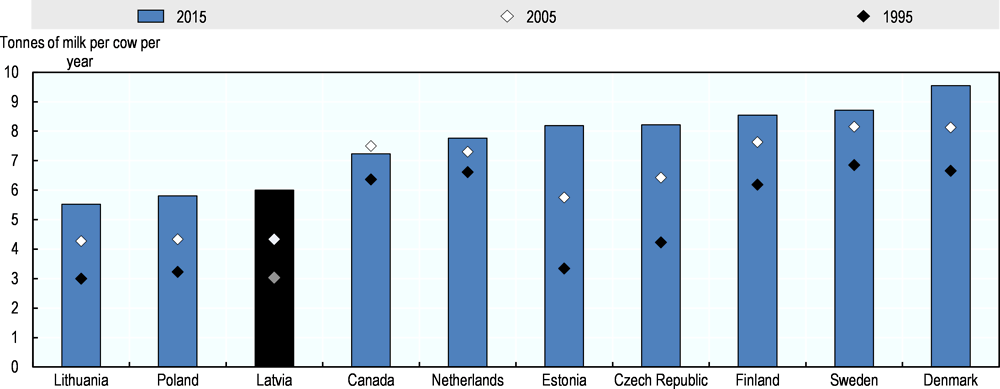
Note: Countries are ranked according to 2015 levels.
Source: FAO (2018), FAOSTAT, Livestock Primary (database) [Yield: Milk, whole fresh cow], www.fao.org/faostat/en/.
Food processing
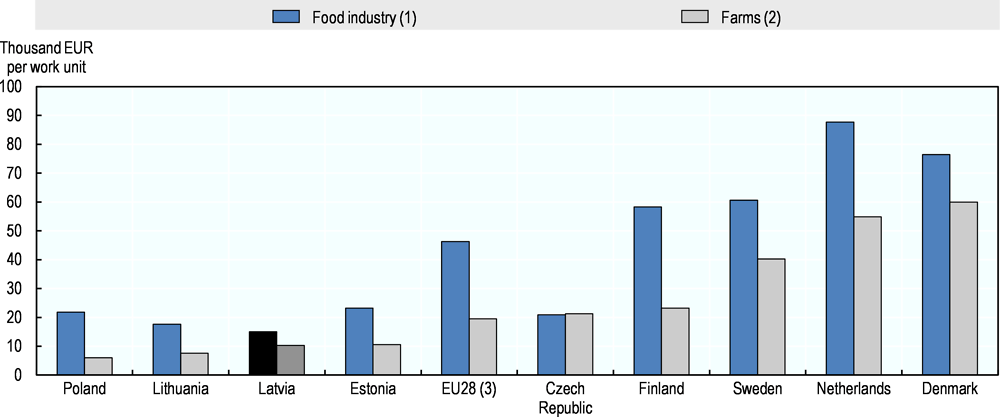
The food processing labour force was reduced by one-third since 2005. Despite substantial productivity growth, labour productivity in the Latvian food processing sector is very low, in line with other sectors of the economy and only slightly higher than in the primary sector (OECD, 2017a and CSB, 2017). Labour productivity in both the primary and food processing sectors is lower than the EU averages (Figure 2.21).
Notes: Countries are ranked according to farm labour productivity levels.
1. Value added at factor costs. Work unit refers to number of persons employed.
2. Farm net value added. Work unit refers to annual work unit.
3. For the food industry data, the EU28 data refer to 2015.
Sources: Eurostat (2018), Structural business statistics, Annual enterprise statistics by size class for special aggregates of activities (NACE Rev. 2) (database) [sbs_sc_sca_r2], http://ec.europa.eu/eurostat/data/database; EU FADN (2018), Farm Accountancy Data Network (database), http://ec.europa.eu/agriculture/rica/database/database_en.cfm.
2.5. Trends in natural resource use and the state of the environment
Latvia’s agricultural production is shifting from non-commercial7 to commercial farms. Commercial farms use more intensive production methods to achieve optimal yields. They can rely on the use of more advanced technologies to reduce emissions and to achieve emission decoupling from production growth. Although the use of mineral fertilisers has increased, nitrogen consumption in Latvia per ha of agricultural area remains one of the lowest among the EU countries (Figure 2.22).
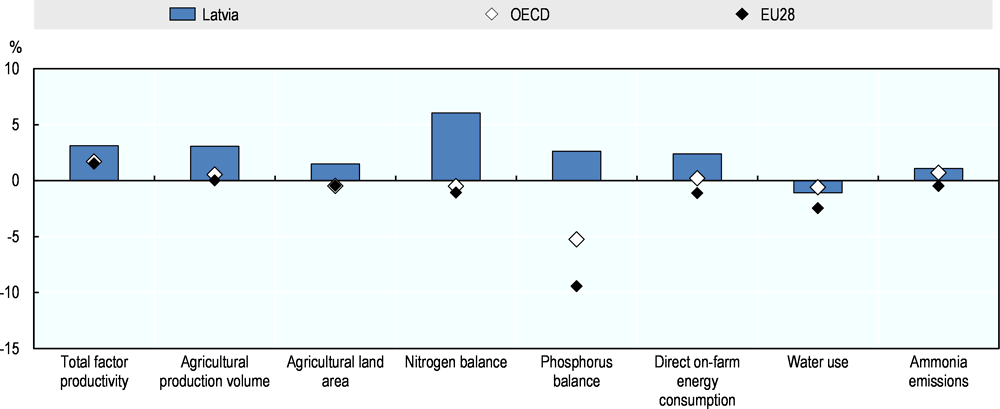
Note: OECD and EU28 averages are calculated based on individual country indicators. Their coverage may vary for each indicator depending on data availability for their respective member countries.
Sources: OECD (2017c), Agri-environmental Indicators (database); Eurostat (2015), Agri-environmental indicators (database) [t2020_rn310] for nitrogen and phosphorus balance for EU countries, http://ec.europa.eu/eurostat/data/database; OECD (2015), Environment (database) for water use; and USDA (2017), Economic Research Service, International Agricultural Productivity for total factor productivity, www.ers.usda.gov/data-products/international-agricultural-productivity/.
Agri-environmental performance
About half of Latvia’s agricultural land is used for production. The other half is used either extensively for pastures and meadows or not used. Soil types that are present in agricultural land are mainly brown soils, anthrosols, gleyed, and alluvial soils.
With the growth and intensification of agricultural production in Latvia, the environmental load has increased but from a low level (Figure 2.23). While noting that harmonised data on pesticide use are not available, the use of pest and disease protection products is expected to be limited under cold temperatures and to bear little weight overall on the environmental load of Latvia’s agriculture. Output growth has been facilitated by the considerable increase in the use of mineral fertilisers in Latvian agriculture (but still one of the lowest in the European Union), among other factors. Growth in agricultural output exceeded the growth in land use and animal numbers as the TFP has increased. The increased GHG and ammonia emissions from agriculture exceeded the growth of the sown area and livestock units, but was slightly less rapid than the growth of the commodity production volume. Emissions per unit of output decreased in Latvia, this suggests successful decoupling of production from emissions.
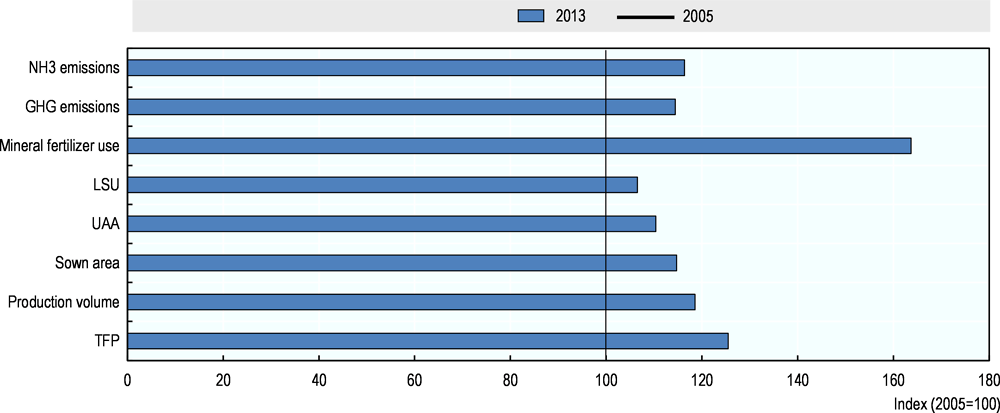
Sources: Eurostat (2018), Farm Structure Survey (database), http://ec.europa.eu/eurostat/data/database; CSB (2017), Farm structure survey and agricultural census (database), http://data1.csb.gov.lv; UNFCCC (2017), Latvia’s National Inventory Report; CEIP (2017), Latvia’s Informative Inventory Report 2017; USDA (2017), Economic Research Service, International Agricultural Productivity for total factor productivity, www.ers.usda.gov/data-products/international-agricultural-productivity/.
Inputs
Since 2005, mineral fertiliser use, mostly nitrogen, has increased, from very low levels and at a faster pace than the growth of the area sown (Figure 2.24). Should this pace be pursued, it could cause environmental concern in the future. In comparison to other EU countries, Latvia has one of the lowest levels of nitrogen use per agricultural area; 63% of the EU28 average level in 2016 (Figure 2.25). At the same time, the use of organic fertilisers in Latvian agriculture has decreased both in total amounts used and per ha of sown area: in 2016, there were 13% less organic fertilisers used per ha than in 2005 (-39% compared to 1995) (CSB, 2017).
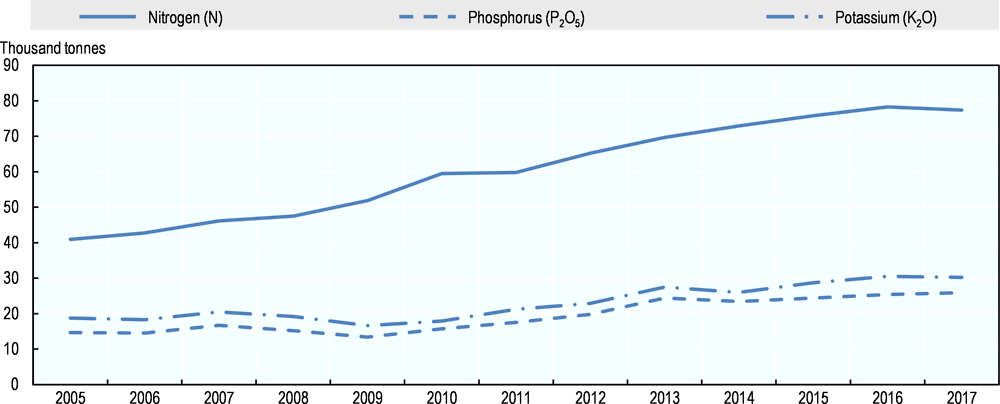
Note: Industrially produced fertilisers used on agricultural crops as basic fertilising and additional fertilising, expressed as 100% of nutrients, in which nutrients mainly are in a form of easily deliquescent minerals.
Source: CSB (2018), Agri-environmental indicators (database) [MGG010, MGG020], www.csb.gov.lv.
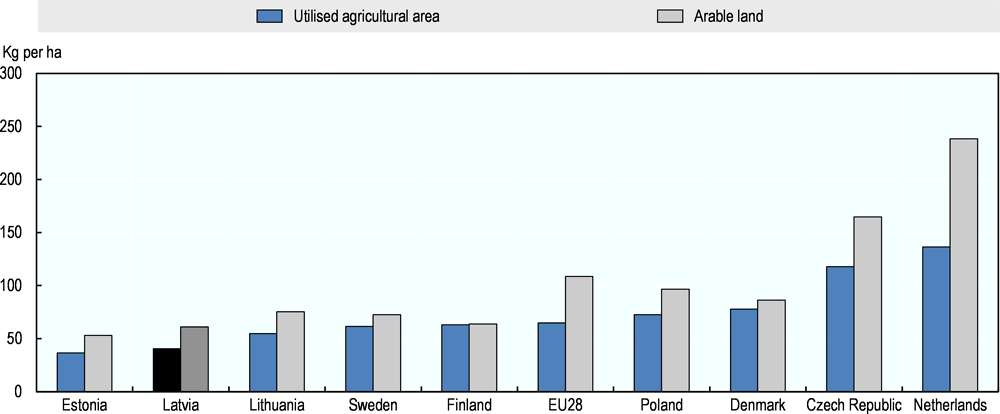
Note: Consumption of inorganic nitrogen per hectare of UAA and arable land. Countries are ranked according to their levels of inorganic nitrogen use per utilised agricultural area.
Source: Calculation based on Eurostat (2018), Agri-environmental indicators (database) [aei_fm_usefert] and Farm structure (database) [ef_lus_main], http://ec.europa.eu/eurostat/data/database.
Water quality and quantity, water use evolution through time, infrastructures
Latvia’s water resources are abundant. In 2014, groundwater resources in Latvia were assessed to constitute 4.7 billion m3 a year, while the total internal renewable surface water resources amounted to 16.5 billion m3 a year (FAO, 2017b). Total freshwater abstraction in Latvia, mostly sourced in surface water, as reported in the OECD Agri-Environmental Indicators database was 177 million m3 in 2015, of which about one-fourth by the grouping of agriculture, forestry and fishing. Crop and animal production accounted for less than 2.9 million m3 (OECD, 2017c).
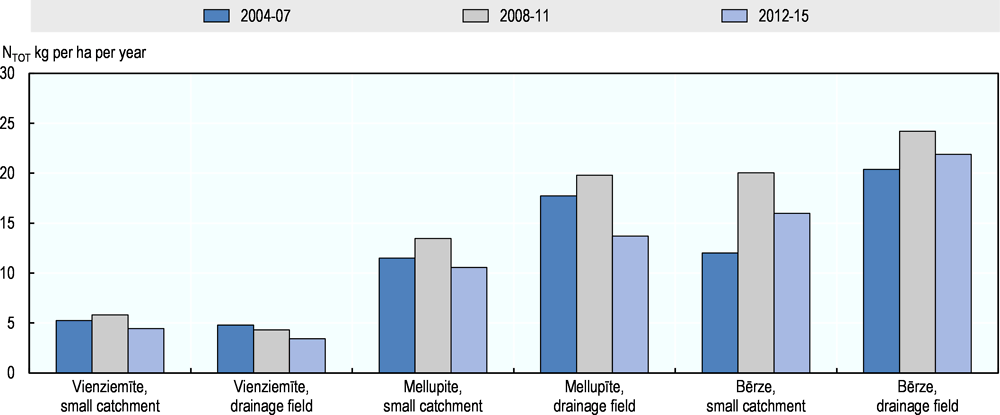
Surface waters are monitored for quality and mainly rated as good. In the period 2012-15, the average annual concentration of nitrates was below 50 mg/l. According to Groundwater quality monitoring, the concentration of nitrates in most boreholes and wells at the depth of five metres did not change significantly. However, considerable deterioration in water quality was reported in some specific sites that was attributed to agricultural intensification, while the quality improved in other sites (Figure 2.26).
Latvia’s report on the implementation of the Nitrate Directive in 2012-15 concludes that the average annual concentration of nitrates was stable (EEA, 2016). Science based norms for mineral fertilisers for crops are defined (MoA, 2017b) and water quality monitored, particularly in vulnerable zones and on agricultural land.
Source: EEA (2016), “Report to the European Commission”, http://cdr.eionet.europa.eu/lv/eu/nid/envwir7mw/LV_Final_Nitrate_Report_161216.pdf.
Water resources are abundant and little use is made of irrigation. According to Eurostat, 630 ha of agricultural land was irrigated in 2013 (Eurostat, 2017c). It should be noted that some irrigation infrastructures developed in the past are no longer used. Grassland and permanent pastures used 42% of the irrigated area in 2010 and the rest was used for growing open field vegetables, potatoes and permanent crops (Agricultural census, 2010). Recourse to irrigation and drainage systems has been identified as one means of climate change adaptation.
Biodiversity evolution
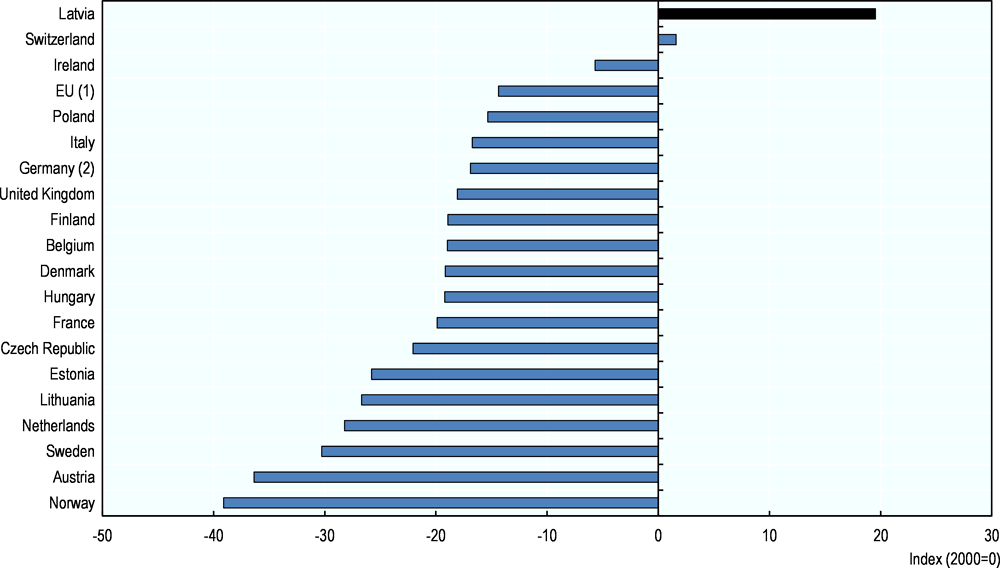
Biodiversity and its evolution are difficult to assess and farmland birds are often used as a proxy-indicator. The average farmland bird index in Latvia in the 2012-14 period increased compared to 2000 (Figure 2.27), however index-value fluctuations and even deterioration are observed in other time periods. The ex post evaluation of the Rural Development Programme (RDP) for 2007-13 finds evidence that farmland bird population improved in territories where payments of the second Axis of the CAP Pillar 2 were implemented8 while some other indicators of biological diversity quality have deteriorated (AREI, 2016). The botanical quality of grassland habitats is one such example.
1. EU aggregate changing according to the context.
2. For Germany, data refer to 2011-13 average.
Source: Eurostat (2017a), Environment and energy (database) [env_bio2] and Agri-environmental indicators (database), http://ec.europa.eu/eurostat/data/database.
Ammonia, Nitrogen oxides and Greenhouse Gas Emissions
Latvia’s agricultural emissions of ammonia, NOx and GHG reflect the sector’s evolution. They have significantly decreased in the past 25 years. This was due to the notable drop in the number of livestock as well as the abandonment of agricultural land. There was a subsequent drop in the use of nitrogen fertilisers during the 1990s while transitioning to a market economy. Although the trend has reversed with Latvia’s accession to the European Union, emissions remain below their levels in 1990.
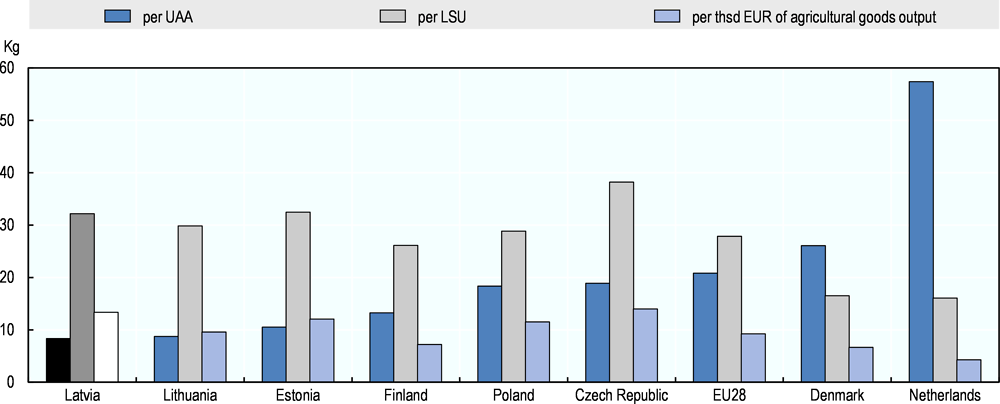
Compared to other EU countries, Latvia’s aggregate emissions of ammonia and GHG per UAA are low. However, if accounted for in terms of emissions per agricultural goods output value both indicators are among the highest and, should the current growth trends be continued, environmental degradations could occur (Figure 2.28).
Ammonia emissions
The agricultural sector is the largest contributor of ammonia emissions in Latvia, 86% in 2015. After accession to the European Union, mineral fertiliser use has increased and so have total livestock numbers although more recently and to a lesser degree. In 2015, NH3 emissions from agriculture, while remaining below 1990 levels, were 20% higher than in 2005 (CEIP, 2017). These emissions are mainly linked to agricultural soil and barnyard manure management, where emissions from crop production and agricultural soils slightly exceed those from manure management (CEIP, 2017). Ammonia emissions are bound under EU directive No 2016/2284 and Latvia has a 1% reduction target by 2030 compared with 2005 levels. Mandatory and voluntary measures are offered to achieve this target. Conditions of good agricultural practice with a view to reduce ammonia emissions are part of the mandatory measures. The conditions were adapted based on research carried out in 2016 on the effectiveness of ammonia emission reduction measures in agriculture. The conditions include measures reducing ammonia emissions from crop and animal production. At the same time, farmers will be informed of regulatory requirements and recommendations regarding the environmental protection from the pollution caused by agriculture.
Note: Countries are ranked according to per UAA levels.
Sources: Eurostat (2017a), Agriculture and environment (database) [ef_m_farmleg]; and Eurostat (2018), Farm Structure Survey (database), http://ec.europa.eu/eurostat/data/database.
Greenhouse Gas emissions
Agriculture is the second largest contributor to Latvia’s GHG emissions after the energy sector. The 2 740 tonnes of CO2 equivalent emissions from agriculture in 2015 account for almost a fourth of total GHG emissions (excluding Land Use, Land Use Change and Forestry - LULUCF). GHG emissions from agriculture are sourced from agricultural soils (61%) to which organic soils contribute about half (52%), enteric fermentation one-third (31%), and, less significantly, manure management (7.2%) and liming and urea application (0.9%). The LULUCF’s total GHG emissions were 1 377 tonnes of CO2 equivalent in 2015. Since 2010, the sector is a net source of GHG emissions due to emissions from organic soils in cropland, forest land and grassland and also to the decrease of the net CO2 removals in living biomass in forest land (UNFCCC, 2017).
Climate change: Climate conditions
Latvia has experienced a relatively stable increase in average air temperature over the past 50 years (1961-2010) along with the growth of minimum and maximum temperature values. Despite higher temperatures, a statistically significant prolongation of the growing season has not been observed so far. Rainfall patterns have changed and higher than “seasonal norms” drought episodes are followed by higher than “seasonal norms” rainfall. Overall, the average seasonal precipitations have increased, in particular in winter and summer (LEGMC, 2017).
If the current trend continues, crop cultivation would be more impacted than animal husbandry. Current evaluations have identified a number of risks associated with climate change, including risks of disease and pest dissemination; lower plant resistance; productivity and quality loss (MoEPRD, Silava, LUA, 2016). Benefits could include a longer growing season and associated varieties of plant and animal production.
In this context, Latvia’s Adaptation to Climate Change Strategy 2030 is under preparation to come into force in 2018-19. The Strategy requires all government areas to promote systematic climate change risk-benefit assessment and management (Section 4.1).
The main adaptation measures identified include the diversification of cultivated plants; the maintenance and the renewal of drainage systems; the introduction of varieties resistant to climate change and implementation of appropriate technological measures; monitoring the dissemination of organisms harmful for cultivated plants and animals and introduction of integrated plant protection; as well as insurance (MoEPRD, Silava, LUA, 2016).
2.6. Summary
-
The territory of Latvia is among the (eight) smallest OECD members. It is sparsely populated by a mostly urban, ageing and declining population. The total population of Latvia decreased by 20% between 1997 and 2017.
-
Looking back, in the past 25 years, Latvia transitioned from central planning to a market economy, joined the European Union in 2004 and in 2014 it adopted the Euro as its currency. These events have significantly contributed to the evolution of Latvia’s economy and agriculture.
-
Latvia joined the OECD in 2016. At that time, Latvia was one of the (three) smallest OECD economies, one of the (six) least populated and characterised by one of the (seven) lowest GDP per capita among OECD countries.
-
Latvia’s economy is small and open. Its 5-year average real growth in 2016 exceeds the OECD average by nearly 1 percentage point.
-
Trade matters for Latvia’s economy. Exports of goods and services make up 58% of GDP and imports 57%, both above the OECD average. The current account balance is positive and Latvia ranked first most open OECD economy for trade in services in 2017.
-
Characteristics of the economy as a whole apply to and may be exacerbated in agriculture and food processing. For example, the low labour productivity in the economy also affects these sectors. High demand for labour in urban areas and higher unemployment in rural areas may instigate labour shortage in agriculture and food processing.
-
About 76% of the total labour input in Latvian agriculture is unpaid family labour.
-
In the 1990s, agriculture output was dwindling and input use was low. EU membership, the associated wider market access and CAP payments gave the sector momentum to grow as evidenced by many indicators.
-
Agriculture and food processing have grown, yet at a slower pace than the overall economy. Latvia’s agriculture contributes higher, although declining, shares to GDP and employment than the OECD and EU averages. The share of food processing in GDP has declined, although much slower than in employment.
-
There has been a strong and sustained agricultural TFP growth, although from very low levels and the sector has not yet reached its efficiency and productivity potential.
-
Cereals and dairy farming make up most of Latvia’s agricultural output. Cereal production is export oriented. Cereals and beverages are the main agro-food export commodity groups.
-
The farm structure is dual; cereal farms are mostly large and livestock farms are smaller than average EU farms.
-
46% of farms do not market their production. These include households with agricultural land, kitchen gardens and subsistence and hobby farms. Their share is declining.
-
There is a potential for UAA growth, possibly in competition with forestry.
-
Since the introduction of CAP organic farming payments, the number of farms and the total certified organic agriculture area increase each year, the land area under organic production has nearly doubled in the past ten years. Sales of organic products also increase every year, however part of organic production, ranging from 52% of organic milk and egg production to 12% of organic vegetables, is sold to conventional processors.
-
Latvia’s environmental performance is high and no area of national concern has been identified. However, the environmental load of agriculture has increased and agricultural output growth has been facilitated by the considerable increase in the use of mineral fertilisers, from very low levels. GHG and ammonia emissions from agriculture have increased too. Current trajectories of increasing environmental pressures from agriculture could, if continued, cause damage in the future.
-
Latvia enjoys high levels of land and water availability. 600 ha have an irrigation infrastructure. The maintenance and renewal of drainage systems has been identified as one means of climate change adaptation, while due consideration should be given to the possible environmental impacts of such measures, in particular on organic soils.
-
Better data availability would allow a more accurate monitoring of evolutions and improve policy relevance. Specifically, indicators on farm income and on environmental performance (particularly data on pesticide use and GHG emissions) should be developed.
References
Agricultural census (2010), http://data1.csb.gov.lv/pxweb/en/lauks/?rxid=a39c3f49-e95e-43e7-b4f0-dce111b48ba1.
AREI EAA (2017), unpublished data.
AREI FADN (2017), Lauku saimniecības. Darba ekonomiskās analīzes rezultāti (Farm Accountancy Data Network Economic analysis results), https://sudat.lvaei.lv/Login.aspx?ReturnUrl=%2fdefault.aspx (accessed 8 October 2017).
AREI (2016), Ziņojums Lauku attīstības programmas 2007-2013 Ex post novērtējums (Report on Rural Development Programme 2007-2013: ex post evaluation), https://www.zm.gov.lv/public/files/CMS_Static_Page_Doc/00/00/00/97/47/Ex-postzinojums_pielikumi_SFC2007.pdf (accessed 24 October 2017).
Bokusheva, R. and S. Kimura (2016), “Cross-Country Comparison of Farm Size Distribution”, Annex Tables B3 and B4, OECD Food, Agriculture and Fisheries Papers, No. 94, OECD Publishing, Paris, https://doi.org/10.1787/5jlv81sclr35-en.
CEIP (2017), Latvia’s Informative Inventory Report 2017, http://www.ceip.at/ms/ceip_home1/ceip_home/status_reporting/2017_submissions/ (accessed 23 October 2017).
CSB (2018), on-line database, http://data1.csb.gov.lv (also available in English, http://data1.csb.gov.lv/pxweb/en/?rxid=a39c3f49-e95e-43e7-b4f0-dce111b48ba1) (accessed October 2018).
CSB (2017), on-line database, http://data1.csb.gov.lv (accessed October 2017).
EEA (2016), “Report to the European Commission” Latvia 2016, European Environment Agency, European Environment Information and Observation Network, http://cdr.eionet.europa.eu/lv/eu/nid/envwir7mw/LV_Final_Nitrate_Report_161216.pdf.
EU (2011), Commission staff Working Paper, Impact assessment Common Agricultural Policy towards 2020 Annex 2A, https://ec.europa.eu/agriculture/policy-perspectives/impact-assessment/cap-towards-2020_en
EU FADN (2018), Farm Accountancy Data Network database, http://ec.europa.eu/agriculture/rica/database/database_en.cfm.
EU FADN (2017), Farm Accountancy Data Network database, http://ec.europa.eu/agriculture/rica/database/database_en.cfm.
Eurostat (2018), on-line database, http://ec.europa.eu/eurostat/data/database (accessed in October 2018).
Eurostat (2017a), on-line database, http://ec.europa.eu/eurostat/data/database (accessed in November 2017).
Eurostat (2017b), Statistics explained: Environmental tax statistics, http://ec.europa.eu/eurostat/statistics-explained/index.php/Environmental_tax_statistics (accessed 4 November 2017).
Eurostat (2015), Agri-environmental indicators, Gross nutrient balance on agricultural land [t2020_rn310], http://ec.europa.eu/eurostat/data/database.
FAO (2018), FAOSTAT, www.fao.org/faostat/en/ (accessed October 2018).
FAO (2017a), FAOSTAT (database), http://www.fao.org/faostat/ (accessed 25 October 2017).
FAO (2017b), AQUASTAT, http://www.fao.org/nr/water/aquastat/main/index.stm (accessed 25 October 2017).
FAO (2016), FAOSTAT, Livestock Primary database, www.fao.org/faostat/en/.
LEGMC (2018), Latvian climate web page, https://www.meteo.lv/lapas/laika-apstakli/klimatiska-informacija/latvijas-klimats/latvijas-klimats?id=1199&nid=562 (accessed 22 October 2018).
LEGMC (2017), Klimata pārmaiņu scenāriji Latvijai (Climate change scenarios for Latvia), http://www2.meteo.lv/klimatariks/zinojums.pdf (accessed 24 October 2017).
Lupikis, A. et al. (2017), “Carbon stock changes in drained arable organic soils in Latvia: Results of a pilot study”, Agronomy Research.
MoA (2018), Latvijas lauksaimniecība 2018 (Latvian agriculture 2018), https://www.zm.gov.lv/public/files/CMS_Static_Page_Doc/00/00/01/33/19/Gadazinojums.pdf
MoA (2017), Latvijas lauksaimniecība 2017 (Latvian agriculture 2017), https://www.zm.gov.lv/public/files/CMS_Static_Page_Doc/00/00/01/10/04/fs-01usersLinda.BirinaDesktopAA2017_lauksaimniecibasgadazinojums.pdf (accessed 3 October 2017).
MoA (2012), Latvijas lauksaimniecība 2012 (Latvian agriculture 2012), https://www.zm.gov.lv/public/files/CMS_Static_Page_Doc/00/00/00/18/27/LS_2012.pdf (accessed 3 October 2017).
MoA (2009), Latvijas lauksaimniecība 2009 (Latvian agriculture 2009), https://www.zm.gov.lv/public/files/CMS_Static_Page_Doc/00/00/00/18/24/LS_2009.pdf (accessed 8 October 2017).
MoEPRD, Silava, LUA (2016), Risku un ievainojamības novērtējums un pielāgošanās pasākumu identificēšana lauksaimniecības un mežsaimniecības jomā, http://www.varam.gov.lv/lat/publ/petijumi/petijumi_klimata_parmainu_joma/?doc=23668
OECD (2018a), OECD.Stat, http://stats.oecd.org/.
OECD (2018b), OECD Services Trade Restrictiveness Index: Policy trends up to 2018, January 2018, OECD Publishing, Paris, https://www.oecd.org/trade/services-trade/STRI-Policy-trends-up-to-2018.pdf.
OECD (2017a), OECD Economic Surveys: Latvia 2017, OECD Publishing, Paris, https://doi.org/10.1787/eco_surveys-lva-2017-en.
OECD (2017b), Economic Policy Reforms. Going for Growth, 2017, http://www.oecd.org/eco/goingforgrowth.htm (accessed 10 October 2017).
OECD (2017c), Agri-environmental Indicators, http://www.oecd.org/tad/sustainable-agriculture/agri-environmentalindicators.htm (accessed 20 October 2017).
OECD (2015), Environment Database, https://data.oecd.org/environment.htm.
RSS (2017), Rural Support Service, unpublished agricultural product balance sheets.
SLS (2018), State Land Service, Land distribution according to land use table, http://www.vzd.gov.lv/lv/parskati-un-statistika/statistika/statistika-no-kadastra/ZLV/.
UN (2018), UN Comtrade database, https://comtrade.un.org/.
UNFCCC (2017), National Inventory Submissions 2017, Latvia’s National Inventory Report, http://unfccc.int/national_reports/annex_i_ghg_inventories/national_inventories_submissions/items/10116.php (accessed 23 October 2017).
USDA (2017), Economic Research Service, International Agricultural Productivity, www.ers.usda.gov/dataproducts/international-agricultural-productivity.aspx (accessed October 18 2017).
World Bank (2018), World Development Indicators (database), http://data.worldbank.org/indicator
World Bank (2017), World Development Indicators 2017, on-line database, http://databank.worldbank.org/data/reports.aspx?source=world-development-indicators.
Notes
← 1. The temperature average high is at 17ºC in July and average low at -4.6ºC in February. The highest precipitations, 78mm on average, occur in July and August
← 2. Calculated as the average of the shares of agro-food imports and exports in total trade.
← 3. Food processing includes the manufacture of food products, beverages and tobacco products (C10-C12).
← 4. The conditions on agricultural land were that it complies with the definition of arable land, permanent grassland and permanent crops and that it has been maintained in a state suitable for grazing or cultivation.
← 5. The FADN source used for Latvia and Estonia in 2010 excludes farms with a Standard Output less than EUR 4 000. These farms represent 64% of Latvian farms. Unlike the FADN, data of the ADC covers all farms. When excluding farms that do not market their production, it estimates the dairy farms mid-point farm size at six dairy cows in 2015.
← 6. It should be noted that the share of fish exports is underestimated as fish products unloaded from Latvian fishing vessels in foreign countries are not included. These account for EUR 12.7 million.
← 7. In 2016 non-commercial farms, i.e. farms that market no agricultural products, represent 46% of all Latvian farm holdings (CBS). They typically occupy less than 4.9 ha and, altogether, use 2.2% of the UAA.
← 8. Rural Development (Pillar 2) of the CAP 2007-13 was structured in four Axes. The second Axis included agri-environmental and animal welfare payments, Natura 2000 payments, payments to farmers in areas with natural handicaps, payments for afforestation, payments for protecting biodiversity in specific sites, and support to non-productive investments.