copy the linklink copied!Main causes of mortality
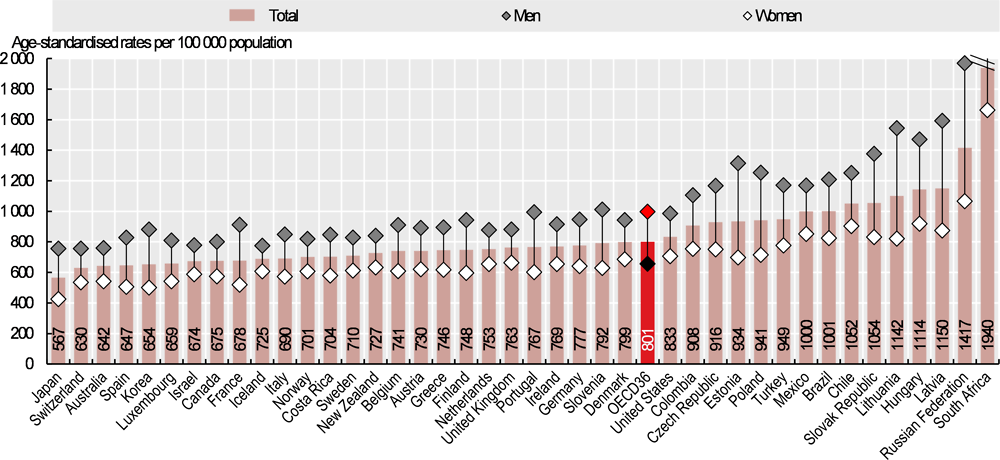
Over 10 million people died in 2017 across OECD countries, equivalent to about 800 deaths per 100 000 population (Figure 3.6). All-cause mortality rates ranged from under 600 deaths per 100 000 in Japan to over 1 100 deaths per 100 000 in Latvia, Hungary and Lithuania (age-standardised rates). Among partner countries, mortality rates were highest in South Africa and the Russian Federation (1 940 and 1 417 per 100 000 deaths respectively).
Age-standardised mortality rates were 50% higher for men than women across OECD countries (997 per 100 000 population for men, compared with 655 for women). In Lithuania, Latvia and Hungary there were about 1 500 deaths per 100 000 men. For women, mortality rates were highest in Hungary, Chile and Latvia. Among partner countries, male mortality rates were around 2 400 deaths per 100 000 in South Africa and almost 2 000 in the Russian Federation. These countries also had the highest female mortality rates. Gender gaps are partly due to greater exposure to risk factors – particularly smoking, alcohol consumption and less healthy diets – alongside intrinsic gender differences. Accordingly, men had higher death rates from heart diseases, lung cancers and injuries, among other diseases.
Diseases of the circulatory system and cancer are the two leading causes of death in most countries. This reflects the epidemiological transition from communicable to non-communicable diseases, which has already taken place in high-income countries and is rapidly occurring in many middle-income countries (GBD 2017 Causes of Death Collaborators, 2018[1]). Across OECD countries, heart attacks, strokes and other circulatory diseases caused about one in three deaths; and one in four deaths were related to cancer in 2017 (Figure 3.7). Population ageing largely explains the predominance of deaths from circulatory diseases – with deaths rising steadily from age 50 and above.
Respiratory diseases were also a major cause of death, accounting for 10% of deaths across OECD countries. Chronic obstructive respiratory disease (COPD) alone accounted for 4% of all deaths. Smoking is the main risk factor for COPD, but occupational exposure to dusts, fumes and chemicals, and air pollution in general are also important risk factors.
External causes of death were responsible for 6% of deaths across OECD countries, particularly road traffic accidents and suicides. Road traffic accidents are a particularly important cause of death among young adults, whereas suicide rates are generally higher among middle-aged and older people.
Looking at other specific causes, Alzheimer’s and other dementias accounted for 9% of all deaths, and were a more important cause of death among women. Diabetes represented 3% of all deaths across OECD countries. The main causes of death differ between socio-economic groups, with social disparities generally larger for the most avoidable diseases (Mackenbach et al., 2015[2]).
Mortality rates are based on the number of deaths registered in a country in a year divided by the population. Rates have been directly age-standardised to the 2010 OECD population (available at http://oe.cd/mortality) to remove variations arising from differences in age structures across countries and over time. The source is the World Health Organization (WHO) Mortality Database.
Deaths from all causes are classified to ICD-10 codes A00-Y89, excluding S00-T98. The classification of causes of death defines groups and subgroups. Groups are umbrella terms covering diseases that are related to each other; subgroups refer to specific diseases. For example, the group diseases of the respiratory system comprises four subgroups: influenza, pneumonia, chronic obstructive pulmonary diseases and asthma. Charts are based on this grouping, except for Alzheimer’s and other dementias. These were grouped together (Alzheimer’s is classified in Chapter G and other dementias in Chapter F).
References
[1] GBD 2017 Causes of Death Collaborators (2018), “Global, regional, and national age-sex-specific mortality for 282 causes of death in 195 countries and territories, 1980–2017: a systematic analysis for the Global Burden of Disease Study 2017”, The Lancet, Vol. 392/10159, pp. 1736-1788.
[2] Mackenbach, J. et al. (2015), “Variations in the relation between education and cause-specific mortality in 19 European populations: A test of the ‘fundamental causes’ theory of social inequalities in health”, Social Science and Medicine, Vol. 127, pp. 51-62.
Source: OECD Health Statistics 2019.
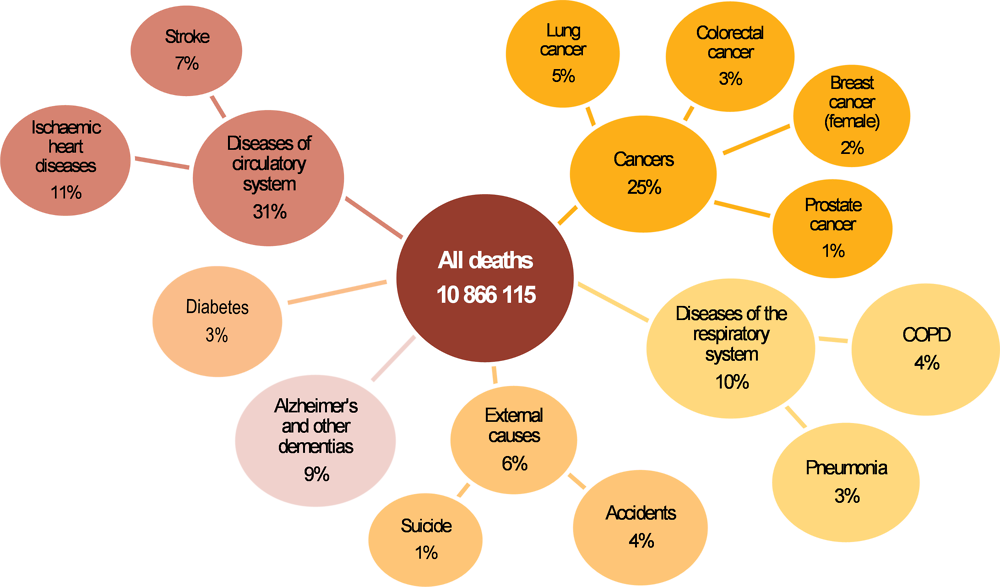
Note: Other causes of death not shown in the figure represent 15% of all deaths.
Source: OECD Health Statistics 2019.
Metadata, Legal and Rights
https://doi.org/10.1787/4dd50c09-en
© OECD 2019
The use of this work, whether digital or print, is governed by the Terms and Conditions to be found at http://www.oecd.org/termsandconditions.