
3. Financing from the multilateral development system
The magnitude of the development challenges facing the world on the threshold of the “decade of action” requires a strong and effective multilateral response. This chapter sheds light on the development activities financed by multilateral organisations in recent years. Capitalising on recent research, the chapter also identifies specific areas in which multilateral development finance is expected to add value. Finally, the chapter assesses how multilateral entities perform in key dimensions of development effectiveness, and whether they make the best possible use of their respective business models and comparative advantages.
3.1.1. Key trend 1: the multilateral system has remained a stable source of development finance over time
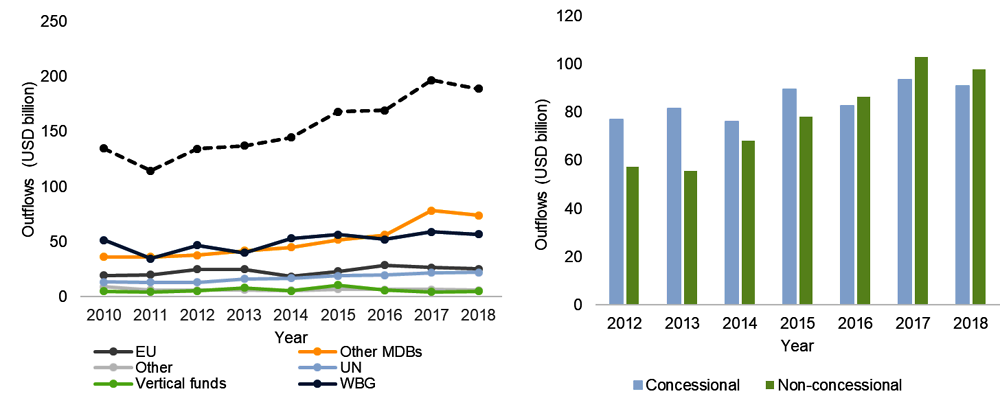
Funding from the multilateral system increased steadily from 2011, before falling slightly in 2018. Multilateral outflows to developing countries rose steadily between 2011 and 2017 (Figure 3.1). The increase was especially steep in 2015, a year marked by landmark multilateral agreements such as the 2030 Agenda and the Paris Agreement. However, after reaching a record high of USD 197 billion in 2017, multilateral outflows declined slightly to USD 189 billion in 2018.
Source: Authors’ calculations based on (OECD, 2020[1]), “Creditor Reporting System”, https://stats.oecd.org/Index.aspx?DataSetCode=crs1.
The upward trend in multilateral outflows is largely driven by the activity of the main multilateral development banks. The steady increase observed during the 2010s, and the uptick observed in 2017, are mainly attributable to the soaring lending volume of multilateral development banks, in particular the Asian Development Bank (ADB) and the newly established Asian Infrastructure Investment Bank1 (AIIB). Likewise, the decrease in 2018 is partially due to a decline in outflows from some regional MDBs, in particular the African Development Bank (AfDB) and the Islamic Development Bank (IsDB).
The growth of MDBs’ non-concessional flows from 2013 onwards was a key contributor to multilateral outflows. Figure 3.1 shows that non-concessional finance has constantly exceeded concessional flows since 2016. In 2018, non-concessional flows amounted to USD 98 billion (compared to USD 91 billion for concessional finance), accounting for 52% of total multilateral outflows. This again shows the increasing weight of MDBs in overall multilateral outflows, as those organisations are the main providers of non-concessional loans.
3.1.2. Key trend 2: multilateral outflows mainly target infrastructure and production, though humanitarian funding is rising
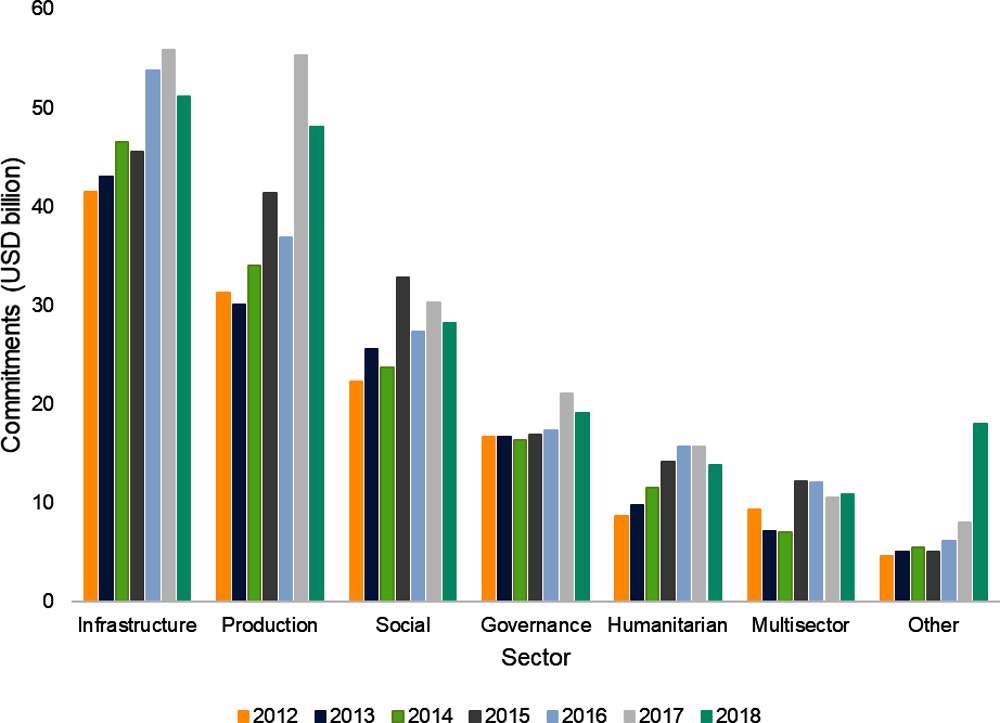
The infrastructure sector is the largest recipient of multilateral outflows (Figure 3.2). This pattern is predominantly driven by the major multilateral development banks’ (MDBs) traditional focus on infrastructure; together the MDBs account for the largest portion of total multilateral outflows. Outflows to infrastructure-related sectors increased on average by 3% over the 2012-2018 period, although the share of infrastructure investments in overall multilateral development finance slightly decreased (from 31% in 2012 to 27% in 2018).
Outflows to productive sectors have increased steeply, in particular banking and financial services, agriculture and industry. Multilateral finance to productive sectors increased from USD 30 billion in 2012 to USD 55 billion in 2017, before declining slightly in 2018, to USD 48 billion. As a consequence, the share of productive sectors in multilateral finance rose from 23% to 25% between 2012 and 2018.
Multilateral development finance to social sectors peaked at USD 33 billion in 2015 before falling back below previous levels. The peak observed in 2015, probably driven by momentum at the end of the Millennium Development Goal era, coincided with a spike in financing from the Global Fund to end AIDS, Tuberculosis and Malaria.
Although it still represents a relatively small portion of total multilateral outflows, financing for humanitarian purposes has rapidly increased since 2012 (from USD 9 billion in 2012 to USD 14 billion in 2018, Figure 3.2). This increase can partially be attributed to the 2015-2016 refugee crisis, since most of the additional humanitarian funding targeted emergency response and reconstruction and relief.
Source: Authors’ calculations based on (OECD, 2020[1]), “Creditor Reporting System”, https://stats.oecd.org/Index.aspx?DataSetCode=crs1.
3.1.3. Key trend 3: middle-income countries benefit most from recent increases in multilateral outflows
The growth in non-concessional outflows reflects multilateral finance’s increased focus on middle-income, and especially upper middle-income, countries (UMICs). Multilateral outflows to UMICs increased from USD 16 billion in 2001 to USD 56 billion in 2018. In relative terms, UMICs accounted for 30% of multilateral outflows in 2018.
Multilateral finance appears to be less focused on least developed countries (LDCs) and other low-income countries (LICs) than in the past. In 2004, the share of multilateral outflows to LDCs and other LICs peaked at 47% of total multilateral outflows. Although contributions to LDCs and LICs continued to increase in volume in subsequent years, their share has steadily declined: in 2018, they have come to represent only 23% of total multilateral outflows.
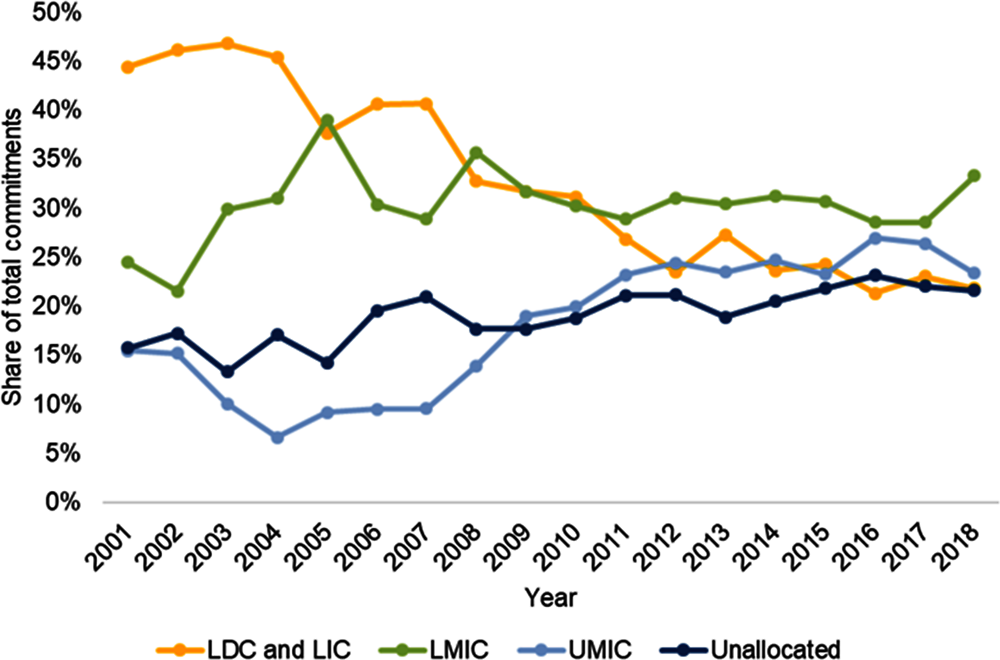
Note: LDC: least developed country; LIC: lower-income country; LMIC: lower middle-income country; UMIC: upper middle-income country.
Source: Authors’ calculations based on (OECD, 2020[1]), “Creditor Reporting System”, https://stats.oecd.org/Index.aspx?DataSetCode=crs1.
The reclassification of recipient countries largely explains the shift of multilateral finance towards UMICs. The number of countries classified as upper middle-income by the World Bank Group rose from 47 in 2009 to 60 in 2018, while the number of low-income countries decreased from 40 to 31. In addition, three countries have graduated from the LDC category since 2010. Based on the previous categorisation of countries, the share of outflows to upper middle-income countries has actually declined, while flows to LDCs, LICs and LMICs have increased.
Development partners’ engagement with multilateral organisations rests on the assumption that multilateral approaches can complement their portfolios of bilateral aid. The unique strengths of the multilateral development system have come into renewed focus with the COVID-19 crisis. As the pandemic hits societies and economies across the world, countries find themselves faced with challenges of such a magnitude that they cannot be solved through unilateral action.
Now is a crucial time to assess whether, and how, multilateral stakeholders are able to leverage the comparative advantages of the multilateral development system to address present-day development challenges. This section explores the nature and extent of these comparative advantages by drawing from a variety of sources. First, it looks at findings from the 2020 survey on Development Assistance Committee (DAC) members’ policies and practices vis-à-vis the multilateral development system to explore DAC members’ perceptions of the comparative advantages of multilateral approaches (OECD, 2020[2]). Second, findings from the 2018 Global Partnership for Effective Development Co-operation (GPEDC) monitoring exercise (OECD/UNDP, 2019[3]) (Box 3.1) are examined to detect differences between multilateral and bilateral development co-operation, and between multilateral entities, in their alignment with development effectiveness principles. Finally, a comparative analysis of multilateral and bilateral financing patterns explores whether the distinctive features of multilateral development finance reflect unique strengths of the multilateral system.
3.2.1. DAC members expect the multilateral development system to add value across a variety of areas and functions
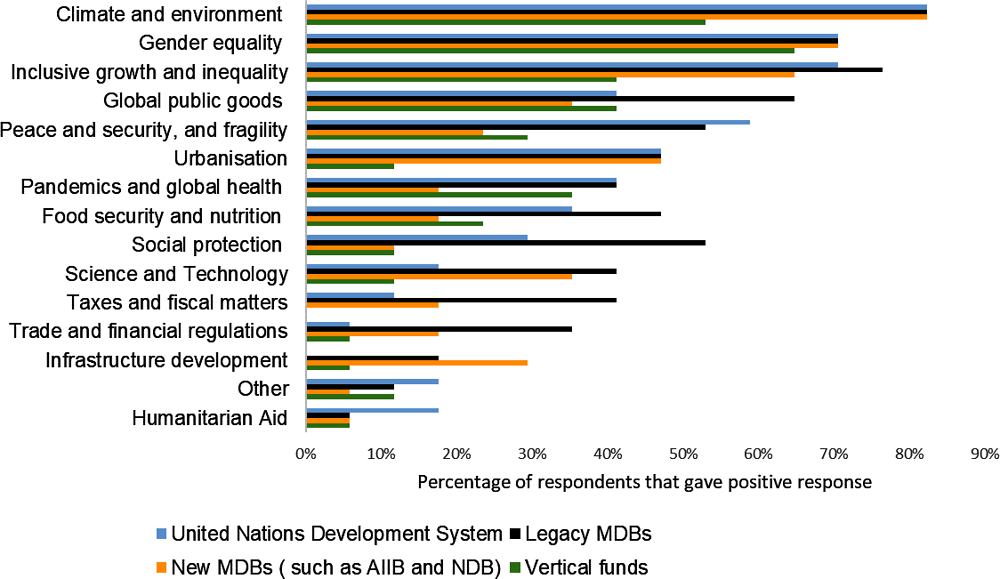
DAC members harbour high expectations for the future role of legacy MDBs to tackle global public bads and socio-economic challenges. In the recent survey on DAC members’ policies and practices vis-à-vis the multilateral development system (OECD, 2020[2]), survey respondents highlighted climate and environment, gender equality, and inclusive growth as key topics where they expect the multilateral development system to increase its contribution in the near future. Legacy MDBs, such as the World Bank Group and the main regional development banks, are expected to increase their contribution in social sectors (social protection, food security and nutrition) and economic policy (domestic resource mobilisation, and trade and financial regulation).
New MDBs, such as AIIB and NDB, are mainly expected to help close the gap in infrastructure investment. This reflects in part these two entities’ self-declared focus on infrastructure financing: infrastructure projects are a standout feature of the AIIB since its inception, and the NDB’s five-year strategy states that about two-thirds of all projects will be devoted to sustainable infrastructure development. In the survey results, infrastructure development is the only area where the two new banks are expected to significantly step up their contribution relative to other multilateral organisations (Figure 3.4).
DAC members anticipate a larger role for the UN in supporting peace and security, and delivering humanitarian aid. The UN is already very active in these areas, which have been at the heart of its mandate since its inception, witnessed by the early creation of the United Nations Children’s Fund (UNICEF) in 1946, the United Nations High Commission for Refugees (UNHCR) in 1950, and the World Food Programme (WFP) in 1961.
Source: (OECD, 2020[2]), “Survey on DAC providers' policies and practices vis-a-vis the multilateral development system” (unpublished).
3.2.2. Development effectiveness is at the core of the multilateral value proposition
An effective multilateral system is indispensable for increasing the scale, pace and sustainability of development co-operation. This is especially true in the current context, as the financial constraints that will result from the economic impact of the COVID-19 pandemic call for an effective and efficient use of ODA that optimises the resources available for the 2030 Agenda. The qualities usually attributed to the multilateral development system (e.g. impartiality, coverage, scale) suggest that multilateral organisations may provide an effective channel for DAC members’ ODA.
The 2018 monitoring round of the Global Partnership for Effective Development Co-operation indicated that the multilateral system performed better in most areas of development effectiveness than bilateral channels (Figure 3.5). Overall, multilateral development partners appear to show greater alignment with partner countries’ priorities, results indicators, statistics, and monitoring and evaluation systems than bilateral partners, although results vary among the different types of multilateral organisations and across indicators. They also tend to engage governments and national development actors in the development of their country strategies to a greater extent than bilateral partners. In addition, multilateral partners are more likely than bilateral partners to make forward expenditure and implementation plans available to partner countries. Nevertheless, multilateral partners appear less likely than bilateral partners to disburse their funding according to their original schedules and, since 2011, they have made less progress than bilateral partners in using partner countries’ public financial management (PFM) systems.
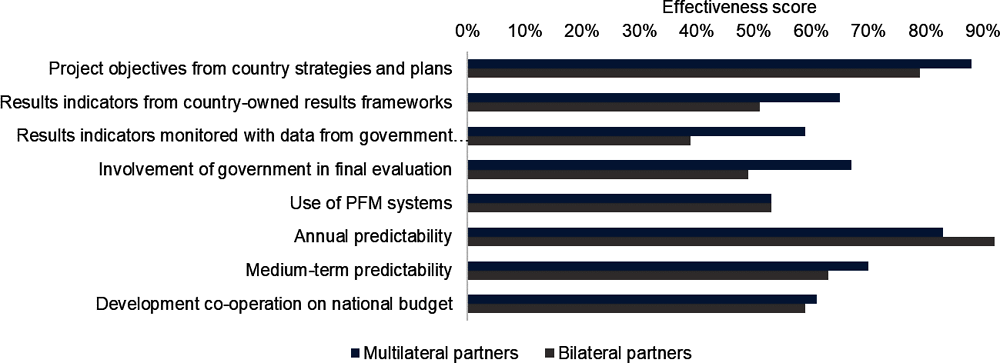
Note: Detailed information on the calculation of effectiveness scores can be found at https://www.effectivecooperation.org/system/files/2020-09/Technical%20Companion%20-%20Final%20online.pdf.
Source: Analysis from Global Partnership for Effective Development Co-operation (GPEDC) based on raw data collated in (GPEDC, 2018[4]), 2018 Global Partnership Monitoring Round, https://www.effectivecooperation.org/content/gpedc-monitoring-excel-database.
The Global Partnership for Effective Development Co-operation (GPEDC) is a multi-stakeholder platform set up to increase the effectiveness of development efforts by all actors in delivering results that are long-lasting and contribute to the achievement of the SDGs. The Global Partnership provides practical guidance and shares knowledge to improve development impact. It supports countries’ implementation of five internationally agreed effectiveness principles: ownership by partner countries, a focus on results, inclusive partnerships, transparency and mutual accountability. The Global Partnership’s flagship instrument is its biennial monitoring exercise, which since 2013 has tracked progress towards the effectiveness principles, and is a recognised source of data and evidence on upholding effectiveness commitments.
In the 2018 GPEDC monitoring round, 86 partner countries reported on development co-operation funding received from 69 multilateral development partners, including 16 multilateral development banks, 28 UN agencies, 13 vertical funds and initiatives, the European Institutions and 11 other international organisations. Partner countries reported on qualitative characteristics of more than 1 600 multilateral projects and programmes approved in 2017 with a total multi-year budget of USD 40.3 billion. They also reported on USD 29.7 billion in development co-operation funding disbursed as grants and loans by multilateral partners, including USD 23.6 billion disbursed directly to the public sector.
As part of the 2020-2022 Global Partnership Work Programme,1 the monitoring exercise will be to develop a new monitoring proposal for endorsement at the Third High-Level Meeting of the Global Partnership, scheduled to take place in 2022. This revision will capture effective partnering to deliver on the SDGs across different co-operation approaches and modalities, including through the multilateral development system.
← 1. The 2020-2022 Global Partnership Work Programme can be accessed at https://www.effectivecooperation.org/content/2020-2022-global-partnership-work-programme.
Source: Analysis from Global Partnership for Effective Development Co-operation (GPEDC) based on raw data collated in (GPEDC, 2018[4]), 2018 Global Partnership Monitoring Round, https://www.effectivecooperation.org/content/gpedc-monitoring-excel-database.
Alignment with country priorities
Multilateral partners tend to engage government and national development actors in the development of their country strategies, and their strategic level alignment is better than bilateral partners. Results from the 2018 Global Partnership monitoring round show that overall, multilateral partners are more likely to have country-specific strategies in place to guide their development co-operation (84% of cases) than bilateral partners (69% of cases) (OECD/UNDP, 2019[3]). Furthermore, in developing their country strategies, multilateral partners tend to consult more with country governments, civil society organisations and the private sector. Multilateral partners are also more inclined than bilateral ones to fully align their strategies with partner countries’ priorities.
Multilateral partners align their projects with partner countries’ results indicators, statistics, and monitoring and evaluation systems to a greater extent than bilateral partners. In 2018, the alignment2 of multilateral development projects with partner countries’ objectives, results indicators, statistics and monitoring systems, as well as the involvement of country governments in project evaluations, remained at 2016 levels. Despite the lack of progress over this two-year period, multilateral partners still performed significantly better than bilateral partners (Figure 3.6), whose alignment scores appeared to have declined since 2016. In particular, multilateral bodies perform better in using data and statistics from the partner government to track progress towards results, and in involving the government in the final evaluation of projects. In fact, GPEDC data analysis shows that closer alignment of providers’ country strategies with partner countries’ results frameworks often translates into alignment at the project level (OECD/UNDP, 2019[3]).
Multilaterals vary in their degree of alignment. Vertical funds and UN agencies tend to perform better on average across the various elements of alignment. The Islamic Development Bank (IsDB) and the World Health Organisation (WHO) are two of the best performers on average across all elements related to alignment (with scores above 90%). In the case of the WHO, this performance seems to be driven by the strong emphasis on aligning country-level interventions with national development strategies and country results frameworks. The WHO develops a Country Cooperation Strategy (CCS) in each country where it operates. These CCSs ensure the alignment of the WHO’s support with national health plans and strategies, and integrate monitoring and evaluation tools to assess the agency’s performance in each country.
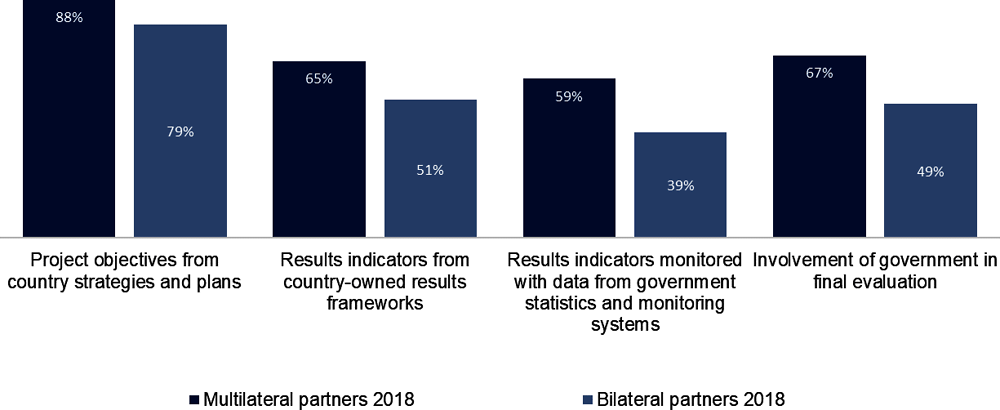
Source: Analysis from Global Partnership for Effective Development Co-operation (GPEDC) based on raw data collated in (GPEDC, 2018[4]), 2018 Global Partnership Monitoring Round, https://www.effectivecooperation.org/content/gpedc-monitoring-excel-database.
Use of country systems
Multilateral development banks lead in the use of country PFM systems. The proportion of development co-operation disbursed to the public sector that uses countries’ own public financial management (PFM) and public procurement systems has not improved since 2011 for multilateral partners3 overall (53%). While there has been an increase in the use of countries’ procurement systems, this gain has been offset by a decrease in the use of budget execution procedures, financial reporting and auditing systems. The overall use of country PFM systems by multilaterals in 2018 is similar to that of bilateral partners (Figure 3.7), although the latter group has improved since 2011. This is especially the case for DAC members, which have substantially increased their use of country PFM systems (from 44% to 55% between 2011 and 2018). Despite a decline since 2011, MDBs present the highest use of PFM systems among multilateral partners, which seems to largely reflect their country-based engagement model. EU institutions, which are the next-best performers after the MDBs, have improved their use of PFM systems since 2011 (from 48% in 2011 to 53% in 2018). On the other hand, the use of PFM systems continues to be particularly low for UN agencies (18%).
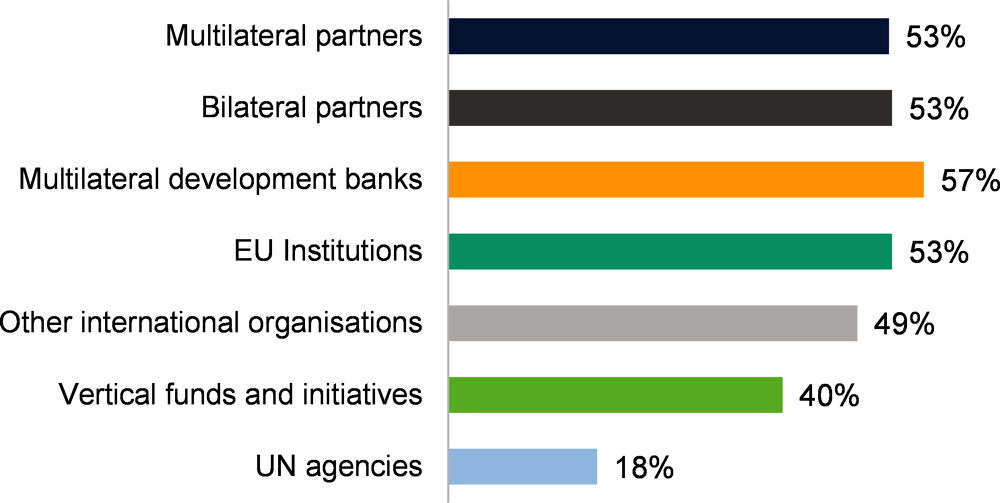
Source: Analysis from Global Partnership for Effective Development Co-operation (GPEDC) based on raw data collated in (GPEDC, 2018[4]), 2018 Global Partnership Monitoring Round, https://www.effectivecooperation.org/content/gpedc-monitoring-excel-database.
Predictability of development co-operation
Multilateral partners’ funding is less predictable than bilateral partners’ funding. The share of development co-operation disbursed on time has slightly increased for multilateral partners since 2016, but it remains lower than its 2011 level (from 81% to 83% between 2016 and 2018; 85% in 2011). Bilateral partners’ annual predictability remains much higher on average (92%). Both under and over-disbursements in the total amount of funding to the public sector can affect the government’s ability to implement its development efforts as planned. In 2018, 17 multilateral partners reported disbursing a total of USD 1 billion less than the amount they had originally planned. On the other hand, 28 multilateral partners reported having disbursed more funding (a total of USD 3.7 billion) than the amount originally scheduled.
Finance from vertical funds and multilateral development banks is more predictable than from UN agencies and EU institutions. Performance in this area seems to vary significantly across the different categories of multilateral organisations. The proportion of financing disbursed in the year it was planned is 86% for both MDBs and vertical funds, but 83% for UN agencies and 71% in the case of EU institutions (Figure 3.8).

Source: Analysis from Global Partnership for Effective Development Co-operation (GPEDC) based on raw data collated in (GPEDC, 2018[4]), 2018 Global Partnership Monitoring Round, https://www.effectivecooperation.org/content/gpedc-monitoring-excel-database.
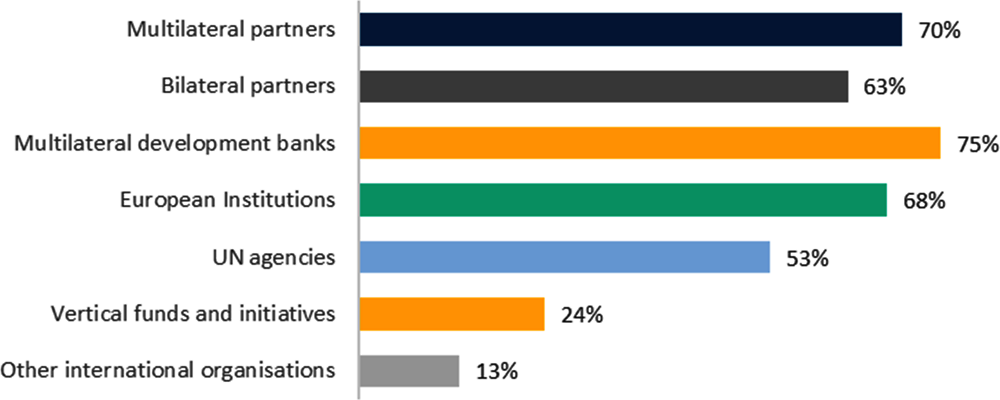
On the other hand, forward visibility of development co-operation is greater for multilateral development partners. On average between 2016 and 2018, partner country governments reported they had received forward expenditure plans from multilateral partners covering 70% of estimated development co-operation funding (75% in 2016), compared to 63% from bilateral partners. This could be explained by the greater share of funding disbursed by multilateral partners than bilateral partners to the public sector, as well as multilaterals’ greater tendency to design country strategies, which often contain forward expenditure plans.
Multilateral partners’ provision of forward expenditure and implementation plans to their partner countries has decreased since 2016, reflecting an overall trend. Between 2016 and 2018, the share of multilateral development co-operation covered by forward expenditure plans decreased from 75% to 70%. Although MDBs also experienced a decline in this indicator, they continue to perform better than other categories of multilateral organisations. The Asian Development Bank (ADB; see Box 3.2) and the World Bank Group (WBG), in particular, make forward expenditure plans available to partner countries that cover more than 80% of their estimated development co-operation funding – well above the global average (Figure 3.9).
The share of multilateral development co-operation recorded on partner countries’ national budgets also declined between 2016 and 2018. Despite dropping from 67% to 61%, multilateral partners continue to perform better than bilateral partners on this particular indicator.
Source: Analysis from Global Partnership for Effective Development Co-operation (GPEDC) based on raw data collated in (GPEDC, 2018[4]), 2018 Global Partnership Monitoring Round, https://www.effectivecooperation.org/content/gpedc-monitoring-excel-database.
Because of their operating model, which is closely aligned with country strategies and relies on partner countries’ public sector to channel their funds, multilateral development banks tend to outperform other development partners on their use of country systems. Among the MDBs, the Asian Development Bank (ADB) appears as the top performer, administering 92% of its funds through country systems. The ADB also provides its partners with forward expenditure plans covering a larger share of its estimated development co-operation funding (89%, compared to an average of 70% for all multilateral partners).
These results partly reflect the ADB’s effort to build strong relations with country governments: in fact, the ADB designs country strategies guiding its development co-operation in all countries where most of its funding is channelled through the public sector. GPEDC data analysis found that the existence of country strategies determines the use of country systems and the greater availability of forward expenditure plans. Furthermore, the ADB also relies greatly on loans to deliver its funding, which GPEDC data analysis also found are more frequently administered using country systems.
Source: Analysis from Global Partnership for Effective Development Co-operation (GPEDC) based on raw data collated in (GPEDC, 2018[4]), 2018 Global Partnership Monitoring Round, https://www.effectivecooperation.org/content/gpedc-monitoring-excel-database.
Transparency
Multilateral development partners perform well in global assessments of transparency. The Global Partnership assessment of transparency in development co-operation is based on development partners’ reporting to three global information systems and standards: the OECD Creditor Reporting System (CRS), the OECD DAC Forward Spending Survey (FSS) and the International Aid Transparency Initiative (IATI).4
In the 2018 monitoring round, half of the multilateral development partners achieved excellent ratings in the assessment of information reported to the OECD CRS (compared to less than one-third in 2016). The UN agencies are the top performers among the multilaterals, with 57% rated as excellent in the CRS transparency rating. Similarly, multilateral development partners also perform well, and demonstrate progress, in the FSS and the IATI assessments, with a greater proportion of multilaterals achieving a rating of excellent compared to 2016. Among the multilateral organisations reported on in all three assessments, the Asian Development Bank (ADB) obtains excellent scores in all three assessments; the African Development Fund (ADF), UNICEF and EU institutions obtained “excellent” ratings in two out of the three assessments, and a “good” rating in the third.5
3.2.3. The financing patterns of multilateral organisations confirm they complement and add value to the work of other development partners
Multilateral organisations’ financing patterns illustrate some of their comparative advantages, both relative to bilateral partners and to each other. This section analyses the performance of multilateral organisations in relation to five features thought to distinguish multilateral approaches from bilateral ones. These five features are selected based on a review of the literature on multilateral development finance, as well as the data available in the OECD Creditor Reporting System: (i) economies of scale; (ii) degree of specialisation; (iii) ability to pursue multisector and cross-country approaches; (iv) use of government channels; and (v) support in difficult environments, such as fragile contexts.
The analysis shows that MDBs can generate significant economies of scale and work closely with recipient governments (Figure 3.10). Multilateral development banks have relatively large country portfolios compared to other development partners, allowing them to benefit from significant economies of scale. Moreover, they appear to work closely with recipient governments and to rely on country systems, as reflected in the relatively frequent use of recipient government channels (see the section above). While MDBs have diversified portfolios with large sectoral and geographical coverage, they seem to engage less in multisector and multi-country activities than other multilateral actors.
The entities forming the UN Development System (UNDS) devote a large share of their resources to supporting fragile contexts and display a high degree of specialisation. The UN focus on fragile contexts is in line with the original mandate of the organisation, centred on the advancement of peace and security. The UNDS includes a large number of highly specialised agencies, resulting in a large pool of expertise. These advantages, however, seem to come with a number of trade-offs. For example, the large variety of UN specialised agencies translates into lower economies of scale due to their smaller average portfolio size. And while the implementing capacity of UN agencies is an advantage when working in challenging environments, such as fragile contexts, it also means that the UN relies significantly less on recipient government channels than other multilateral entities.
Vertical funds are also highly specialised, but commit a high proportion of their funding to multisector and multi-country approaches. As their name suggests, global vertical funds are created to address a specific development challenge, which explains why their financing outflows tend to be concentrated in particular sectors. Nevertheless, this does not prevent them from engaging in multisector approaches. In fact, vertical funds must invest across sectors or work with other stakeholders in order to ensure the viability and sustainability of their approach.
As a regional body, the EU is uniquely positioned to promote integrated and cross-country solutions to tackling development challenges. The EU also features a relatively high share of multisector projects and often disburses development-related funding through recipient government channels.

Note: The scores for the different indicators are calculated based on the average size of country portfolios and on the share of specific types of projects in the overall outflows of multilateral organisations. More details are included in the sections below.
Source: Authors’ calculations based on (OECD, 2020[1]), “Creditor Reporting System”, https://stats.oecd.org/Index.aspx?DataSetCode=crs1.
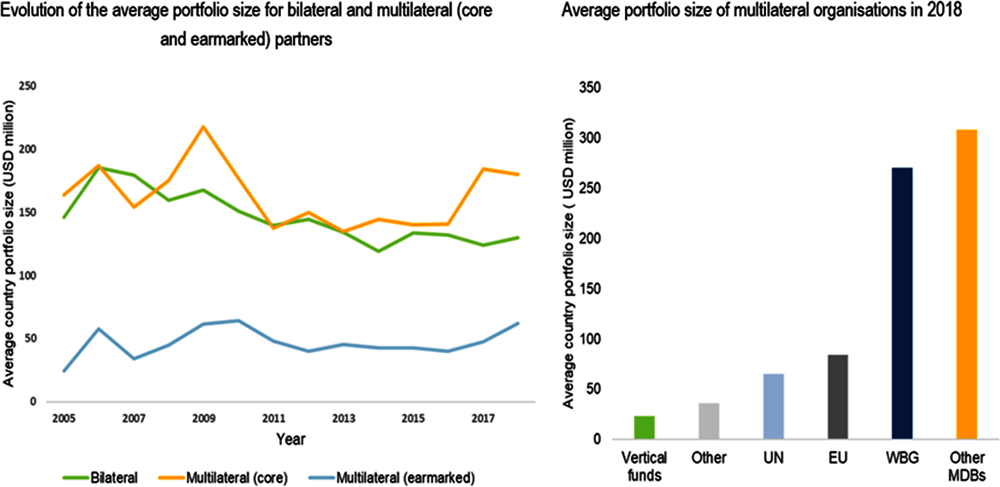
The fragmentation of the multilateral development system does not seem to have eroded its scale advantages
Since multilateral organisations pool resources from different members, the general expectation is that they have greater economies of scale than bilateral providers. Figure 3.11 shows that the average portfolio size of multilateral organisations is indeed larger than that of bilateral providers.6 The difference in portfolio size between these two groups has even increased in recent years, suggesting that the proliferation of multilateral actors has not eroded its scale advantages.
This trend is predominantly driven by the MDBs. Other types of organisation, such as UN entities and vertical funds, tend to have smaller portfolios on average than bilateral providers. However, some vertical funds may be able to achieve efficiency gains through economies of scale when they channel their resources through MDBs or UN agencies or use the latter as implementing entities to deliver programmes in individual countries.
Source: Authors’ calculations based on (OECD, 2020[1]), “Creditor Reporting System”, https://stats.oecd.org/Index.aspx?DataSetCode=crs1.
Multilaterals choose between specialisation and diversification
Multilateral organisations are uniquely positioned to develop and provide highly specialised support. Unlike their bilateral counterparts, many multilateral organisations are created with a specific mandate that requires them to develop and share specialised knowledge and expertise. While specialisation can be defined in multiple ways, this analysis focuses on the sectoral specialisation of development partners, which is calculated using the purpose codes in the OECD Creditor Reporting System.
On average, multilateral organisations tend to have a stronger sectoral specialisation than bilateral development partners.7 Figure 3.12 shows the degrees of specialisation, measured as the highest share of a specific sector in the overall portfolio of a multilateral or bilateral provider. Multilateral organisations feature a higher level of specialisation in the activities funded from their core resources than in those funded from earmarked contributions, which seem to branch out into a more diverse set of sectors. This may reflect donors’ tendency to use earmarking to steer multilaterals into areas that are outside their traditional focus, sometimes to bring to their attention otherwise under-prioritised areas.

Source: Authors’ calculations based on (OECD, 2020[1]), “Creditor Reporting System”, https://stats.oecd.org/Index.aspx?DataSetCode=crs1.
In general, organisations with larger portfolios tend to display more sectoral diversity. This trend is mainly driven by MDBs, whose operations usually span a large array of sectors despite their traditional focus on infrastructure development.8 Among the MDBs, the World Bank Group presents the most diversified portfolio.
Conversely, smaller organisations tend to have stronger regional or sectoral specialisation. As a consequence, organisations that are more prone to benefit from economies of scale are less likely to be highly specialised in a particular thematic or geographic area. This suggests the existence of trade-offs between the various comparative advantages of multilateral organisations. It should be noted, however, that a lower degree of specialisation does not mean that those organisations lack expertise in the areas they are operating in. Larger organisations often have staff and departments that are highly specialised in one area. Instead, the concept of specialisation used in this analysis refers to the orientation of the organisation as a whole.
It is also noteworthy that no organisation has both high regional and high sectoral specialisation. Vertical funds, such as the Global Fund and Gavi; and UN bodies serving humanitarian and social purposes, such as WHO, UNFPA, UNAID, and UNHCR; are highly specialised in certain sectors (Figure 3.13). MDBs with a regional or sub-regional focus, such as the Arab Bank for Economic Development in Africa (BADEA), the Council of Europe Development Bank (CEB), and the Development Bank of Latin America (CAF); as well as some specialised UN entities, such as the UNRWA and the UN Economic Commission for Europe (UNECE); are among the organisations with the highest geographical specialisation.
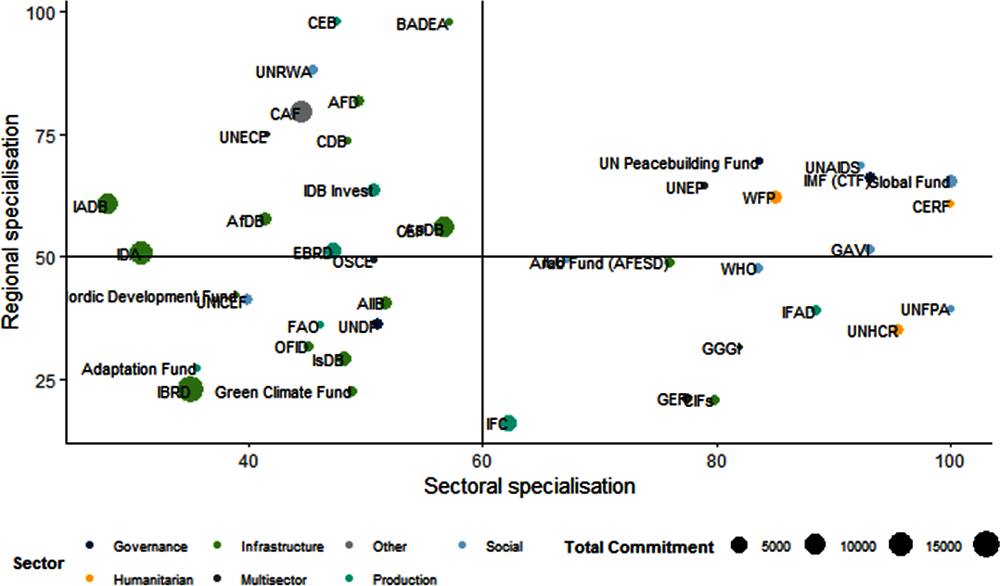
Source: Authors’ calculations based on (OECD, 2020[1]), “Creditor Reporting System”, https://stats.oecd.org/Index.aspx?DataSetCode=crs1.
Specialisation patterns seem fairly stable over time, but organisations may adjust their sectoral focus to meet evolving client needs and demands. When tracing changes in these patterns over time, we observe that most organisations show continuity in the area and degree of specialisation. However, where a change is observed, it tends to be to sectoral rather than regional specialisation. This appears evident for organisations with a predefined regional focus in their mandates, such as the regional and sub-regional development banks. However, the analysis reveals that this is also true for organisations with no particular geographic mandate, such as the WHO and International Fund for Agricultural Development (IFAD). This implies that multilateral organisations retain a strong commitment to their partner countries, possibly shifting technical expertise to adapt to partner countries’ evolving needs. For example, the sectoral focus of the European Bank for Reconstruction and Development (EBRD) appears to have shifted significantly between the periods 2001-2010 and 2010-2018 as its financing of infrastructure-related projects, which used to be the largest recipient sector of the organisation, has progressively given way to investments in productive sectors.
Multisector and cross-country approaches are rare
The multilateral development system, with its wide-ranging expertise and global membership, seems well placed to spearhead the integrated approaches called for by the 2030 Agenda. The SDGs emphasise the multidimensionality of sustainable development, as well as the interlinkages existing between the various development areas, such as the eradication of poverty, the promotion of economic and social development, or the protection of the planet (Durand and Scott, 2016[5]). Moreover, by emphasizing the global nature of many development challenges, the 2030 Agenda also highlighted the need to work across borders, combining local, national, regional and global approaches to face development challenges such as climate change, refugee crises and pandemics.
Surprisingly, multilateral organisations devote a smaller share of their funds than bilateral providers to multisectoral projects.9 The analysis shows that multisector projects account for a minor share of the overall portfolio of multilateral organisations, fluctuating between about 1% and 7% (Figure 3.14). While a surge in multisector outflows was observed in 2015 – the year the SDGs were adopted – the share has quickly subsided back to very low levels. It is remarkable, though, that the share of multisector projects is considerably higher in earmarked funding: after reaching a peak level of 12% in 2015, the share of multisector activities declined but remained higher than for purely bilateral and multilateral approaches. This suggests that bilateral development partners may use earmarked contributions to steer multilateral organisations towards multisector approaches.

Source: Authors’ calculations based on (OECD, 2020[1]), “Creditor Reporting System”, https://stats.oecd.org/Index.aspx?DataSetCode=crs1.
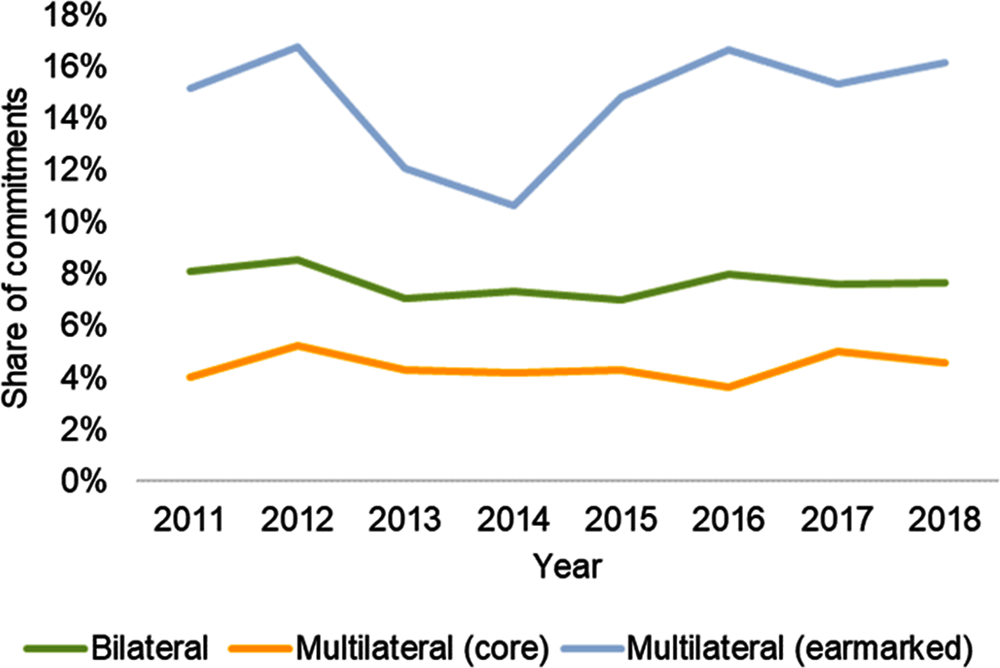
A similar pattern is observed for cross-country or regional activities. Multilateral outflows from multilateral organisations’ core resources are the least likely to target multiple countries (around 3% in 2018). Bilateral providers commit a higher share of their funds to cross-country or regional projects than multilateral organisations (around 8%). On the other hand, a large share of the contributions earmarked through the multilateral development system (around 16%) seems to be directed at cross-country or regional activities (Figure 3.15).
Source: Authors’ calculations based on (OECD, 2020[1]), “Creditor Reporting System”, https://stats.oecd.org/Index.aspx?DataSetCode=crs1.
Counter-intuitively, there seems to be no trade-off between sectoral specialisation and the capacity to engage in multisector approaches. Organisations with a relatively diversified portfolio, such as the MDBs, do not commit a higher share of their funds to multisector activities. This suggests that different departments in those organisations may operate as silos. On the other hand, vertical funds, while highly specialised, present the largest shares of funds committed to multisector purposes. The Global Environment Facility (GEF) is a notable example: in 2016, it committed 83% of its portfolio to multisector projects.
In a similar vein, the regional specialisation of multilateral organisations does not seem to determine the use of cross-country or regional approaches. MDBs and UN entities tend to have a low share of cross-country or regional activities.10 The Nordic Development Fund (NDF) is a notable outlier: in 2017, the NDF committed 98% of its portfolios to cross-country or regional activities. The WHO also features a relatively high share of cross-country or regional projects compared to the other major multilateral organisations (between 27% and 31% over the 2016-2018 period).
The low uptake of cross-country or regional initiatives reflects a dichotomy within the global development agenda. While the global policy framework provided by the SDGs calls for integrated approaches, and underscores the interlinked and cross-border nature of 21st century development challenges, the delivery of development solutions still hinges on partner country governments. As a consequence, despite their global mandates, most multilateral organisations retain a country-based engagement model. The analysis suggests that these traditional structures and operating models may hamper multilateral organisations’ ability to provide global and regional public goods.
Partner governments are the main channels used by multilateral development finance
A large share of multilateral development finance is channelled through recipient governments. The results of the GPEDC monitoring exercise presented in Section 3.2.2 suggested that multilateral organisations tend to make greater use of partner countries’ PFM and procurement systems than bilateral partners and to be better aligned with their development priorities. Analysis based on data from the OECD Creditor Reporting System seems to confirm this observation: it shows that multilateral development finance is more often channelled through recipient governments than is bilateral aid, which tends to rely more on alternative delivery channels, such as NGOs (Figure 3.16).

Note: The period of analysis is 2016-2018. The bars in the left-hand graph indicate the difference between the share of a specific channel in the total portfolios of all bilateral providers and that of all multilateral organisations.
Source: Authors’ calculations based on (OECD, 2020[1]), “Creditor Reporting System”, https://stats.oecd.org/Index.aspx?DataSetCode=crs1.
Recipient governments are a particularly prominent channel for multilateral development banks. This can be explained by the MDBs’ business model and their focus on infrastructure finance, which is often provided to partner countries in the form of loans. In comparison, the UNDS very rarely relies on recipient government channels for implementation. This is partly explained by the high proportion of UN activities carried out in fragile contexts and other difficult environments, where the low capacity and weak institutions of partner country governments can render the use of country systems impractical.
Support to fragile contexts
An abundant literature suggests that the multilateral development system brings substantial comparative advantages in dealing with fragile contexts. The OECD (2009[6]), for example, highlighted three key strengths of multilateral organisations that allow them to perform in this area. First, their systematic involvement in fragile contexts enables them to generate first-hand, comparative expertise. Most bilateral donors, in contrast, focus their aid on a smaller subset of countries and lack specialised expertise in multiple fragile contexts. Second, multilateral organisations have international staff who can bring skills in co-operation with a variety of cross-cultural state forms and institutional arrangements. Third, multilateral organisations have the convening power and legitimacy to pull different stakeholders together under a common strategy. This is in contrast with most bilateral development partners, which may have a harder time convincing partner countries and other stakeholders of their legitimacy and impartiality to carry out such a role.11
Multilateral organisations tend to devote a greater share of resources to fragile contexts than bilateral partners. Remarkably, the share of outflows benefitting fragile contexts is broadly similar between earmarked and core resources (Figure 3.17). However, there are considerable differences across the different categories of multilateral organisations. The UNDS leads, devoting more than half of its funding to fragile contexts. Regional MDBs commit the lowest share of their funding to fragile contexts, although their share is still higher than that of bilateral partners. Considering that this group had the highest share of funding channelled through recipient governments, this shows that there may be a trade-off between the support to fragile contexts and the reliance on country systems. The higher share of support to fragile contexts by the UNDS may also reflect the different needs of fragile countries (e.g. humanitarian aid or peace building activities, rather than longer-term development interventions in social, productive or infrastructure-related sectors). This finding may also reveal the particular distribution of roles within the multilateral development system in the humanitarian-peace-development nexus.

Source: Authors’ calculations based on (OECD, 2020[1]), “Creditor Reporting System”, https://stats.oecd.org/Index.aspx?DataSetCode=crs1.
The magnitude of the development challenges facing the world on the threshold of the “decade of action”12 requires a multilateral development system operating at its full potential. Now is a crucial time for multilateral organisations to assert their value added relative to other channels of development co-operation, and for multilateral stakeholders to push for the reforms required to make the multilateral development system fit for purpose. In addition to the reform areas outlined in Chapter 1, the following actions by multilateral stakeholders could help ensure that the multilateral development system is well-positioned to confront upcoming challenges:
Draw lessons from the multilateral response to the COVID-19 crisis. Assessing the effectiveness of multilateral organisations’ immediate response to the COVID-19 crisis should be a priority for multilateral stakeholders. This would reveal whether multilateral organisations are equipped to confront challenges of this type of magnitude (in particular challenges requiring collaboration and co-ordination across a wide range of sectors), and could also help identify specific areas for improvement. Progress on this front would require a concerted effort from multilateral organisations to disclose details of their COVID-related activities in a comparable format.
Develop statistical methodologies and tools to shed light on the financial leverage and mobilisation capacity of multilateral organisations. The capacity to use its financial resources as leverage to mobilise other sources of finance is considered as a key comparative advantage of the multilateral development system. However, evidence on this aspect of multilateral development finance is difficult to come by due to the lack of detailed data and information in the public domain. One concrete example is the amount mobilised by multilateral organisations from the private sector, which remains a major blind spot of multilateral development finance: the data are shared by multilateral organisations on a strictly confidential basis and can only be presented at the aggregate level. A more granular and better understanding of the financial leverage and mobilisation capacity of the multilateral development system could help identify specific measures to increase the scale of its impact and enhance trust in the system. An MDB – OECD DAC working group is currently working on possible solutions to address MDBs’ confidentiality constraints regarding mobilisation data reporting and disclosure. A potential next step for the OECD DAC could be to conduct an initial mapping and quantification of data gaps in multilateral development finance, which would help to prioritise and plan the improvements required in data collection.
Develop an analytical framework to assess and enhance the selectivity of multilateral organisations’ operations. In a context of constrained resources, as is likely to emerge in the aftermath of the COVID-19 pandemic, better prioritisation of multilateral activities will be key to ensure the best possible use of the scarce resources available (e.g. by making sure that multilateral development finance targets the most in need). Work to assess and improve the selectivity of multilateral development finance should rely on a careful analysis of its complementarity with bilateral ODA and other sources of development finance.
Review the role, focus and contribution of multilateral organisations to specific development challenges deemed a priority for the “decade of action”. The recent survey on DAC members’ policies and practices vis-à-vis the multilateral development system confirmed that multilateral organisations are expected to add value across a range of development areas considered key to progress towards the SDGs in the next decade. An assessment of the contributions of multilateral organisations to some of these key development challenges could help to ensure an adequate focus, prioritisation and alignment of their operations with the expectations of multilateral stakeholders. It could also help explore whether multilateral organisations are sufficiently leveraging potential synergies and opportunities for collaboration, and could help to identify the specific reforms and ways of working required to maximise the contribution of multilateral organisations to the 2030 Agenda. Specific topics to explore could include multilateral organisations’ contribution to: (i) the immediate response to the COVID-19 pandemic, (ii) the fight against climate change; and (iii) a green, resilient and inclusive COVID-19 recovery.
References
[5] Durand, M. and S. Scott (2016), “Measuring multidimensional well-being and sustainable development”, in Debate the Issues: New Approaches to Economic Challenges, OECD Publishing, Paris, https://dx.doi.org/10.1787/9789264264687-6-en.
[4] GPEDC (2018), 2018 Global Partnership Monitoring Round, https://www.effectivecooperation.org/content/gpedc-monitoring-excel-database.
[1] OECD (2020), Creditor Reporting System (database), OECD, Paris, https://stats.oecd.org/Index.aspx?DataSetCode=crs1.
[2] OECD (2020), Survey on DAC providers’ policies and practices vis-a-vis the multilateral development system, Unpublished. OECD, Paris.
[6] OECD (2009), “Concepts and dilemmas of State building in fragile situations: From fragility to resilience”, OECD Journal on Development,, Vol. 9/3, https://doi.org/10.1787/journal_dev-v9-art27-en.
[3] OECD/UNDP (2019), Making Development Co-operation More Effective: 2019 Progress Report, OECD Publishing, Paris, https://dx.doi.org/10.1787/26f2638f-en.
Notes
← 1. The fact that the Development Bank of Latin America (CAF) started reporting to the Creditor Reporting System in 2017 and the Islamic Development Bank (IsDB) Invest started reporting from 2016 onwards, may also explain part of that growth.
← 2. The Global Partnership monitoring assessment of project-level alignment looks at whether: 1) project objectives are drawn from country development plans and strategies; 2) project targets and indicators are drawn from the Country-owned Results Frameworks (CRFs); 3) government data and statistics are used to monitor project results; and 4) the government is involved in project evaluation. For bilateral partners, the average of the first three elements of alignment – when all are available – provides the official data to report on the extent to which development partners respect partner countries’ policy space and leadership in setting their own development path (SDG Target 17.15).
← 3. In this section, multilateral partners refer to all non-bilateral partners that have participated in the 2018 Global Monitoring Round. These include multilateral development banks, vertical funds, UN entities and other multilateral organisations as well as EU institutions. However, the exact list differs from the multilateral organisations reporting to the Creditor Reporting System and that are captured in the quantitative analyses in other sections of the report.
← 4. The results for transparency (Indicator 4) of the 2016 and 2018 monitoring rounds capture the latest assessments available at the time of reporting for each of the respective rounds. CRS data for the 2018 round refer to assessment on reporting to the CRS in 2017; CRS data for the 2016 round refer to assessment on reporting to the CRS in 2014. FSS data for the 2018 round refer to the 2018 survey; FSS data for the 2016 round refer to the 2015 survey. IATI data for the 2018 round refer to scores extracted from the online platform in December 2018; IATI data for the 2016 round refer to scores extracted in May 2016.
← 5. The Global Partnership does not carry out direct comparisons of transparency between bilateral and multilateral partners since their reporting requirements are different and categories for the transparency indicator also differ in some cases. For example, multilateral organisations do not report on tying status, or on both DAC tables and the CRS. Most of them only have one type of aid “project-type interventions” since most of the other categories do not apply to multilateral reporters.
← 6. This analysis uses the average size of an organisation’s country portfolio to assess its potential to achieve economies of scale. However, it should be noted that portfolio size is not sufficient in itself to determine the actual economies of scale achieved by an organisation. To achieve economies of scale, development partners need to leverage the size of their portfolio in a way that generates efficiency gains.
← 7. The definition of specialisation used in this analysis does not imply that organisations with a more specialised portfolio have more technical expertise, or that they provide higher quality and value in their area of speciality compared to organisations that are more diversified. Rather, the degree of specialisation is indicative of the specificity of an organisation’s mandate and operational portfolio.
← 8. Infrastructure still represents around a third of the overall portfolio of the multilateral development banks.
← 9. It should be noted that differences in reporting practices between bilateral and multilateral organisations partly explain the differences in the weight of multisector activities. Multilateral organisations often use automatic mappings between their units or strategic objectives and CRS purpose codes to categorise their financing outflows, while many bilateral donors categorise their outflows on an individual project basis.
← 10. In the case of the World Bank Group, this trend could evolve significantly in coming years since the IDA has increased the size of its regional window by more than 50% in its latest replenishment (IDA19).
← 11. There are, however, multiple examples of lead donors successfully playing that role on specific occasions (e.g. the role played by Australia, alongside other regional partners, in Timor Leste and Solomon Islands).
← 12. At the SDGs Summit in September 2019, the UN Secretary-General Antonio Guterres made a global call for a decade of action to deliver the SDGs by 2030, and world leaders renewed their commitment to the 2030 Agenda.