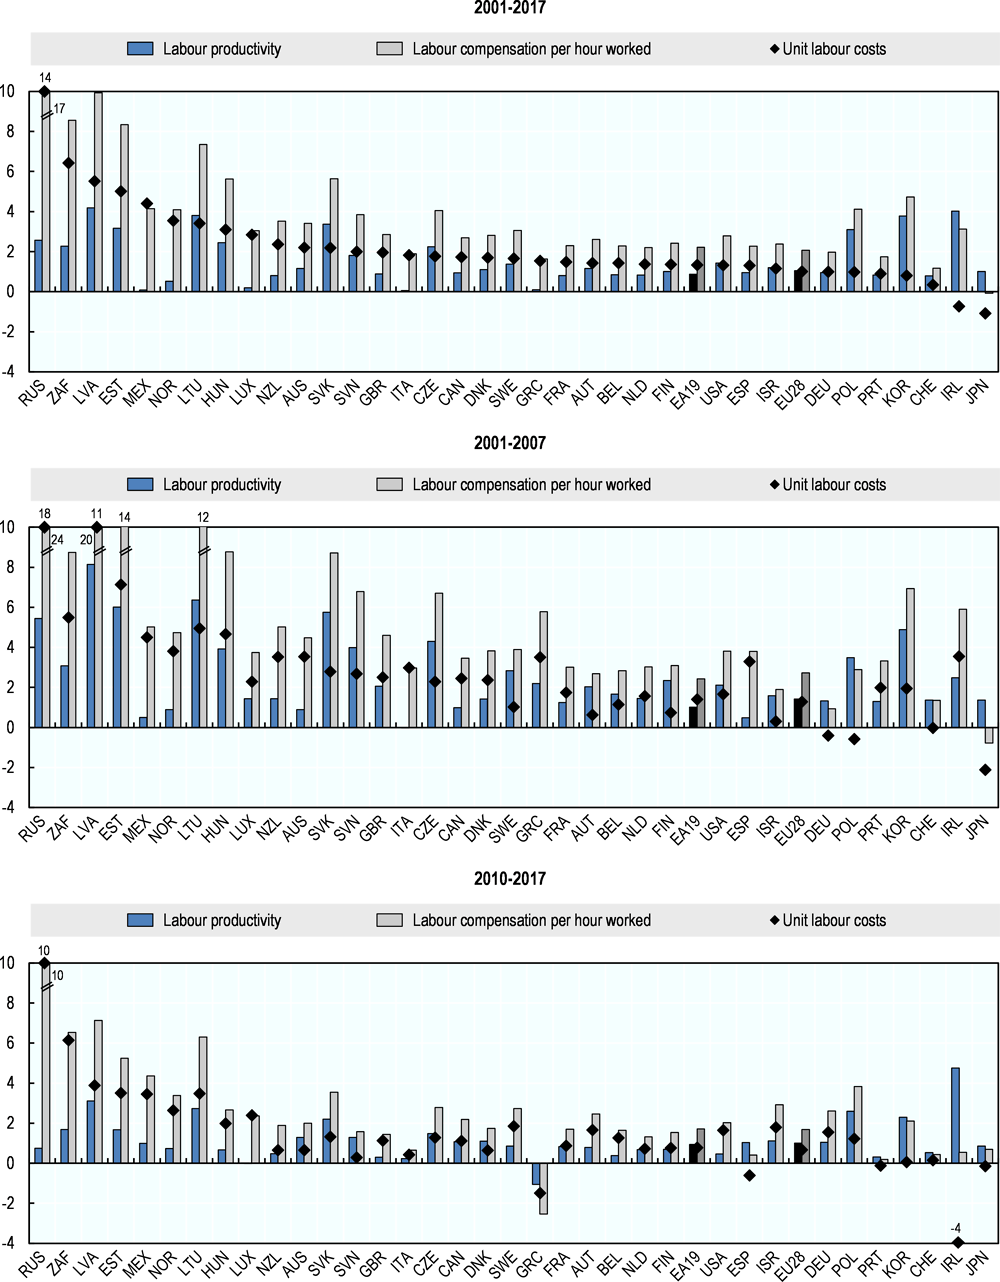
Unit labour costs
Unit labour costs (ULCs) reflect total labour costs relative to a volume of output. Hence, growth in unit labour costs is often viewed as a broad measure of the international cost competitiveness of firms within a country.
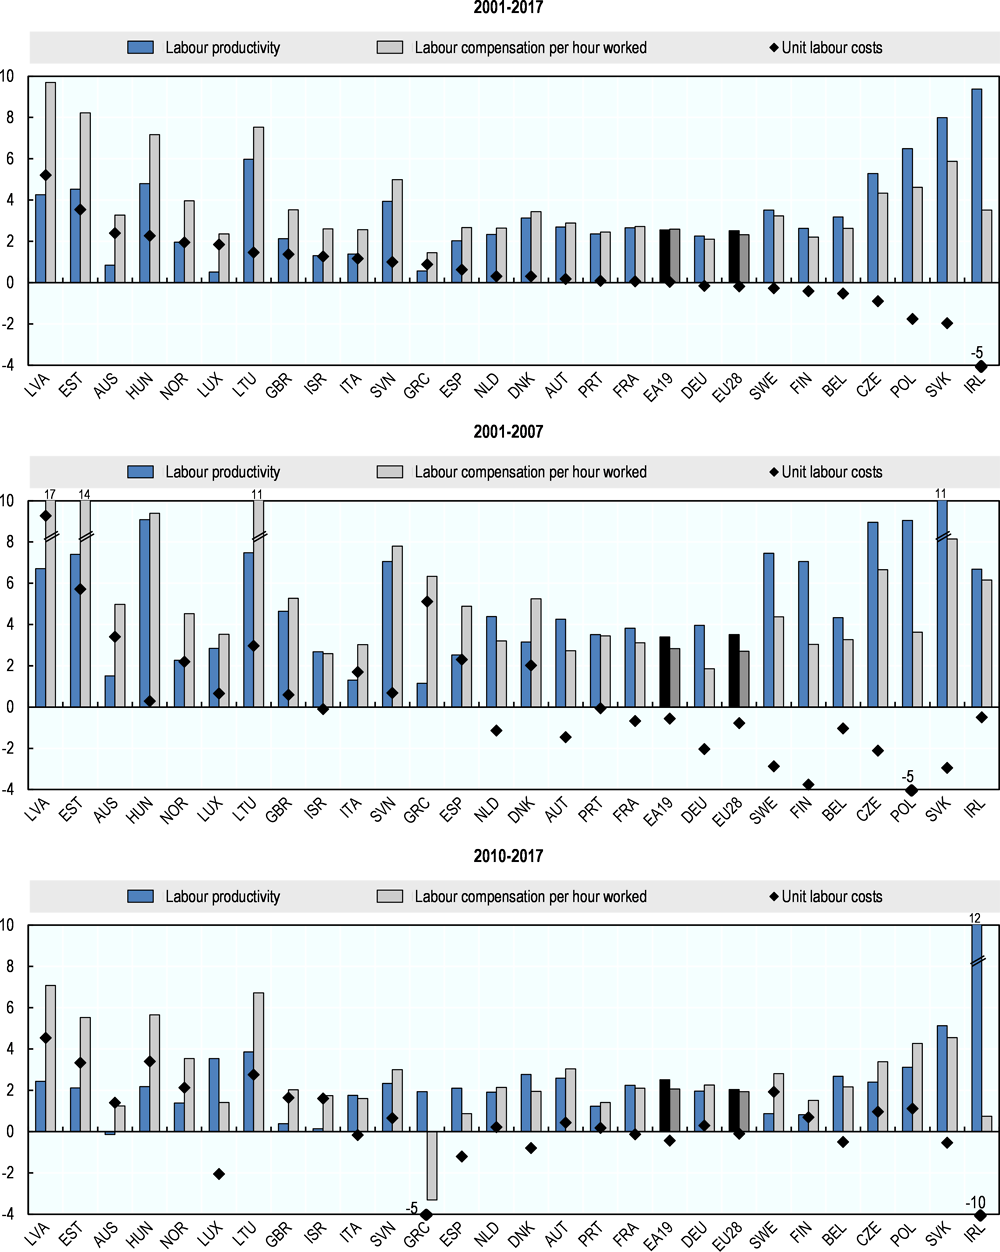
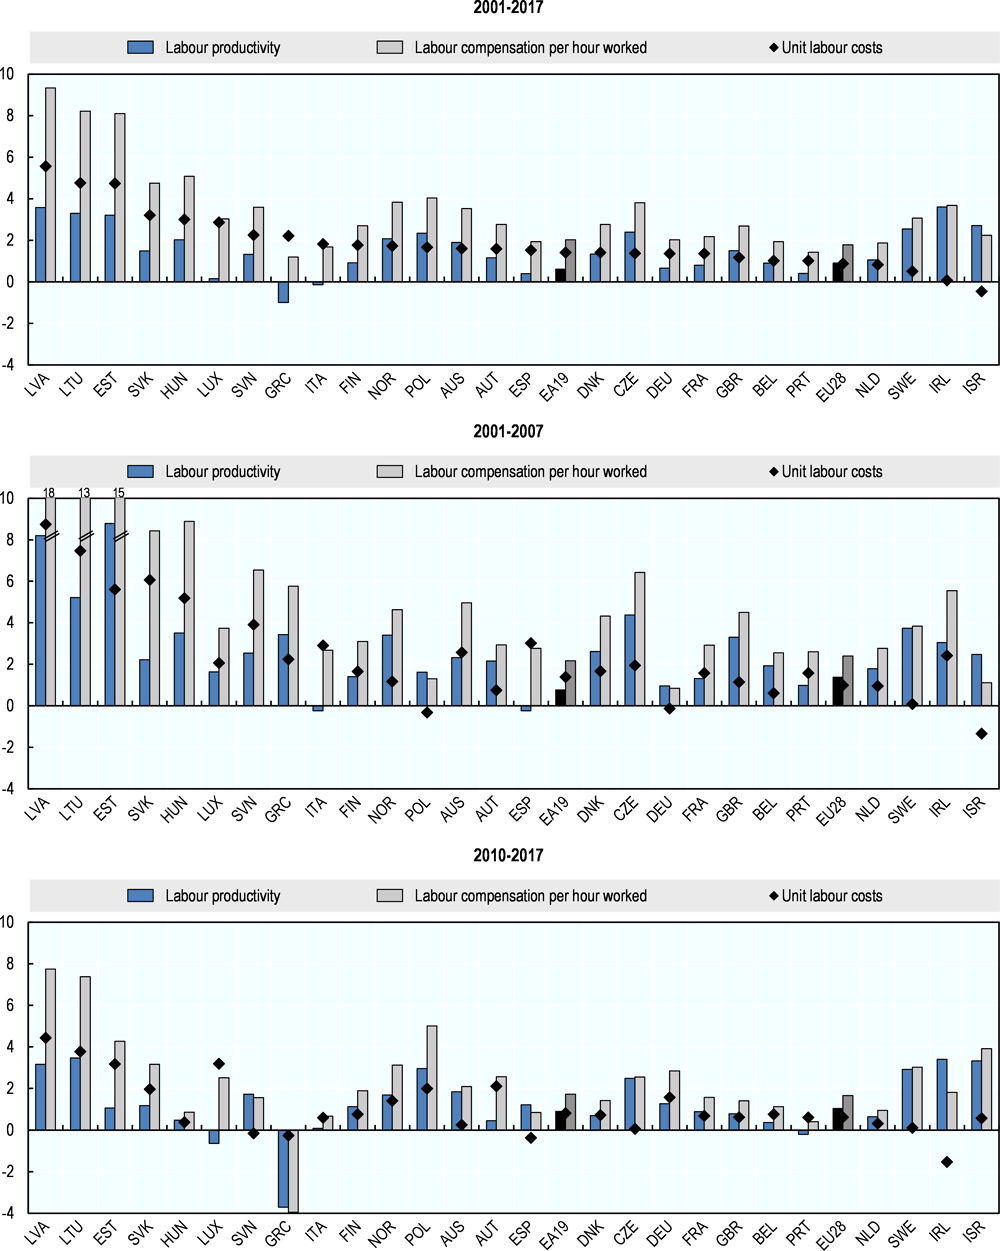
Over the last 15 years, many OECD countries improved their relative competitiveness by keeping ULCs in check in both manufacturing and business sector services, as was the case in Belgium, Germany, Ireland, and Portugal. In these countries, low increases in ULCs reflected relatively strong labour productivity growth and/or moderate wage increases. In the Czech Republic, Korea, Poland, the Slovak Republic and Slovenia, large productivity gains helped to keep ULCs in check despite significant wage increases.
Within Europe, Greece, Ireland, Portugal and Spain saw strong falls in their ULCs since the onset of the financial crisis. However, care is needed in interpreting these results as improved relative competiveness, as they need to be balanced against the significant falls in output and labour input seen during that period.
Definition
ULCs are defined as the average cost of labour per unit of output produced. They can be expressed as the ratio of total labour compensation per hour worked to output per hour worked (labour productivity). Total output is measured here as Gross domestic product (GDP) in constant prices for the total economy and as gross value added in constant prices for economic activities; while total labour compensation is expressed in current prices. Compensation of employees is defined as the total remuneration payable by an enterprise to an employee in return for work done by the latter during the accounting period. It includes wages and salaries payable in cash or in kind, as well as social insurance contributions paid by employers. Total labour compensation is for total persons employed (i.e. employees and self-employed).
Comparability
The data are presented for the total economy, manufacturing and business sector services (which exclude real estate activities) according to the ISIC Rev.4 classification. The series used to construct the ULC measures and its components are primarily sourced from the OECD National Accounts Statistics (database) and disseminated in the OECD Productivity Statistics (database). The figures present the data for those countries for which time series of sectoral hours worked are available in the OECD National Accounts Statistics (database).
Manufacturing ULCs are often perceived as more representative for assessing competition in tradable products. Services prices are often not very reliable, which may affect the cross-country comparability of measured business sector services ULCs.
References
OECD National Accounts Statistics (database), https://doi.org/10.1787/na-data-en.
OECD Productivity Statistics (database), https://doi.org/10.1787/pdtvy-data-en.