copy the linklink copied!5. Policy instruments relevant to sustainable land use
Policy instruments ultimately guide the behaviour of actors in land-use systems, so understanding the interactions between policy instruments and how this impacts land use is key for managing outcomes in the land-use, biodiversity, climate and food nexus. The chapter highlights the need for secure and clear land tenure as a prerequisite for effective policymaking. It then analyses some important regulatory, economic, information and voluntary instruments currently in use across the case studies (Brazil, France, Indonesia, Ireland, Mexico and New Zealand), including where and how these instruments have been effective. The chapter also explores how to address food loss and waste, which can play an important role in reducing emissions from agriculture and pressure on land-use systems.
copy the linklink copied!The need for coherent policy frameworks and instruments
Achieving the intended international and national commitments across the land-use nexus will require policies that are ambitious and coherent, as well as cost-effective and equitable. This Chapter examines some of the key regulatory (command and control), economic and information instruments in place across the six case study countries (Brazil, France, Indonesia, Ireland, Mexico and New Zealand) and provides initial analysis on areas of alignment and misalignment. Examples of policy instruments relevant to the land-use nexus are provided in Table 5.1.
A key determinant of the relative efficiency of a policy instruments is the degree of uncertainty about costs and environmental damage or benefit avoided and induced (Newell and Pizer, 2003[1]). For land-based activities (often substantial) uncertainties about relevant variables complicate the choice between multiple policy instruments aiming to address nexus impacts. For instance, methods to estimate GHG emissions from land use and agriculture are generally less accurate than for other sectors, and typically result in wider ranges of uncertainty. In the case of Ireland for example, more than 88% of the uncertainty of total GHG emissions reported under the UNFCCC was related to agriculture in 2015 (Environmental Protection Agency, 2018[2]). Similarly, imperfect knowledge of biodiversity and the rarely sufficient application of ecosystem service valuation approaches (see below) can hinder the selection of efficient policy instruments. Therefore, improving our understanding of land-based externalities should be an important element of efforts to achieve policy alignment in the land-use nexus.
Coherent policy approaches in the land-use nexus are needed to avoid the “leakage” of adverse land-use nexus impacts (such as GHG emissions (Blanco et al., 2014[3]) or adverse impacts on biodiversity (Maestre Andrés et al., 2012[4]; Lambin and Meyfroidt, 2011[5])). Leakage can occur when production shifts (within or between countries) in response to a certain policy instrument. For example, if protecting a specific area of land from deforestation shifts deforestation pressures to neighbouring areas. International trade in agricultural and forest goods means that international leakage will occur if country A protects its domestic forest but allows for imports of forestry or agricultural products from country B, where deforestation takes place. Coherent policy approaches minimise and prevent misalignments that lead to the occurrence of leakage.
The environmental trends in the case study countries are generally towards increasing absolute GHG emissions and ecosystem degradation (see Chapter 2), albeit with significant intra-country variation. Many of the policies in place have had a positive impact on land-use systems, but the trends highlighted in Chapter 2 suggest there are opportunities to strengthen the scope and implementation of policy instruments. A clear national vision for land use, supplemented with relevant quantitative sectoral targets could help ensure the policy instruments in place are sufficient to address any nexus issues associated with land use.
Clearly-defined land tenure is an important cross-cutting prerequisite for effective policy
An important underlying prerequisite for effective policies for nexus issues, is clear and secure land tenure. Land tenure is defined by Robinson et al. (2013[6]) as the set of property rights associated with land and the institutions that uphold these rights and the security of land tenure as the assurance that land-based property rights will be upheld by society. Land tenure has a variety of forms in the case-study countries, varying from more common forms, such as public or private ownership, to communal forms of tenure such as Eijdos and Comunidades in Mexico, Quilombos in Brazil and Hutan Desa (village forest) in Indonesia. Whether or not tenure systems indicate ownership or simply the rights to manage a certain area of land is also highly variable, but in general communal forms of ownership are more common in tropical countries, particularly in forested areas (Robinson, Holland and Naughton-Treves, 2013[6]).
If the tenure of a given area is not clear, it is difficult to identify the land manager, posing challenges for incentivising environmentally-sustainable activities. Correspondingly, in unclear tenure situations, identifying whether or not a particular activity is legal is challenging. When land tenure is not secure, this can incentivise activities that maximise value in the short term and activities to increase the security of tenure, which in many tropical forest areas leads to land clearing. These challenges are highlighted by the situation in Indonesia where overlapping land claims (Gaveau et al., 2017[7]) and highly fragmented land use institutions (discussed in chapter 4 and (Sahide and Giessen, 2015[8])), have resulted in widespread illegal logging, illegal mining and illegal agriculture. Historically, up to 80% of Indonesian timber exports originated from illegally-sourced wood (Observatory of Public Sector Innovation (OECD-OSPI), 2013[9]), and 2.3 million hectares of deforestation over 1991-2014 and USD 6.5 – 9 billion lost tax revenues over 2003-2014 have been attributed to illegal logging (Chitra and Cetera, 2018[10]; Corruption Eradication Comission (KPK), 2015[11]). While illegal logging may have declined in recent years, it remains a non-negligible factor in Indonesian land use change trends. Not only due to exports of illegally-logged wood products, but also because illegal logging is often a prelude to the establishment of (largely export-oriented) oil palm or timber plantations (OECD, 2019[12]).
Similar to the Indonesian case, illegal logging is also an issue in Mexico and Brazil. In Brazil, unclear land tenure exacerbated the issue of illegal logging in the Amazon as the easiest way to obtain land rights was through conversion (OECD, 2015[13]). While more recent efforts to clarify the situation have resulted in reduced deforestation, a lack of enforcement (Azevedo et al., 2017[14]) and weakening environmental governance (Rochedo et al., 2018[15]), mean the problem is still ongoing. In Mexico, illegal deforestation and forest degradation as a response to increasing demand for agricultural products, such as avocados (Hansen, 2018[16]), is an ongoing issue, which threatens ecosystem service provision (such as carbon sequestration) and critical habitat for the monarch butterfly (Leverkus et al., 2017[17]). Up to 70% of domestically consumed timber is estimated to be harvested illegally (Chapela y Mendoza, 2018[18]), and important quantities of Mexican wood imports originate from illegal logging activities in third countries like Peru (Urrunaga, Johnson and Orbegozo Sánchez, 2018[19]).
Illegal land-use activity is of critical importance to the nexus as it can cause widespread environmental degradation and significant GHG emissions, undermining a country’s ability to achieve national and international targets. Furthermore, illegal activity is by definition not regulated by policy instruments aimed at incentivising environmentally sustainable land management. Reducing illegal activity, like establishing secure land tenure, is therefore a prerequisite for environmentally effective policy in the land-use nexus.
Ecosystem service valuation approaches can inform land-use decisions
Ecosystem services provide significant benefits to society that are regularly un-priced or under-valued by markets (OECD, 2019[22]). The loss of these services due to environmental degradation, therefore, leads to significant cost if these services (e.g. water purification) have to be replaced - and can result in welfare and distributional impacts. For example, in Indonesia the loss of forest is associated with an increase both in childhood disease among rural communities and in local ambient temperatures (Herrera et al., 2017[23]; Wolff et al., 2018[24]).
Economic instruments to address the loss of ecosystem services are used across several of the case study countries (discussed below). Incorporating the valuation of these services into the land-use planning mechanisms could be a useful tool to help reconcile the goals of the nexus. Quantifying the changes in ecosystem services resulting from different policy options, and the value of these changes to society, is a key step to better management of nexus areas. However, despite several ongoing programmes targeting a better understanding of ES mapping and valuation, none of the case study countries has consistently integrated this approach into land-use planning systems.
The EU Mapping and Assessment of Ecosystems and their Services (MAES), aims to create a conceptual model linking pressures to ecosystem conditions and define a broad range of indicators to track ecosystem condition and service delivery across the EU. As part of this initiative, the EFESE (L’évaluation française des écosystèmes et des services écosystématiques) in France aims to assess the extent, quality and value of ecosystems. EFESE has already produced six assessments of different ecosystems.1 Despite some success in using the results of EFESE to aid policy design, a recent EU assessment suggests the outputs are not, as yet, sufficient to effectively incorporate ES values into decision making (Ling et al., 2018[25]).
Beyond the EU, the natural capital approach has been used by both Indonesia and Mexico to try and incorporate the value of ecosystem services into decision making. Indonesia has been tracking forest resources for more than 30 years through the pioneering System of Integrated Environmental and Economic Accounting (SISNERLING). There is also a legal mandate in Indonesia requiring all government departments to develop and inventory of natural resources.2 Development of the SISNERLING is ongoing with the support of the World Bank WAVES (Wealth Accounting and the Value of Ecosystem Services) partnership, which includes improved accounting, the development of land accounts for land-use and land-cover change and a pilot water account for the Citarum River basin (WAVES, 2017[26]).
Despite the considerable progress under the initiatives described above, sufficient data to underpin policymaking is lacking and capacity gaps remain in the case study countries. Consequently, the success of this approach for balancing nexus goals is largely untested. Accelerating the development of and strengthening existing natural capital accounting and ecosystem service valuation approaches is an important opportunity to improve the ability of land-use planning mechanisms to manage trade-offs between the different areas of the nexus.
copy the linklink copied!Regulatory (command-and-control) instruments
Land-use planning
An important regulatory instrument for the nexus areas is land-use planning. Land-use planning is defined by Metternicht (2017[27]) as:
“the systematic assessment of land and water potential, alternatives for land use and economic, and social conditions in order to select and adopt the best land use options. Its purpose is to select and put into practice those land uses that will best meet the needs of the people while safeguarding resources for the future.”
Land-use planning thus includes issues relating to spatial planning, the zoning of land for specific purposes, and rights to manage land in both urban and rural areas. Approaches to land-use planning are variable within the case study countries, reflecting the different national contexts of development and land tenure.
However, there are some common approaches to land-use planning across the case study countries, with decentralised responsibility and spatial planning approaches being widely used. In most case study countries, decentralised responsibility for land-use planning involves national governments setting overarching framework legislation, providing guidelines and standards for how to adopt the most appropriate land use options. In most cases, land-use planning authority is further split between state-, region- or provincial-level governments and municipalities, and carried out through the development of spatial plans, the designation of protected areas, the issuance of permits, and the implementation of national-level policies.
This decentralisation of land-use planning to sub-national governments is unsurprising given the role of planning and development in generating revenues at a local level through taxes. Decentralisation of land-use planning also allows sub-national governments to tailor development to suit the local socio-enviro-economic circumstances, and use the most appropriate solutions to manage nexus goals, within the frameworks and guidelines laid out at a national level. Local public budgets rely on certain types of revenue-yielding land use. But ecosystem service provision is not generally revenue yielding. Some of the case study countries, such as Brazil and France, operate schemes under which local authorities are compensated financially for allocating land to ecosystem service provision. These schemes are known as inter-governmental fiscal transfers (discussed below) can allow local authorities to favour less intrusive land uses over the development of land.
In terms of decentralised land-use planning, there is, however, a key implementation gap between theory and practice. In Indonesia and Brazil, for example, poor regional-level implementation of national-level spatial planning guidelines has led to significant environmental degradation and is hampering the ability of these countries to balance nexus goals. In Indonesia, the lack of clear land tenure and the differential maps used by different nexus-relevant ministries (e.g. Ministry of Agriculture and the Ministry of the Environment and Forests) have contributed land conflicts (Abram et al., 2017[28]) and opportunities for illegal logging, mining and agriculture (Gaveau et al., 2017[7]; Carlson et al., 2012[29]). It is essential that the underlying spatial data used to create plans is consistent across all the nexus-relevant ministries. Indonesia is attempting to harmonise the use of spatial data via the One Map policy, which will contain 85 thematic layers, including concession boundaries, and will be used to underpin land-use decisions. Since its inception in 2011, progress has been hampered by capacity constraints, inter-ministerial conflict and lack of stakeholder enthusiasm (Shahab, 2016[30]). But, 83 of the 85 layers were completed by 2019, and the data was made accessible to the public in 2018 (OECD, 2019[12]). Once complete, the One Map should provide a basis for resolving land tenure and permitting issues.
In Brazil, weakening environmental governance threatens to further undermine land-use planning systems (Rochedo et al., 2018[15]). “Security suspension” (“suspensão de segurança”) is often used to circumvent planning laws and allow infrastructure development, such as hydropower dams, inside ecological-sensitive areas (Fearnside, 2015[31]). The ease with which government can circumvent environmental protections allows the national government to prioritise large infrastructure development over the needs of local (particularly indigenous) populations and undermines the ability of Brazil to balance nexus goals. The significant gap between land-use planning in theory and practice in Brazil and Indonesia creates issues within the nexus. Thus both countries would benefit if the national level planning norms and guidelines were applied and enforced consistently at a municipal level. Achieving sufficient vertical coordination of national norms and guidelines, however, is challenging and will require dedicated institutional mechanisms (chapter 4) and a mix of incentives (such as intergovernmental fiscal transfers) and deterrents, such as credit blacklisting (e.g. in Brazil).
Urban expansion poses a threat to cropland globally, and is expected to result in the loss of 1.8-2.4% of cropland by 2030 (Bren d’Amour et al., 2016[32]). Low-density urban areas are also associated with higher road transport emissions and habitat fragmentation (OECD, 2018[33]). Consequently, provisions limiting urban sprawl and encouraging densification reduce the potential additional pressure on global crop and wild lands, representing a significant nexus alignment. Both France and Ireland have specific measures to encourage densification in their spatial-planning systems. Since 2018, France has utilised the principle of “no net land artificialisation”, which means that agricultural and other non-urban areas should be spared from development. In Ireland, the national planning framework (Project Ireland 2040) includes the control of urban sprawl as a specific objective , with a target of 40% of all new housing to be built within existing built-up areas (Government of Ireland, 2018[34]). Finally, both Ireland and France also include references to biodiversity, either as a specific objective to enhance biodiversity (as in Ireland) or to ensure ecological coherence though the creation of Green and Blue belt networks (trames verts et bleus). Biodiversity-specific planning measures and efforts to limit urban sprawl are well aligned with nexus goals and should be utilised more broadly.
Protected areas
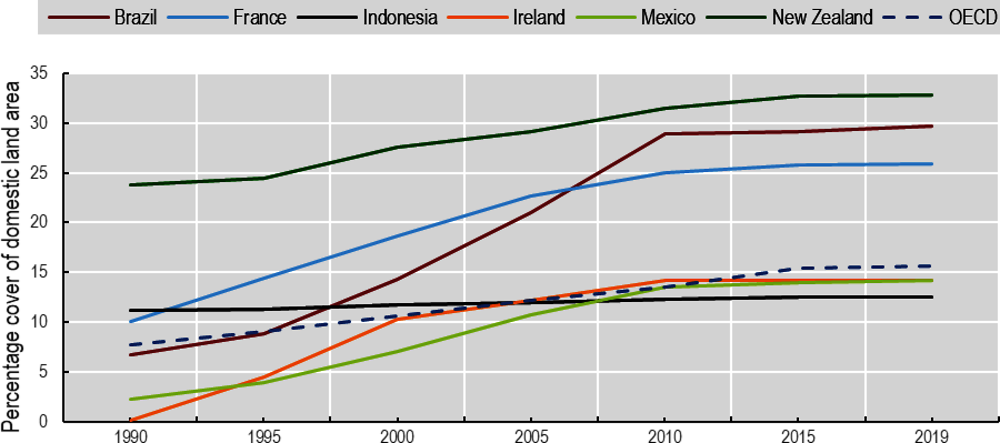
Protected areas (PA)3 are the cornerstone intervention for conserving biodiversity. Within the case study countries, the coverage of PAs has been growing, though there is still large variation in extent across countries, ranging from 12.2% (Indonesia) to 32.7% (New Zealand) of total land area in 2019 (see Figure 5.1). PAs however, represent a range of approaches from strict protection to more general national and international land-use designations, where countries can control or restrict the type of land-use management is allowed within a certain area.
The types of PAs employed by countries are influenced by national land contexts, particularly in relation to land tenure and unmanaged areas. In countries with secure land tenure and small extents of unmanaged land (Ireland and France), land-use restrictions tend be controlled through PA designation that overlap or are entirely within private land. In Ireland and France, for example, sites are designated as Natura 2000 under EU law. Other designations with differing objectives are also used, such as National Parks. Natura 2000 sites are intended to protect high quality habitat or regional nature parks, and aim to reconcile certain types of land management with biodiversity. In Ireland Natural 2000 sites often overlap with private land, and impose restrictions on activities allowed in order to maintain the quality of the site. The situation is similar in France which is subject the same EU regulations as Ireland. This approach, however, if not well managed with sufficient stakeholder engagement, can lead to conflicts between agricultural and environmental stakeholders, who often perceive each other to have conflicting goals (even if their agendas are aligned) such as in Ireland (Woodworth, 2018[35]; Visser et al., 2007[36]). A more decentralised approach, with extensive stakeholder consultation and site specific management plans, such as employed in France, can reduce the potential for conflict (OECD, 2016[37]).
In New Zealand, as well as state owned and managed PAs, “conservation covenants” are an important mechanism for protecting important ecosystems. Under a covenant, landowners enter into legally binding contracts with the Government to protect natural features or areas of natural habitat on their land. In many cases, covenanting land may make economic sense through improvements in water regulation and quality, provision of amenity value to the property, exclusion of stock from areas of land that are difficult to access or manage, and financial transfers to the farmers (QEII National Trust, 2018[38]).
Source: OECD (2019[39]), Protected Area Statistics, https://doi.org/10.1787/5fa661ce-en.
Note: Graph displays an aggregate of all PA reported to the IUCN which includes categories I-VI and No Category. For full methodology see source.
In countries with large areas of unmanaged land, PAs play a key role in preventing the conversion of forests (and other ecosystems) and conserving wilderness areas. While not completely effective, protected areas have reduced deforestation in Brazil (Nolte et al., 2013[40]), Mexico (Pfaff, Santiago-Ávila and Joppa, 2016[41]) and Indonesia (Gaveau, Wandono and Setiabudi, 2007[42]; Gaveau et al., 2012[43]). In Mexico, Brazil and Indonesia, current and historic funding shortfalls have hampered their effectiveness. By controlling land conversion, PAs can contribute to reducing emissions from land use change. In the Brazilian Amazon, an effective PA system could save 8GtCO2e (emissions from LULUCF in Brazil were 1.17GtCO2e in 2016 (SEEG, 2018[44])) between 2010 and 2050 (Soares-Filho et al., 2010[45]) as well as providing biodiversity benefits. Conversely, ineffectively managed PAs can become a significant source of emissions, for example deforestation in PAs in Indonesia contributed 139.4MtCO2e a year between 2000 and 2012 (Collins and Mitchard, 2017[46]).4 Finally, simply excluding activity from a certain area through a PA can displace that activity to another region, either within or outside the same country reducing their ability to balance nexus goals. For a system of PAs to reduce ecosystem degradation and emission from land-use change effectively, these leakage impacts must be considered.
In Brazil, 80% of the current PA system was gazetted after 2000 and now covers 29.1% of the total land area (OECD, 2019[39]). As well as the more traditional PAs, Brazil also makes extensive use of indigenous territories, which now cover 21% of the Amazon region (Le Tourneau, 2015[47]) in addition to the 22.6% already within other PA (de Marques, Schneider and Peres, 2016[48]). This approach has proved to be successful at reducing deforestation up to 2015 (although recent trends may be different). While the biodiversity benefits are less clear, the clarity of tenure associated with this approach to PAs is of benefit to nexus as it prevents conversion if sufficiently enforced. Indigenous reserves (and other forms of community managed PA) could be used more broadly to control land-use change and have the added co-benefit of addressing significant human rights issues.
Moratoriums and other land use restrictions
Moratoriums on certain land-use activities or the use of products from certain areas and other targeted land-use restrictions can work to help effectively balance nexus goals, especially in cases when effective land-use rules in one ecosystem should not be applied in other areas. For example, the high carbon value of peatlands and the emissions from soil oxidation after drainage can undermine climate change targets and therefore they may not be suitable sites for afforestation (Miettinen et al., 2017[49]; DAHG, 2015[50]). Indonesia, for example, has had a moratorium on the issuing of new operating permits in primary forest and peatland areas since 2011,5 and more recently a regulation banning the clearance of all peat areas until after a zoning process (ongoing as of end 2018) has been completed.6 Ireland has also restricted the use of ecologically sensitive and carbon dense peatland areas through regulation (DAHG, 2015[50]).
In isolation, a moratorium will not effectively control land use, particularly in challenging governance environments, where enforcement of other regulations may be lacking. Instead, it should form one part of a broader toolkit of policy instruments that includes a range of reforms, incentives and dis-incentives aimed at altering land use. In 2006, pressure from downstream consumers (including McDonalds and Wal-Mart) and consequently commodity traders (e.g. Cargill) to avoid buying soy grown on deforested areas in the Amazon, led to the soy moratorium in Brazil. The moratorium has been credited with helping achieve a 70% reduction in annual extent of deforestation in the Amazon by 2013 (although recent trends suggest this might be reversing) (Gibbs et al., 2015[51]). Importantly, the enacting of the soy moratorium coincided with parallel efforts by the Brazilian government to reduce the rate of deforestation through land registration (under the CAR), improve monitoring, increase enforcement and expand the PA network (Gibbs et al., 2015[51]; Nepstad et al., 2014[52]). This means that the moratorium itself was just one component of a larger strategy to control land-use change. Contrastingly, in Indonesia, where efforts to improve environmental enforcement, monitoring and reform land tenure are less well developed, the moratoriums on new concession licences have been less successful at reducing deforestation (although deforestation has reduced since 2015) (Hansen et al., 2013[53]; Busch et al., 2014[54]).
Restricting land use within a single biome or ecosystem can shift environmentally destructive behaviour elsewhere (a process known as leakage, see above), undermining the potential nexus benefits of these approaches. To some extent, this is true with the soy moratorium in Brazil, which only covers the Amazon biome, and has shifted the expansion of soy production to the neighbouring, non-forest, Cerrado biome. In the Cerrado rates of habitat loss were consistently 2.5 times that of the Amazon from 2002 to 2011 (Strassburg et al., 2017[55]). Failing to consider the possible leakage of activities restricted by moratoria can lead to significant misalignments between nexus goals in other areas. Hence, targeted restrictions should be consistent with other national and local land-use policies and should consider the potential leakage impacts.
Standards and restrictions
Regulatory standards can have important nexus impacts, either by directly defining which activities are and are not legal in a given area or by officially mandating the use of resources. Such standards can be used in several different aspects of the nexus, such as land cover or use, type and level of agrochemical inputs (e.g. fertilisers and pesticides), mandates for water quality and the control of pollution. Standards and restrictions can be applied in a variety of ways (e.g. through zoning and permits) at local, national and international levels (e.g. EU water framework directive).
In Ireland, the number of cattle has increased by 740 000 animals (10.3%) from 2010 to 2018, predominately driven by a 38% increase in the dairy herd (Central Statistics Office, 2019[56]). This growth has also corresponded with a 10% growth in fertiliser sales in both 2017 and 2018 as dairy farming has intensified. To address the environmental consequences of this increased intensity of farming, Ireland has a nitrates derogation programme that requires intensive livestock farms (defined at above 170kg of livestock manure nitrogen/ha) to adhere to derogation measures designed to reduced pollution. These measure are predominated aimed at breaking the nutrient transport pathway (such as controlling when and how fertilisers are applied) (DAFM, 2019[57]). These derogation measures, in principle, facilitate the sustainable intensification of agriculture, so the value of sector can grow while the environmental impact is minimised, and are, therefore, well aligned with the nexus goals. However, the increasing intensification of dairy farming has corresponded to an ongoing decline in water quality in Ireland (3% decline between 2013-2015). A decline suggesting that this approach may not be sufficient to fully ameliorate the environmental impacts of intensive agriculture (EPA, 2018[58]). Supplementing these kind of derogation measures with other economic incentives, such as taxes (see below), could help improve their effectiveness. This approach was recently suggested in New Zealand, where similar environmental issues from the intensification of dairy farming exist (The Tax Working Group, 2019[59]).
National-level biofuel blending targets are a good example of a standard that can be misaligned with nexus goals. For example, in Indonesia, biofuel blending targets are likely to be driving ecosystem degradation, emissions from land-use change, undermining food production goals by occupying land for food crops, and encouraging the expansion of oil palm plantations. This particular policy was created in response to concerns about reliance on oil imports rather than any nexus-related goals, which likely led to the misaligned (Wright, Rahmanulloh and Abdi, 2017[60]).
While both Brazil and Indonesia directly regulate land cover, their approaches are contrasting. Under the forest code (CAR), Brazil mandates the minimum level of forest cover on farms, which varies between biomes (80% in the Amazon and 20% in Cerrado). Enforcement has been challenging, with one study finding only 6% of properties which had deforested illegally taking steps to reforest (Azevedo et al., 2017[14]). The legal requirement for forest cover targets will likely lead to biodiversity and ecosystem benefits. However, revisions to the CAR in 2012 (upheld but the supreme court in 2018), could reduce its environmental impacts. The revisions allow for a reduced forest cover requirement on private land (from 80% to 50%) in states in the Amazon, if the state has more than 65% of its area covered by conservation units and indigenous territories, potentially allowing the conversion of up to 15 million ha of forest (Freitas et al., 2018[61]). Indonesia takes the opposite approach to Brazil, by legally requiring the conversion of all land7 (e.g. from forest to plantation) within a plantation concession within six years of the concession licence being issued.8 Companies failing to do so risk having non-converted areas transferred to other companies, a policy that has already conflicted with international sustainability standards, such as the Round Table on Sustainable Palm Oil (RSPO) (discussed in section on certification below).
Regulatory standards can also regulate the legal status of certain types of import products and trade practices, and can be important instruments for ensuring forest product legality. Bi- or multilateral, product-specific memoranda of understanding or trade agreement provisions can be an effective approach for preventing the occurrence of export-driven illegal logging, promoting sustainable production standards and addressing leakage impacts.9 One example are the voluntary partnership agreements (VPAs) that the EU has concluded with Indonesia and a number of other countries. VPAs regulate trade in tropical timber and to enforce certain production standards, including through the Forest Law Enforcement, Governance and Trade (FLEGT) scheme. The EU prohibits placing illegally harvested timber and derived products on the EU market, and requires importers to perform ‘due diligence’ checks on timber and timber products.10 By exempting timber with FLEGT licenses issued by the Indonesian government under the VPA from these checks, the EU provides a powerful incentive for timber legality and sustainable production standards in Indonesia. Mexico, too, adopted a new forestry law governing trade in forest products in 2018,11 but critics note the persistence of loopholes for illegally harvested timber to enter the country (Ortiz Tapia, 2018[62]). The impact of the law on curbing trade in illegal forest products will, therefore, be important to observe.
Environmental provisions in trade agreements and other trade policy measures
Requirements for and support to sustainable land-use practices in mutual agreements governing trade relations between trading partners (e.g. Regional Trade Agreements) is a potential way to improve the land-use nexus performance. General environment-related provisions are included in the vast majority of regional trade agreements (RTAs), although approximately one third of RTAs that make reference to the environment do so in the preamble only (Monteiro, 2016[63]). Provisions specific to a particular issue such as land use, on the other hand, are less frequent. One such example is the Comprehensive Economic Partnership Agreement between Indonesia and the European Free Trade Association (EFTA) states (Government of Indonesia and European Free Trade Association, 2018[64]), which was signed at the end of 2018. The agreement includes a chapter on sustainable development and trade, with sub-sections dedicated to specific sectors or sub-sectors. The strict enforcement and monitoring of adherence to the principles set out in this chapter will be essential to ensure a positive impact on land-use outcomes. An environment chapter or provisions on co-operation and participation in environmental matters however remain the exception among the trade agreements that Indonesia is a party to (OECD, 2019[12]).
Variations of land-use references are also included in trade agreements relevant to other case study countries. In Mexico, for instance, the North American Agreement on Environmental Cooperation (NAAEC), a side treaty of NAFTA, governs environmental aspects of trade with Canada and the US, Mexico’s main trading partner. While the land-use impacts of NAFTA seem mixed (see chapter 1, (Mayrand, Paquin and Gagnon-Turcotte, 2008[65]) and (Aguilar et al., 2011[66])), in 2018, a successor to NAFTA was signed with the United States – Mexico – Canada Agreement (USMCA). USMCA contains a chapter on the environment, which includes specific articles relating to trade and biodiversity, trade and conservation, and trade and sustainable forestry management (including a reference to carbon storage) (Governments of the United States; Mexico and Canada, 2018[67]). The environmental provisions contained in the USMCA are furthermore expanded and detailed in the accompanying Environmental Cooperation Agreement (Commission for Environmental Cooperation (CEC), 2018[68]), which also provides for co-operation between the three countries on issues such as biodiversity protection, natural resource management and environmental governance.
A key determinant of the success of environmental provisions in trade agreements to positively influence trade-land use interactions is the extent of their actual implementation and enforcement. In general, information on the implementation of environmental provisions of the case study countries’ existing trade agreements is limited. OECD analysis has found evidence that certain institutional arrangements and governance mechanisms, such as those aiming at increased public involvement in the verification of the implementation of environmental provisions, can benefit the concrete implementation of such provisions (George and Yamaguchi, 2018[69]).
Unilateral trade policy measures can also be an important determinant of land-use outcomes. Demand-side examples of this type of policy measure include preferential tariffs for climate- and/or biodiversity-friendly products (“environmental goods and services”), such as efficient waste management equipment. A supply-side example is the reduction of export subsidies or credits for certain land-intensive agricultural goods, such as most animal products. Another such example is the imposition of charges on exports of goods with substantial associated nexus impacts. Depending on international prices, the Indonesian government for instance imposes both an export levy (ranging between USD 0 and USD 50, (Ministry of Finance, 2018[70]) and an export tax (ranging between 0% and 22.5% (FAO, 2017[71])) on exports of palm oil and its derivatives. Revenues from the export levy, moreover, are in part used to support domestic palm biodiesel production. On the demand-side, import restrictions on nexus-relevant goods such as on corn and rice have been applied by the Indonesian government to meet domestic self-sufficiency targets (FAO, 2017[71]).
Environmental Impact Assessments (EIA) and Strategic Environmental Assessments (SEA)
EIA are used globally to control the impacts of development. Generally, EIA are applied on a project basis and involve and expert of assessment of the expected impacts of the project in predefined environmental domains such as biodiversity, water pollution and climate change. The results of the EIA can then be used by the relevant planning authority to recommend changes (which may be legally binding) to the proposed plan to limit the environmental impacts. Best practice for EIA are summarised briefly in Box 5.1. For large strategic development plans that involve multiple projects, the environmental impact of each project may not be large, but the aggregate impact of all the projects in the plan can be significant. In these cases individual EIAs of the individual projects would not be sufficient control the impacts of the whole development plan SEA can be used as to assess the whole plan as well.
EIA
The use of EIA to assess and limit the adverse impacts of development projects is a common tool throughout all the case study countries. EIA can help to ensure consistency between nexus areas. However, to function effectively, EIA must be transparent, and broad enough to consider all the impacts of development. In Ireland, EIA must assess the habitats and species impacted by the development, with a particular attention to habitats and species protected under the EU habitats and bird directives, the potential GHG emission from the project and its vulnerability to climate change (EPA, 2017[72]). EIA in Ireland also extends to agricultural activity, where certain types of potentially negative land-use change12 must be assessed.
Contrastingly EIA in Indonesia, often do not function effectively to control the impacts of development. Capacity constraints at the local and provincial level to effectively review EIA and lack of independence (assessors are often appointed by the developer) means EIAs are often manipulated by project developers, consequently EIAs in Indonesia are considered a procedural formality (Nugraha, 2015[73]). As a result many project are approved with inadequate EIAs or no EIAs at all. Efforts, however are being made to strengthen the EIA process, for example, in 2016 criminal sanctions were introduced for officials who approve projects without a EIAs and organisations who are operating without the correct permits (OECD, 2019[12]). Continuing efforts to strengthen the EIA process and bring it in line with international best practice (Box 5.1) are encouraged.
SEA
SEAs are used to assess the impacts of larger scale plans and programmes and can be an important tool for ensuring the consistency of development plans with nexus objectives. In Ireland and France, EU law requires that SEAs are conducted for major strategic programmes and development plans taking place in 11 sectors.13 Under Indonesian Law,14 all major development plans are required to produce SEAs as part of the planning process. This includes medium and long-term national and regional development plans. However, capacity constraints at both a national and regional level have hampered its implementation and reduced their ability to influence development policy in Indonesia (Van Der Sluys, 2018[74]). More consistent use of SEAs and improving capacity for their creation would improve the consistency of national strategies and plans (discussed in chapter 3) with nexus goals.
To effectively fulfil their function, assessments such as EIA and SEA must adhere to certain standards that ensure process integrity, efficiency and overall quality. The European Commission (European Commission, 2016[75]) defines eight guiding principles that should govern EIA, many of which should similarly apply to SEA:
-
1. Participation – appropriate/timely access for interested parties
-
2. Transparency – open and accessible assessment decisions
-
3. Certainty – process/timing agreed in advance
-
4. Accountability – decision makers responsible for their actions and decisions
-
5. Credibility – undertaken with professionalism/objectivity
-
6. Cost effectiveness – environmental protection at the least cost to society
-
7. Flexibility – adaptable to deal efficiently with any proposal and decision situation
-
8. Practicality – information/outputs readily usable in decision making and planning
copy the linklink copied!Economic instruments
Economic instruments relevant to the land use nexus are widely used across the six case study countries, though these are most commonly in the form of subsidies. Economic instruments set the incentive framework for land-use and aim to influence the decisions of individual actors by increasing or decreasing the costs of particular actions. There are a wide range of different economic instruments in place across the case study countries (covered in more detail below), which create a complicated interacting set of incentives for land-use actors.
While the individual impacts of each policy instrument are often difficult to discern, on average the incentives in place have led to ongoing environmental degradation (chapter 2). Despite this there are examples where economic instruments have had positive impacts (see Brazil’s ABC policy or the Burren programme and payments for ecosystem services in Indonesia, Mexico and Brazil), showing the potential role economic instruments can play in making land-use systems more sustainable. However, in general the environmental externalities associated with land-use remain largely unpriced and ecosystem services under- or un-valued. Meanwhile the majority of support for land use goes towards agriculture, with over USD 50 billion in subsidy payments in 2016 alone.15 While much of this support is contingent on environmental constraints, a large proportion is not, and often where there are environmental constraints they are not sufficiently rigorous to ensure the sustainability of land use.
The value of native forest for biodiversity is well known and the importance of forestry for climate mitigation is recognised by all the case study countries. Some case study countries (Ireland, New Zealand and France) have set ambitious targets for emissions removal and forestry expansion. But in many cases the economic support for forestry still falls short of incentives available for agriculture, calling into question the ability of these countries to achieve their forestry targets. There is a clear need to consider the incentive structures created by economic instruments for different land-uses (agriculture, forestry, urban development) holistically to better understand how they influence the land-use system at national and local levels.
Environmentally-relevant taxes
Environmentally-relevant taxes can be used to provide a price signal to reduce activities with damaging environmental impacts such as pollution, GHG emissions and water abstraction. Taxes also have the potential to mobilise revenue, which can fund other interventions in the nexus. In general, environmentally-relevant taxes raise the price of an environmentally harmful activity or good, thereby reducing demand and associated environmental impacts. Taxes can reduce the impact of an activity cost effectively, by allowing the polluters to adjust their input variables in a way that suits them. Taxes can also be dynamically efficient by creating a continuing incentive to find new and innovative ways to reduce impacts. However, the cost-effectiveness, and ultimately the environmental effectiveness, of environmentally-relevant taxes vis-à-vis other policy instruments depends on a variety of factors, including the elasticity of demand for environmentally harmful inputs and the level of sensitivity of environmental outcomes to specific activities (Hardelin and Lankoski, 2018[76]).
Pesticide and Fertiliser Taxes
While mineral fertilisers and pesticides are important for the production of food, excess inputs lead to diffuse pollution, which affects water quality, air quality, GHG emissions and ecosystem degradation (Sutton et al., 2011[77]). Controlling their use to ensure optimum inputs taking into account these environmental externalities is essential for achieving consistency across the nexus areas. Despite the considerable environmental impacts of agrichemicals in the case-study countries, only France and Mexico tax the externalities associated with pesticide use (but not chemical fertiliser use) (Table 5.2). France and Mexico use a risk-based approach to pesticide taxation, where the tax rate on individual pesticides is based on the toxicity of the active ingredient.
Risk-based approaches to pesticide taxation allow for a reduction in environmental impacts without harming aggregate agricultural incomes or food production, by shifting pesticide consumers away from more toxic chemicals that require less frequent application (Finger et al., 2017[78]). If the rates are not sufficiently differentiated, however, such taxes could end up incentivising a shift to more environmentally harmful chemicals which can be used at lower volumes, as would be expected in volume-based approaches (Böcker and Finger, 2016[79]). However, risk-based approaches can be costly to administer and complicated to implement, which has so far limited their uptake.
Despite the tax being in place, France has missed its ambitious goals for reducing pesticide usage, with the number of unit doses (a measure of application) increasing by 29% between 2008 and 2014 (although what would have happened in the absence of the tax has not been estimated) (OECD, 2016[37]). The generally low demand elasticity of pesticides necessitates a relatively high tax rate to influence producer behaviour (Böcker and Finger, 2017[80]). Thus, the low tax rates in both Mexico and France (in France the relative rate is around 5% of the value) will probably not incentivise more sustainable pesticide usage and provide nexus benefits (OECD, 2017[81]; Böcker and Finger, 2016[79]).
Pesticide taxes have been successful in raising revenue. In France, the pesticide tax was expected to generate around EUR 150 million by 2016, and in Mexico USD 109 million (MXN 2133.32 million) between February 2014 and September 2017 (OECD, 2017[82]). The revenue raised in France is split, with EUR 71 million funds allocated to the Ecophyto plan II (a pesticide reduction certificate scheme) and the remainder to Water Agencies (OECD, 2017[81]). Both these schemes provide environmental benefits, showing environmentally-relevant taxes can still have positive impacts even when they have limited impacts on behaviour.
The taxing of excessive fertiliser inputs could reduce the impacts of diffuse pollution, benefitting ecosystems and climate without substantial impacts on aggregate food production. Quantifying what constitutes an excessive input of fertiliser is challenging, as a number of factors such as crop, soil type, hydrology and farming practices have to be accounted for. Consequently, models of nutrient losses from agricultural land need to be developed, allowing the implementation of targeted nutrient restrictions, such as the Waikato Regional council’s nitrogen reference points.16 Because of these technical challenges and political economy issues, fertiliser taxation is not widely used globally and none of the case study countries currently tax excess mineral fertiliser inputs. However, the recent report for the Tax Working Group in New Zealand has recommended the implementation of some form of tax on fertilisers to address the impacts of agriculture on the environment (The Tax Working Group, 2019[59]). Beyond, price-based instruments such as taxes, quantitative restrictions of nitrogen and phosphorus losses from agriculture, which face similar technical challenges, are seen as an important strategy. For example, quantitative restrictions in watersheds are seen as key strategy for improving water quality for New Zealand (Muller and Neal, 2018[83]).
Conversely, several of the case study countries have reduced or zero rate VAT on fertilisers (e.g., Ireland, Indonesia and Brazil) thereby implicitly subsidising their use. Taxes are far from the only instruments available to reduce the impacts of excess fertilisers and pesticides, and all the case study countries use regulatory approaches to help address these issues already. Ireland for example has a sophisticated nitrogen derogation programme that mandates how, when and where fertilisers should be applied. However, the ongoing degradation of ecosystems in all the case study countries suggests the regulation may not be enough to address the environmental impacts of agriculture. Implementing taxes on excess fertilisers and pesticides (or at least removing implicit subsidies afforded by VAT reductions or exemptions) represents an opportunity to provide an economic incentive to enhance the impact of existing regulations and better manage nexus goals.
Carbon Taxes
Most carbon emissions from the land-use sector are not priced and while information is limited, an estimated 70% of non-road emissions are not priced or taxed at all (OECD, 2016[84]). The pricing of carbon usually occurs through the provisions of taxes and tradable emissions permits (discussed below). The effectiveness of a carbon tax is dependant of the rate of the tax (e.g. the price it assigns to carbon), which must be high enough to create incentives for taking mitigation actions. While carbon taxes on fuel can effectively price some emission from land use, there are often tax exemptions for agriculture uses (see section on Government support to land use). Carbon taxes on emissions from agricultural land use are an untested instrument for balancing nexus goals, although recent theoretical studies have suggested pricing carbon from land use would have important food security impacts (Frank et al., 2017[85]). Using carbon taxes as a tool to balance nexus goals, therefore, warrants further research.
Emissions trading schemes
Emissions trading schemes (ETS) set a cap on allowable levels of emissions. Different ETS can have different levels of coverage (e.g. geographically or in terms of gases, sectors), and different levels of stringency. Three of the case study countries have national or supra-national emissions trading schemes in place. These are the EU ETS (used in Ireland and France) and the domestic ETS in New Zealand. Currently, emissions from agriculture and forestry are not included in the EU-ETS and emissions from agriculture are excluded from the New Zealand system (although agricultural emissions have to be reported under the system). Agricultural emissions have so far been excluded from the EU ETS (except NO2 emissions from the production of chemical fertilisers) due to concerns surrounding the accuracy of monitoring, reporting and verification, which could lead to distributional impacts through the over- or under- allocation of permits (European Commission, 2008[86]). More recent technological advances, however, have led to suggestions that its exclusion could be revisited (Grosjean et al., 2018[87]). The New Zealand Emissions Trading Scheme (NZ ETS) is the primary policy instrument underpinning New Zealand’s climate change mitigation efforts and, in principle the only ETS in the world to include all sectors of the economy (OECD, 2017[88]). However, due to political constraints and concerns about economic impacts, the entry of the agricultural sector, which is the largest contributor to national emissions, has been delayed several times. Further, NZ ETS carbon prices are well below estimates of the social cost of carbon, and too low to achieve its intended influence (OECD, 2016[84]; OECD, 2017[88]).
Currently, emissions trading schemes and other carbon markets are unlikely to have a major influence on land-use decisions because they exclude the impacts of a primary driver of land-use change, ecosystem degradation and non-energy related emissions: agriculture (Grosjean et al., 2018[87]; OECD, 2016[84]). New Zealand has the only scheme in the world designed to include this sector, but so far its implementation has been slow. It remains to be seen if emissions trading can help balance climate and food goals by encouraging innovation and efficiency increases in the agricultural sector, and land use change between sectors (e.g. from agriculture to forestry). The further integration of agriculture in to the NZ ETS is recommended, as it would serve as a proof of concept. Despite having limited impacts on emissions, the NZ ETS has provided an incentive for afforestation. If the forest planted is native forest, it could also provide biodiversity benefits, representing a significant nexus alignment (Leining and Kerr, 2016[89]).
Besides the case-study countries’ (supra) national-level ETS presented in this section, globally multiple ETS exist at sub-national scale, too. Sub-national ETS can be of relevance to land-use outcomes by including carbon credits from reduced tropical deforestation in third countries or regions (such as those issued under the System of Incentives for Environmental Services (SISA) programme in the Brazilian state of Acre, (Duchelle et al., 2014[90])). A case study country-relevant example for the potential of sub-national ETS to contribute to reducing deforestation is California’s Cap-and-Trade programme. CARB, the scheme’s governing body, has endorsed a tropical forest standard. This standard will facilitate the future allowance of tropical forest offsets into the ETS (CARB, 2018[91]), as envisioned by a Memorandum of Understanding between the States of California (United States), Chiapas (Mexico) and Acre (Brazil) signed in 2010 (State Governments of Acre, Chiapas, 2010[92]).
ETS have the potential to play a role in balancing nexus goals at both national and sub-national levels. Importantly though, without careful guidelines on what activities qualify for emissions credits, ETS could lead to carbon sequestering actives with negative biodiversity consequences, or even negative climate impacts, if activities such as forestry on peat areas are incentivised.
Biodiversity offsets
Biodiversity offsets are “measurable conservation outcomes resulting from actions designed to compensate for significant residual adverse biodiversity impacts arising from project development after appropriate prevention and mitigation measures have been taken” (BBOP, 2009[93]). Biodiversity offsets tend to work via the mitigation hierarchy (avoid, mitigate, offset).17 The fundamental principle that underpins biodiversity offsets is that the impact of development activities can be offset if a sufficient quantity of high quality similar habitat can be created or restored. Thus, well-designed biodiversity offset policies can, in theory, allow for development while achieving a baseline goal of no-net loss of biodiversity, or the more ambitious net-gain objective, through the provision of compensatory measures (OECD, 2016[94]).
Biodiversity offsets can allow development while delivering ecosystem, and in some cases, climate co-benefits (e.g. if the offsets results in the creation of new forest), and are a useful instrument for balancing nexus goals. With the exception of Ireland, all the case study countries have introduced some form of biodiversity offset programme, though these vary substantially in terms of geographic scope, sectoral coverage and design features (e.g. mandatory18 or voluntary). While the general characteristics of these schemes are summarised in Table 5.3, not enough information is available to comprehensively compare their effectiveness.
A lack of clear and consistent guidelines for biodiversity offsets at a national level can reduce the uptake of offset mechanisms and undermine their ability to prevent environmental degradation. In New Zealand for example, Brower et al. (2017[96]) found only 15% of Department of Conservation concessions for commercial activity on conservation land contained compensatory provisions and that of those only 68% reached full compliance. A lack of clarity, technical capacity and enforcement has also undermined the offset schemes of Brazil (Souza and Sánchez, 2018[97]) and a now-replaced, one-off offset scheme in Mexico (OECD, 2016[95]). In France, despite the principle of avoid, reduce, offset being established in law as far back as 1976, the lack of clear guidelines undermined the implementation of effective offsets at a local level until a series of reforms in 2007 (OECD, 2016[37]). The offset process in France was further strengthen in 2013 by guidelines on applying the mitigation hierarchy. In 2016, the French biodiversity law granted the local authority powers to prevent projects where compensatory measures were not sufficient to meet the targets of no-net loss of biodiversity and formally integrated the mitigation hierarchy into the environmental code. Finally, the 2016 law also made the Ministry of Ecological and Solidarity Transition responsible for the creating a database to track biodiversity offset measures, strengthening the process.
Careful design and oversight of biodiversity offsets are essential to ensure consistency between nexus goals. Payment-in-lieu schemes, for example, allow for economies of scale, and spending can be targeted to specific at-risk ecosystems. They also allow countries to adopt a more flexible approach to compensatory mechanisms, ensuring actions can be tailored to specific socio-ecological contexts, without having to create lengthy guidelines. The Mexican CUSTF (Programa de Compensación por Cambio de Uso de Suelo en Terrenos Forestales), for example, aims to compensate for all development in forested areas by requiring developers to pay into the Mexican forest fund. This money is then used to carry out rehabilitation activity in forested areas. The CUSTF covers many sectors with the most common ones being mining, energy transmission, tourism, and agriculture (OECD, 2016[95]). Similarly Brazil operates a payment-in-lieu scheme that requires developers pay into a fund which manages the National System of Units of Conservation (SNUC) (OECD, 2016[94]).
However, unless actions are carried out in a spatially and ecologically balanced way (e.g. according to the Natura 2000 network), biodiversity offset approaches could facilitate the destruction of ecosystems in areas at high-risk of development which host globally important biodiversity. Further, offsets can lead to temporal imbalances if the offset actions occur some time after the habitat conversion. The Mexican CUSTF programme, for example, has experienced difficulty in allocating the resources collected to appropriate offset projects, resulting in delays between land-use change and the creation of offsets (OECD, 2016[95]). Designing offset programmes to account for spatial and temporal imbalances is, therefore, important.
Finally, by taking a more national systematic approach to offset supply countries can avoid the issues associated with project by project approaches seen in New Zealand and France (pre 2008) (Quétier, Regnery and Levrel, 2014[98]; Brower et al., 2017[96]). Biodiversity offset schemes that apply to ecosystems such as forests, or to sectoral activities such as mining, oil and gas, agriculture, are able to target pressures that are relevant to both biodiversity and climate mitigation. But better monitoring, reporting and verification efforts are required to ensure that offsets are delivering these benefits, particularly at the agricultural frontier.
Payments for ecosystem services, including REDD+
Payment for ecosystem services
Payment for ecosystem services (PES) schemes are voluntary programmes that aim to address the market failures which lead to the degradation of ecosystems, and the services they provide, by incentivising management activities to enhance the delivery of these services. PES can be used to deliver ecosystem services at both a local, national and international scale, such as habitat provisioning for biodiversity, clean water, and carbon sequestration.
All of the case study countries, bar Mexico, lack a consistent national-level legal framework to facilitate PES. As a result, the application of PES has been heterogeneous with a wide variety of approaches, a low availability of information and inconsistent monitoring and evaluation (OECD, 2015[13]).19 In Mexico, the national PES scheme (one of the first globally) was introduced in 2003. It has two main components, both of which target forest ecosystems, PES for the conservation of biodiversity and the payments for hydrological environmental services (PSAH). The schemes had a total of 2.4 million ha enrolled in 2016 distributing around MXN 924 million (USD 48 million) to 3111 participants. PES in Mexico has achieved some success and was estimated to avoided 18 000 ha of deforestation between 2003 and 2007 (OECD, 2013[99]) and reduced forest fragmentation (Ramirez-Reyes et al., 2018[100]).
In contrast to Mexico, Brazil does not have a national framework for PES, instead allowing regional/state level governments to formulate their own guidelines and laws (OECD, 2015[13]). This piecemeal approach has led to a number of different PES approaches, but in the majority of cases they are funded by the state and there were over 70 local level schemes operational in 2012 (Guedes and Seehusen, 2012[101]). Brazil does operate two national level schemes, the Bolsa Verde20 and the Bolsa Florestral predominantly aimed at alleviating poverty and supporting traditional, less intensive, farming and livelihood options in communities living in federal or local protected areas. Early evidence suggests the programmes has both reduced deforestation and compensated for the potential livelihood impacts of forgoing more profitable and destructive practices (Börner et al., 2013[102]; Alves-Pinto et al., 2018[103]). An estimated 9 PES programmes (including REDD+ projects) are operational in Indonesia, though they cover a relatively small area of land (Suich et al., 2017[104]) (Table 5.4).
While there are PES projects at local and federal level in Brazil, and local level in Indonesia, national level legislation facilitating the implementation and adoption of PES would benefit the land-use nexus (OECD, 2015[13]; OECD, 2016[37]). However, legislation must take into account the experiences of existing PES schemes and maintain the flexibility that has allowed PES to be successful so far. A key component of successful PES has been the effective and efficient monitoring programmes deployed in Brazil and Mexico to ensure compliance (OECD, 2013[99]). In the case of countries with no currently operational PES, these types of projects represent a potential missed opportunity as they can provide an additional tool for balancing nexus goals and provide societal co-benefits by paying land managers to adopt more environmentally- and climate-friendly approaches.
Reduced Emissions from Deforestation and Degradation and the role of conservation, sustainable management of forests and enhancement of forest carbon stocks in developing countries (REDD+)
Indonesia in particular identifies REDD+ as a key tool for meeting its ambitious AFOLU targets (The Republic of Indonesia, 2017[105]). Since 2007 there has been significant progress towards the implementation of REDD+ in Indonesia including the development of institutions, legal frameworks and governance reforms (The Republic of Indonesia, 2017[105]). There has also been significant investment and a USD 1 billion commitment by Norway in 2010, and 37 REDD+ demonstration/pilot activities in 15 provinces by 2016 (The Republic of Indonesia, 2017[105]). A lack of monitoring and enforcement capacity in Indonesia has so far hampered the implementation of REDD+, reducing Indonesia’s ability to meet GHG emission reduction targets (Enrici and Hubacek, 2018[106]).
There is considerable international interest in REDD+, and in 2010 Norway pledged USD 1 billion to support REDD+ activities in Indonesia. The majority of the USD 1 billion was earmarked for performance based payments. But slow progress mean only around USD 124 million in non-performance based payments had been dispersed by 2018. However, the first payments based on deforestation avoided were made in 2019 (9 years after the fund’s creation) indicating recent progress. REDD+ still represents a key opportunity to manage nexus goals, and continued effort is needed to build on recent success in Indonesia.
In Brazil, the uptake of REDD+ occurred somewhat later than in Indonesia, with the national REDD strategy (ENREDD+) being published in 2015 (May et al., 2016[107]). In contrast to Indonesia, the better monitoring systems in Brazil (e.g PRODES and DETER) allow real-time deforestation monitoring. Implementation of REDD+ has been more successful in Brazil, with over USD 422 million dispersed to 100 projects through the Brazilian Development Bank’s Amazon fund by the end of 2017 (BNDES, 2018[108]). The Brazilian approach to REDD+ uses a range of interventions, incentives and disincentives (including PES). However, while evidence indicates REDD+ has been effective at reducing deforestation up to 2014 (although recent trends may be different) (Simonet et al., 2018[109]), its impacts on forest degradation are less clear, with evaluation hampered by technical issues. REDD+ could be a cost effective tool for balancing climate mitigation goals by providing ecosystem co-benefits, however, more evidence for its effectiveness, particularly in relation to forest degradation, is required.
Government support to land use
Agriculture is the single largest component of land use across all the case study countries and hence government support relevant to agriculture is likely to have significant impacts on land use. This support is highly variable and may include, among other things, market price support for agricultural commodities, payments based on agricultural outputs (whether current or historical), direct support for inputs such as fertiliser, fuel and water, preferential credit for the acquisition of equipment or land, support for improved agro-environmental practices, and support for technology research and development. Subsidies relating to forestry are also of key importance to the nexus, especially in light of the role forests are expected to play in climate mitigation through carbon sequestration. There are also a range of subsidies supporting the development of infrastructure and reducing the cost of transport that can play a role in altering patterns of land use and hence are relevant to the nexus.
Agricultural support

Note: Data for Indonesia only available until 2015
Source: OECD (2019[110]), Producer and consumer support estimates database, https://doi.org/10.1787/6ea85c58-en
National (and international) subsidy regimes can represent significant alignments or misalignments in the nexus sector. Support, in particular for agriculture, can have large impacts on nexus areas, both positive and negative. Government support to agriculture varies substantially across the six countries (Figure 5.2). Indonesia, for example, has the highest rate of agriculture support among the case study countries, estimated to be 29.1% of gross farm receipts (GFR) in 2015 (OECD, 2019[110]).
The subsidy environment in the land-use nexus is complicated with many misalignments, synergies and opportunities to improve. Agricultural support in the case study countries can take different shapes, be that through decoupled payments21 in the EU and Mexico or more direct producer support in Brazil and Indonesia. Agricultural support can have negative environmental impacts if it lowers the cost of finance available to farmers without constraints, if it supports unsustainable practices by lowering the costs of inputs without constraints, if it supports output directly, or if it creates a gap between domestic price of commodities and the international markets (Market Price Support – MPS) (OECD, 2016[111])(Table 5.5). Such support can help maintain unsustainable agricultural practices, maintain agriculture in marginal areas or facilitate the expansion of agriculture, leading to land-use change – such as deforestation and wetland conversion – which can reduce ecosystem services provision.
While the total amount of support relative to gross farm receipts varies considerably, MPS accounts for a large part of the total producer support in all the case study countries (Table 5.5). On the basis of their analytical frameworks, the selected environmental indicators, and the data used, Henderson and Lankoski (2019[112]) find that market price support can be among the most environmentally harmful types of producer support measures. Several countries also subsidise inputs which may lead to unsustainable practices, such as the electricity subsidy for pumping water in Mexico and a zero rate of VAT on fertilisers in Ireland and Indonesia. Further, concessional loans and insurance for agriculture, particularly working capital for commercial farmers in Brazil and the development of timber plantations in Indonesia (Mcfarland, Whitley and Kissinger, 2015[113]; OECD, 2018[114]), may encourage land use change. However, appropriate regulatory frameworks managing nexus impacts and environmental constraints on allowable activities should, in theory, limit adverse effects in some cases. Examples include, the Nitrates Directive in the EU (i.e. relevant to the France and Ireland case studies), which includes restrictions on the application of fertiliser in certain environmentally sensitive areas or the whole territory, and in Brazil environmental and climatic zoning is used to restrict access to subsidies in certain environmentally important regions (OECD, 2018[114]). Understanding where and how to reform potentially environmentally-harmful subsidies, is important for minimising the nexus impacts of agricultural support.
Reforming the most distortive and potentially environmentally harmful support is key to addressing misalignments in the nexus, but understanding the impacts of support is challenging and requires context-specific analysis. The first stage in reforming subsidy systems is, therefore, to identify and assess the nexus impacts of existing subsidies. France has undertaken a study to assess the impacts of public incentives on biodiversity (Sainteny et al., 2011[115]), and Indonesia has recently completed a peer review of its remaining fossil fuel subsidies as part of the G20 process. Greater application of national and peer reviews of subsidy regimes would help ensure incentives with negative nexus impacts are reformed.
Other forms of agricultural support can have complicated impacts on nexus areas. For example, Brazil allocates substantial funding for research and development, 30% of general services support to agriculture was spent on knowledge and innovation in Brazil, compared to 0.5% in Indonesia (Mcfarland, Whitley and Kissinger, 2015[113]; OECD, 2018[114]). This has allowed Brazil to increase the productivity of the soy crop in recent decades (Figueiredo, 2016[116]), and led to some decoupling of production growth from agricultural expansion. These improvements can allow the expansion of food production (and other agricultural products) without the need to convert areas of forest to cropland, and hence help to ensure consistency across nexus areas. However, they can also create incentives to increase cultivated area if expansion is not mediated through other instruments, such as the soy moratorium (discussed in section on regulatory instruments) and other forest conservation measures (Koch et al., 2019[117]). A lack of funding for this area, has, among other things, led to a significant yield gap in the Indonesian oil palm sector, where the average yield is (3.6t/ha) well below the theoretical maximum potential (7t/ha) (Coordinating Ministry of Economic Affairs, 2011[118]). There are also sub-optimal yields from cattle farming in some areas of Brazil, where efforts to conserve forest might lead to intensification, suggesting considerable scope to better balance nexus goals (Koch et al., 2019[117]).
There is also opportunity to improve the environmental conditionality of both coupled and decoupled support payments in Ireland and France. Payments through the European Union Common Agricultural Policy (CAP) in Ireland and France are worth approximately EUR 1.2 billion and EUR 7.1 billion in 2016 respectively, of which 99.9% in Ireland and 85% in France was de-coupled (European Commission, 2017[119]). According to OECD estimates (2019[120]) around 50% of agricultural support in the European Union is conditional on environmental constraints, which represents a considerable resource for potentially improving the environmental performance of farming within these countries. Whilst environmental cross-compliance measures are mandatory, recent reviews of the environmental and cost-effectiveness of these mechanisms suggest they lack the specificity and stringency needed to substantially reduce the environmental impacts of agriculture (OECD, 2020, forthcoming[121]).
The current CAP architecture will be replaced from 2020, and the proposed new framework aims to give more freedom to countries to design their own agri-environmental conditions (European Commission, 2018[123]). This presents an opportunity for France and Ireland to tailor direct payment mechanisms to their specific national contexts and, therefore, improve the performance of these mechanisms in managing nexus goals. Nonetheless, assessment of the environmental impacts of these measures is lacking and evidence for their environmental effectiveness remains equivocal (OECD, 2018[124]; OECD, 2020, forthcoming[121]). Greater monitoring of the environmental impacts of these measures, as proposed in Ireland under the Food Wise 2025 plan (DAFM, 2015[125]), and increased flexibility in the type of environmental constrains allowed, would help ensure decoupled payments work effectively to ensure consistency between nexus areas.
Environmentally related agricultural support
Substantial support for agriculture specifically targets environmental objectives. In theory, this kind of support ensures consistency between nexus areas by incentivising farmers to adopt certain practices that produce some kind of environmental outcome (e.g. reducing environmental pressures from agriculture, or producing ecosystem services). Frequently, this support is targeted at improving outcomes for biodiversity, reducing GHG emissions or both. In Europe, the 2016-20 CAP provides significant funding for these programmes, under Pillar II, which are called agri-environment schemes (AES). AES are voluntary programmes, which pay land managers for adopting certain environmentally friendly practices or retiring land from production.
In Ireland, AES are well funded, with approximately EUR 3.2 billion (out of a total of EUR 4.01 billion) allocated from the rural development fund to AES between 2014 and 2020 (DAFM, 2018[126]). The two largest components of this spending are the Green and Low carbon Agri-environment Scheme (GLAS)22 (EUR 1.1 billion) and the Areas facing Natural Constraints (ANC) scheme (EUR 1.3 billion). GLAS is a highly targeted scheme aimed at improving the sustainability in a number of priority environmental assets: vulnerable landscapes, species and watercourses. However, neither the GLAS nor ANC schemes are performance or results based23 and while monitoring is ongoing and a systematic evaluation of GLAS in underway. The impacts of GLAS on nutrient pollution in water, emissions per ha and biodiversity (both the provision of habitat features and species) are unknown (as of 2018), but initial results show uptake of the scheme has been low with high intensity livestock farmers (DAFM, 2017[127]). Analysis of a previous scheme, the Rural Environment Protection Scheme, showed limited positive impacts on biodiversity, suggesting that these kind of broad scale programmes potentially lack the flexibility and specificity required to deliver on multiple goals (Feehan, Gillmor and Culleton, 2005[128]; McMahon et al., 2010[129]).
Performance-based and spatially focused approaches (on risk areas) have the potential to apply more appropriate solutions and have a better track record of delivering environmental gains than untargeted or practice-based approaches (DAFM and DAHG, 2014[130]; OECD, 2018[124]). A results based scheme has several advantages over other approaches; firstly, it incentivises land managers to deliver environmental benefits (OECD, 2020, forthcoming[121]). Secondly, it allows a greater flexibility in interventions by allowing a land manager to utilise their knowledge of the land to develop context specific interventions. Finally, since the payment is contingent on environmental impact, regular assessment must be a key component of the programme.
A good example of such an approach is the Burren Programme in Ireland, which is one of a number of locally led AES approaches that target specific environmental issues (other programmes target hen harrier declines or freshwater pearl mussels). Just under 50% of payments from the Burren Programme are based on environmental impact and the rest supports capital-investment projects such as improving farm buildings (DAFM and DAHG, 2014[130]). The schemes focuses of species rich limestone grasslands, and monitoring has indicated a continuing improvement in the environmental quality of enrolled fields (DAFM and DAHG, 2014[130]). While result-based approaches are potentially more cost-effective, they can be associated with higher transaction and monitoring costs, which could limit their broad appeal (DAFM, 2017[127]); however increased experience with such schemes, along with technological and institutional innovation, is expected to lower such costs over time (OECD, 2020, forthcoming[121]).
Generally, AES have the potential to improve the environmental quality of farmland, while safeguarding food production in some cases. However, when applied broadly (e.g. GLAS, BPS….) they often lack the contextual specificity to deliver on multiple fronts. Shifting to results based payments could also allow for the stacking of environmental co-benefits (e.g. water, carbon and biodiversity benefits) from land management. Stacking approaches could allow land-managers to receive payments for different ecosystems services provided by management action in the same area, thereby increasing the economic incentive for sustainable land-management (for a full discussion of stacking see (Lankoski et al., 2015[131])). If AES are to deliver multiple nexus goals, more consistent evaluation and monitoring of environmental impacts is required, as current efforts do not allow effective analysis of success, which can be used to inform future iterations of AES. Finally, AES design needs to specify clear, measurable objectives, so that policy performance is able to be evaluated (OECD, 2020, forthcoming[121]).
A different approach to environmentally conditional support is to increase the availability of credit for implementing actions to improve one or more aspects of land management. Brazil operates one such scheme, the low-carbon agriculture (ABC) programme, launched in 2010 as part of the national climate change policy (discussed in chapter 3). ABC operates as a concessional credit line facilitating investment in management practices which are good for the environment and reduce GHG emissions. These management actions include no-till agriculture, the restoration of degraded lands and facilities to treat animal waste (OECD, 2015[13]). By 2015 ABC had facilitated 25 189 loans with a value EUR 4 billion (Mello, 2015[132]), however since then uptake has slowed and 45% fewer loans were issues in 2016 than 2015 (Newton et al., 2016[133]). Between 2010 and 2018 the ABC programme is estimated to have avoided approximately 100-154 MtCO2e (Ministério da Agricultura, Pecuária e abastecimento, 2018[134]), representing a significant nexus alignment, and highlighting the ability of concessional credit schemes to help ensure consistency between nexus areas.
Forestry support
Ireland, France, New Zealand and Indonesia all identify forestry and land use as a key component of meeting their NDC commitments. Ireland, France and New Zealand hope to use an expanded forestry sector to sequester carbon and enhance removals by the land sector (DCCAE, 2017[135]; MPI, 2018[136]; MAA, 2016[137]). In contrast, Indonesia, which has one of the highest levels of GHG emission from land use change globally, aims to reduce emissions from land use change through the reduction of deforestation rates, the better management of existing forested areas and the expansion of plantation timber (Republic of Indonesia, 2016[138]). Forestry programmes have the potential to provide ecosystem and climate co-benefits though the expansion of biodiversity rich native ecosystems and the sequestering of carbon.
Ireland has set an ambitious target to increase forest cover from 11% to 18% by 2050. To achieve these targets an annual increase of 8 290 ha of forest is needed by 2020 (up from 7 140 in 2017) (DAFM, 2015[139]). Areas suitable for afforestation have been identified through an Indicative Forest Statement for Ireland which is based on spatially-explicit data. The platform for afforestation applications, an online GIS system (iFORIS), is used to communicate these data to relevant stakeholders. Areas within Natura 2000 sites may not be accepted in some cases and referred to the NPWS or other relevant state bodies.
The Irish Forestry programme is expected to cost EUR 263 million between 2015-2020, of which the majority, EUR 199.5 million (i.e. 76%), is allocated to afforestation schemes, most of which will be commercial timber plantations (DAFM, 2015[139]). There are also significant provisions for biodiversity within the programme, with requirements for natural woodland buffers around water courses (20m wide), at least 30% of the planting annually must be broadleaf species and the native woodland establishment scheme targeting import areas for biodiversity. Lastly, there is also support (albeit modest) for agroforestry, which is included for the first time. The Irish forestry programme is, therefore, well aligned with the goals of the nexus and having the appropriate safeguards to avoid the potential negative biodiversity consequences of previous programmes, where plantation forestry replaced species rich grass lands in agriculturally marginal areas (ADAS, 2014[140]).
The situation in France is similar to that of Ireland, with forests and woodlands expected to play a key role in sequestering carbon (INRA; IGN, 2017[141]). National Forests and Woodlands programme 2016-2026, highlights the need to increase the utilisation of forests in France though sustainable management practices, maintain the recreational value of forest for French citizens, and enhance their value to climate change mitigation adaptation (MAA, 2016[137]). Progress towards these goals is measured against 49 different indicators with assessments planned in 2020 and 2026. Beyond this programme there is also a national strategy to expand the use of agroforestry, with the aim of improving the contribution of agricultural land to climate change mitigation.
New Zealand had a range of funding mechanisms to encourage the planting of production and permanent forests, which work alongside the emissions trading scheme to provide additional incentives in some places or to offer alternative financing options to make afforestation more attractive to farmers. These included the Afforestation Grant Scheme, the Erosion Control Funding Programme and the Permanent Forest Sink Initiative. Together these instruments have meant that 55% of new forests planted since 2008 have received government grants (MfE, 2013[142]). As of 2019, these funds have been discontinued (or are currently being wound down) and replaced by the One Billion trees programme, with USD 153 million (NZD 234 million) in grant funding over ten years (2018-2027) (Te Uru Rākau, 2018[143]).
Afforestation programmes in New Zealand are well aligned with the countries stated climate goals. For example, providing biodiversity benefits is recognised as a core goal of the One billion trees fund, with higher payment rates available for native species and additional top up funding for meeting additional ecological restoration criteria (Te Uru Rākau, 2018[143]). This was also true historically, with the permanent Forest Sink Initiative giving land owners the opportunity to earn emissions reduction units for carbon sequestered since 2008 through permanent forests that were planted on their land on or after the 1st of January 1990. As of 2013, more than 18 000 hectares of land had been registered under the initiative, roughly three quarters of which was reforested in native species (MfE, 2013[142]).
In contrast to France and Ireland, which have very little primary forest remaining, Brazil, Indonesia and Mexico still have large (albeit decreasing) areas of intact primary forest. In Brazil and Indonesia, historically high rates of deforestation and forest degradation have led to high levels of GHG emissions from land use (Hansen et al., 2013[53]; Ministry of Environment and Forestry, 2018[144]) and consequently forestry programmes are aimed at improving the management of remaining forest areas rather than increasing total forest extent. In Mexico there are both programmes encouraging the management of forests and promoting the expansion of commercial forestry plantation
All the forestry programmes in Mexico were consolidated, in 2013, under the umbrella programme PRONAFOR, which includes the national PES programme (discussed earlier) and the national reforestation and forest restoration scheme. The programme coordinates a range of actions aimed at reforesting and restoring, including the rehabilitation of soil, the distribution of seedlings, and the maintenance of already reforested areas. Since 2007, around 2.8 million ha have been reforested in Mexico under the scheme, although how much actual forest this equates to is unclear as this figure may not account for differential survival rates (OECD, 2013[99]; OECD, 2017[82]). In general, the reforestation actions supported are for the establishment of commercial timber species, so while they are providing climate and other ecosystem benefits, the biodiversity benefits are unclear, indicating partial alignment with nexus areas.
Indonesia also has extensive government support for reforestation, through the Reforestation fund, which comes from a levy imposed by the government on harvested timber (Barr et al., 2010[145]). However, this fund has failed to achieve significant reforestation due to chronic financial mismanagement, corruption and capacity constraints at a local level (Barr et al., 2010[145]). Finally the structure of intergovernmental fiscal transfers (discussed later), results in the reforestation fund in Indonesia actually incentivising deforestation (Nurfatriani et al., 2015[146]). As a result the reforestation fund, along with other more general producer support to agriculture (discussed above) actually become a significant nexus misalignment leading to increased emissions and significant degradation of ecosystems.
The forestry programmes of Ireland, France and New Zealand and the reforestation programme of Mexico will likely provide both biodiversity and climate benefits but in the absence of further technical progress, this may come at the expense of food production. A large proportion of the potential biodiversity benefits are lost due to the promotion of commercial forestry over natural woodland restoration. Evidence suggests that the trade-off between forestry and food production are likely to become more difficult to manage as the supply of marginal land to convert to forestry dwindles, potentially limiting the effectiveness of afforestation.
Notably the support for forestry in France and Ireland is smaller than support to agriculture in relative terms and considerably smaller in absolute terms, but data on producer support to agriculture below EU aggregate level is not readily available (Table 5.6). An equal balance of funding between forestry and agriculture is not desirable, given the relative economic and societal importance of the different sectors. However, the current imbalance between agriculture and forestry means the incentives for forestry are likely not sufficient to encourage reforestation and afforestation on agricultural land. Conversion of agricultural land to forestry is required in countries with ambitious targets for emissions removals from land use (e.g. in Ireland). In New Zealand, the relative support to forestry (in terms of the size of the industry) is larger than agriculture, but the extent of plantation forest has been relatively stable since 2000, suggesting other economic and social factors mean forestry is a less competitive option than agriculture. For example, farmers may be unwilling to sacrifice good-quality pasture for forestry given the quasi-permanent nature of the change, associated lifestyle changes and the lack of compensation for reduced land values (Farrelly and Gallagher, 2015[149]; Gawith and Hodge, 2018[150]).
While, reassessing the balance of public incentives between forestry and agriculture at national and local levels is a good first step to ensure forestry programmes can contribute to climate and ecosystem goals, more research is needed to understand how to make forestry more competitive with agriculture as a land-use option. Finally, without careful regulation afforestation can also be negative for biodiversity and climate if plantation forests replace ecosystems of high biodiversity value, or if it is on peat areas, as the emissions from peat oxidation could exceed the sequestration from tree growth (Miettinen et al., 2017[49]; Buscardo et al., 2008[151])
Biofuels and other
Beyond agriculture and forestry, several other types of subsidy can be significantly misaligned with nexus goals. Subsidised energy inputs in the form of fuel for transport (Brazil, Indonesia), fuel for agriculture (Ireland, France, Mexico), and electricity, often in the form of reduced taxes can lead to both increased GHG emissions and supports inefficient resource use (such as water in Mexico), impacting ecosystems. The value of these subsidies and their impacts on land-use within the case study countries are difficult to estimate, but global support to fossil fuels is estimated at USD 373 billion in 2015. Despite reform efforts (particularly in Indonesia), they represent a significant impediment to harmonising outcomes in the nexus (OECD, 2018[152]).
In several cases, subsidies promoting strategies to reduce emissions through the development of biofuel capacity can have negative impacts on other aspects of the nexus. In Brazil, for example, import duty on foreign-produced biofuel incentivises domestic production from soy (which is 70% of the biofuel feedstock in 2016) (USDA, 2017[153]) which could have negative ecosystem consequences from the further expansion of agriculture. The situation is similar in Indonesia, where large subsidies for domestically-produced biofuel, primarily from palm oil, incentivise the expansion of plantations, increasing the pressure on natural ecosystems (Mcfarland, Whitley and Kissinger, 2015[113]). In Indonesia, the biofuel policy may even have negative climate impacts when the emissions of the whole lifecycle of production are accounted for, especially if it encourages the expansion of oil palm in high carbon value areas such as peatlands (Tilman et al., 2009[154]).
In Ireland, the Public Service Obligation (PSO) is levied on all users of electricity in Ireland and represent both an alignment and misalignment. The PSO has two important nexus implications, firstly it supports the development of biomass electricity generation, which is primarily sourced from plantation forestry in Ireland. Secondly the PSO subsidises the generation of electricity using peat (€103.4million in 2017/18), one of the most carbon intensive solid fuel on the planet, which has negative consequences for both emission and biodiversity (CER, 2017[155]).
In some cases the subsidies causing misalignments in the land use, nexus were implemented for reasons entirely separate from concerns in these areas. For example, the biofuel subsidies in Indonesia are intended to reduce dependence on oil imports (Mcfarland, Whitley and Kissinger, 2015[113]) and peat subsidies in Ireland have been used since the 1950s to support isolated upland communities (DAHG, 2015[50]). However, irrespective of their original motivation, if the land-use consequences are not considered, negative nexus impacts are possible. Some trade-offs are likely to be unavoidable, but countries should try to address these misalignments by assessing subsidy regimes from a climate, land use, ecosystems and food perspective and eliminating the most pressing issues.
Beyond the subsidies that directly incentivise land use change, support to biofuels in all case study countries can have significant impacts on the nexus. Subsidising biofuel production from palm oil in Indonesia and soy in Brazil is likely to lead to increased emissions, the degradation of ecosystems from agricultural expansion and displacing the production of food crops (Mcfarland, Whitley and Kissinger, 2015[113]; Tilman et al., 2009[154]). The same is also true for other countries where biofuel or biomass subsidies might lead to increased demand, which is met with imports. Trade-offs in different nexus relevant goals are inevitable, and understanding these trade-offs in a national context can help to avoid creating perverse incentives to deforest (as in Indonesia). Removing or reforming these types of harmful subsidy would contribute significantly to changing nexus misalignments.
Land reform
As highlighted earlier, secure land tenure is essential for effective policies in the land-use nexus. In France, Ireland and New Zealand, land tenure is mostly clear and secure, but to achieve clarity and security of tenure in Indonesia and Brazil, significant reform is required. Land reform in Indonesia has two major components relevant to the forestry sector; the first is the promotion and expansion of community forestry and the second is agrarian reform. Indonesia has aims to have a total of 12.7 million ha of forest under community management, 4.5 million ha of which is to be allocated by the end of 2019 (Ministry of Environment and Forestry, 2018[144]). Under these programmes, the rights to manage and access land are transferred from the Indonesian state to a local community group. The Indonesian Ministry of Environment and Forestry identifies these schemes as an inclusive pathway to climate change reduction and poverty alleviation by providing access to and the ability to profit from forest resources for local communities (Ministry of Environment and Forestry, 2018[144]). However, the actual amount of land transferred to community management totalled 1.7 million ha by 2018, and while the rate of land reform is increasing, further efforts are needed to strengthen and streamline the process of land reform (Ministry of Environment and Forestry, 2018[144]). Several factors have caused this delay, notably budget cuts to the MoEF and complicated lengthy certification process. However, social forestry schemes still represent a promising pathway for land tenure reform. Efforts to streamline the application process for community forestry are underway, and it has been reduced from 2-3 years to approximately 1 year. But the process is still complicated and capacity building is required to improve community access and the environmental performance of social forestry schemes.
The second component of land reform in Indonesia is agrarian reform. Under the programme of agrarian reform (known as TORA), 9 million ha of land for agriculture will be redistributed to rural communities in order to reduce poverty and inequality. Of this, 4.1 million ha will come from the national forest estate (Ministry of Environment and Forestry, 2018[144]). While this programme targets social goals, it could potentially have negative biodiversity and climate impacts, if the redistributed land contains biodiversity rich ecosystems (e.g. primary forest) or is on peat land areas (Miettinen et al., 2017[49]).
In Brazil, land reform is at a more advanced stage and the approach has been different. The Forest Code has prioritised the mapping and identification of individual land holdings in forested areas and enrolling them in the national CAR (Cadastro Ambiental Rural) system. As of August 2016, 3.7 million properties covering 387 million ha, were enrolled in the CAR (Azevedo et al., 2017[14]). Through this system, enforcement efforts, such as credit black-listing, are used to target land holders who have deforested illegally. While there are issues surrounding the actual enforcement of the Forest Code, with Azevedo et al. (2017[14]) finding only 6% of registered properties took steps restore illegally cleared land, the registration of properties alone reduced deforestation by 10% (Alix-Garcia et al., 2018[156]). Land reform was thus a key component of Brazil’s successful efforts (until 2015) to reduce deforestation in the Amazon.24
The current approaches to reforming land tenure in Brazil and Indonesia are well aligned with nexus goals. Evidence from Brazil suggests that just by the act of registering a property, the rate of deforestation decreases, bringing with it ecosystem and climate benefits (Alix-Garcia et al., 2018[156]). The situation in Indonesia is somewhat more complicated with overlapping institutional jurisdictions and conflicting maps leading to illegal land-use. As such, despite the mixed results of community forestry so far (Santika et al., 2017[157]), continuing efforts to extend community management are essential for removing misalignments in the nexus.
Intergovernmental Fiscal transfers
Every country has multiple governments (barring small city states) and intergovernmental fiscal transfers (IFT)25 are the mechanism through which they carry out fiscal decentralisation. As a result, IFT are the most important feature of sub-national finance in most countries. In general, IFT are used to ensure that the revenue available for sub-national governments is well matched to the needs of the population. IFT can incentivise and advance national, provincial or municipal level goals and objectives such as equality, public service delivery and poverty eradication. As such, IFT are important to the nexus and are of particular importance to large, decentralised countries such as Brazil and Indonesia.
In Indonesia, the revenue a district can earn from the shared revenue fund is directly proportional to the value of the forestry revenues earned, and there is currently no penalty for over-exploiting forested areas. Under the current IFT structure about 40% of the revenues from forestry activity are returned to the producing district. Consequently, district governments have an incentive to maximise forestry revenues through logging and conversion of forests to timber plantations (Nurfatriani et al., 2015[146]). Palm oil plantations also generate revenue which is returned to the producing district, and while the proportion of the revenue returned is much lower, the higher profitability of oil palm results in higher revenue for the producing district in real terms (Irawan, Tacconi and Ring, 2013[158]). This revenue transfer incentivises district governments to maximise their revenue by facilitating the development of plantations in forested areas.
In Brazil the ‘Ecological Value-Added Tax’ (ICMS-E) is a mechanism whereby tax revenues from one state/municipality are transferred to another, in return for providing some form of environmental protection. Since its inception in Paraná in 1991 the ICMS-E has been adopted in 17 states by 2018. ICMS-E was first implemented to reward municipalities for hosting PAs and 16 of 17 states now include specific protected area indicators (Droste et al., 2017[159]). The value of the ICMS-E differs from state to state, but can be up to 8% of municipal value-added tax revenue, and it has been shown to encourage the creation of PA, however analysis of its ecological impacts is lacking (Droste et al., 2017[159]).
France operates a similar system of fiscal transfer to Indonesia, the DGF, where municipalities are paid according to their area and population size. Since 2007 the DGF has also included an ecological component, which awards extra money to municipalities if they are in the core area of a national park, to compensate for the reduced development opportunities (Borie et al., 2014[160]). However, of the 36 783 municipalities in French territory only 150 were eligible for the ecological allocation (in 2014) which represented on 0.02% of the EUR 13.6 billion distributed by the DGF (Borie et al., 2014[160]).
By basing revenue redistribution on environmental performance, IFT could provide a powerful incentive to prioritise nexus goals at a local level, and be used to compensate local governments for providing large shares of national level goods such as biodiversity or climate mitigation. However, by prioritising agriculture, the Indonesian approach potentially creates misalignment between nexus areas. In contrast, Brazil and France utilise specific environmental criteria, but the proportion of revenue allocated under these mechanisms is relative small, limiting their impact. Increasing the revenue available under IFT for achieving specific well-aligned nexus goals would encourage local authorities to manage, sometimes conflicting, nexus areas while allowing them the flexibility to implement locally appropriate measures.
copy the linklink copied!Information, voluntary and other approaches
The inefficiencies in current land-use systems will have significant impacts for society through the climate change and the loss of the ecosystem services (see chapter 2), and have will negative consequences for large parts of the economy (OECD, 2019[22]). Therefore empowering stakeholders, both public and private sector, to make decisions that are both economically profitable and sustainable in the long term is key for effectively balancing the nexus goals. Scientific research, improved access to and use of data and enhancing the transfer of knowledge to the stakeholders that need it most, are all essential for improving land-use decisions. National and subnational governments play a key role in both supporting scientific research and facilitating the flow of information to stakeholders, such as farmers through extension services.
More broadly, governments in the case study countries have begun to use big and open data approaches to try and enhance the sustainability and transparency of land-use. In Ireland, for example, the Origin Green programme (Box 5.3) includes a large data collection effort, which is used to create adaptive management plans. Mexico, since 2013, has considered open government data a policy priority and now makes a wide variety of information on programmes such as biodiversity offsets and PES publically available (OECD, 2018[161]). The role of open access spatial data in democratising land-use is also recognised in the case study countries, with online special data platforms available through Indonesia’s One Map programme, the Department of Conservation in New Zealand and National Commission for the Knowledge and use of Biodiversity (CONABIO) in Mexico.
Several emerging technologies are already playing a key role in increasing the sustainability of land-use. Remote sensing technologies, for example, are already well established for monitoring deforestation in Brazil (through the PRODES and DETER systems), and Indonesia is investing in similar systems to monitor forest fires and land cover change, to supplement existing global systems. Continuing development of these technologies, to refine the detection of non-compliance with environmental regulations, is important for improving the sustainability of land-use. Genomic research is being used to improve the efficiency of milk and beef production in Ireland and New Zealand. Finally, artificial intelligence is increasingly being used to increase the precision and efficiency of farming (CGIAR, 2018[162]) and blockchain is seen as a promising approach for ensuring end-to-end sustainability of consumption (Deloitte, 2017[163]). Governments could play a key role in facilitating research into and dissemination of new technologies when and if they are proven to be effective. Especially, when the stakeholders who need them lack sufficient resources to fully take advantage of these new opportunities (e.g. smallholders in developing countries).
Life cycle assessment approaches
Product life cycle assessment (LCA) approaches employ quantitative methods to assess environmental impacts resulting from the entire life a product, from production to consumption. In LCA, all the impacts associated with the production of a good (e.g. GHG emissions) are considered embodied in the final good at the point of consumption. Therefore, LCA impacts are location independent, and LCA could help quantify leakage under pricing mechanisms such as ETS. LCA can also help to quantify adverse nexus impacts of traded land products more generally. The application, upscaling and further development of LCA approaches in different sectors is an important demand-side measure to prevent the adverse impacts of trade on nexus areas. In the case study countries there are several different initiatives promoting the use of LCA and other approaches to quantify and limiting negative upstream or downstream impacts of domestic production and consumption of goods and services.
The National Strategy to Combat Imported Deforestation (SNDI) (Ministère de la transition écologique et solidaire, 2018[164]), will include a number of demand-side measures to better assess and ultimately reduce deforestation in the supply chain of French goods and services. For example, the introduction of a “zero deforestation” reporting category in private sector CSR reports (measure 11.1) and in reports of non-financial information required from financial institutions and investors (measure 12.1) are both proposed under the SNDI. Moreover, the SNDI recommends a potential widening of the scope of a law prescribing the “duty of care” of French companies for social and environmental risks associated with their supply chains to explicitly include deforestation risks (measure 11.2).
The sustainability criteria for biofuels – as used by France and Ireland under EU regulations – is a good example of the application of LCA in policy. Under EU law, biofuels have to meet certain sustainability criteria requiring life cycle (cultivation, processing, transport) GHG emissions savings of at least 35% compared to fossil fuels.26 The application of LCA in this case was implemented after the initial law was passed, in response to concerns about the risks of indirect land-use change from agricultural expansion in response to increasing demand for oil crops (Frank et al., 2013[165]) . In December 2018 the Renewable Energy Directive II27 introduced a new approach to ILUC by setting a gradually decreasing limit on the countable use of biofuels with high ILUC-risk. As of February 2019, no definition of what feedstock counts as high ILUC-risk biomass has been adopted.
Sustainability criteria in national (or supra-national, such as EU) regulations also impact nexus issues and policy coherence in countries of biofuel or feedstock origin like Indonesia and Brazil. Indonesia, for instance, supplied 49% of the EU’s palm oil in 2017 (European External Action Service, 2018[166]), and around 40% of the EU’s palm oil imports are used for biofuel production (Deutsche Welle, 2018[167]). Oil palm is among the most efficient oilseed crops in terms of yield. As a consequence, if the adverse local production impacts and transport emissions are effectively reduced and managed, palm oil-based biofuels could in theory constitute an example of synergistic trade-land use interactions (Mekhilef, Siga and Saidur, 2011[168]). However, so far managing the impacts of palm oil production has proven challenging (OECD, 2019[12]). While there remains large scope to more effectively manage these trade-offs (Moreno-Peñaranda et al., 2018[169]) and to reduce the land-use impacts of the wider Indonesian palm oil production system (OECD, 2019[12])28, the introduction of the EU sustainability criteria for biofuels has indeed led to changes in Indonesian land-use regulations and practice (Hia and Kusumawardani, 2016[170]). Partly as a response to the criteria, Indonesian palm oil producers were required to follow certain production standards summarised under the Indonesian Sustainable Palm Oil (ISPO) regulation by 2014 (Ministry of Agriculture, 2011[171]).
The involvement of the widest possible range of actors on the supply- and demand-side is important if value chain and life cycle assessment approaches are to exert substantial positive influence on land-use outcomes. For example, the rapid increase in Chinese demand of several key commodity groups since the 2000s accounts for a substantial share of land-use nexus impacts attributable to exports in the case study countries. In 2016 82% of Brazilian soy exports were destined for China, and China constitutes the second-biggest export markets for both Indonesian palm oil and rubber, and the biggest for its forest products (Ministry of Agriculture; Fisheries and Food Supply, 2017[172]; BPS Statistics Indonesia, 2017[173]). Similarly, recent increases in Irish dairy and French roundwood exports are largely attributable to demand from China (Department of Agriculture; Food and the Marine, 2018[174]; Fédération nationale du bois, 2018[175]). Therefore, the involvement of China and other emerging economies in initiatives limiting land-use impacts beyond their own jurisdictional boundaries is essential.
Mandatory and Voluntary certification
A variety of certification schemes operate in the case study countries, both voluntary and mandatory, covering several nexus-relevant areas. One of the most common mechanisms is the certification of forest areas and forestry products. The Programme for the Endorsement of Forest Certification (PEFC) and the Forest Stewardship Council (FSC) are the two largest and most internationally recognised systems. All of the case study countries utilise these two certification mechanisms to differing extents (Figure 5.3). In general, both mechanisms aim to ensure the sustainability of timber supply chains by ensuring various management standards for forestry areas (such as biodiversity conservation and the delivery of ecosystem services) and the legality of timber for secondary products (PEFC, 2010[176]).
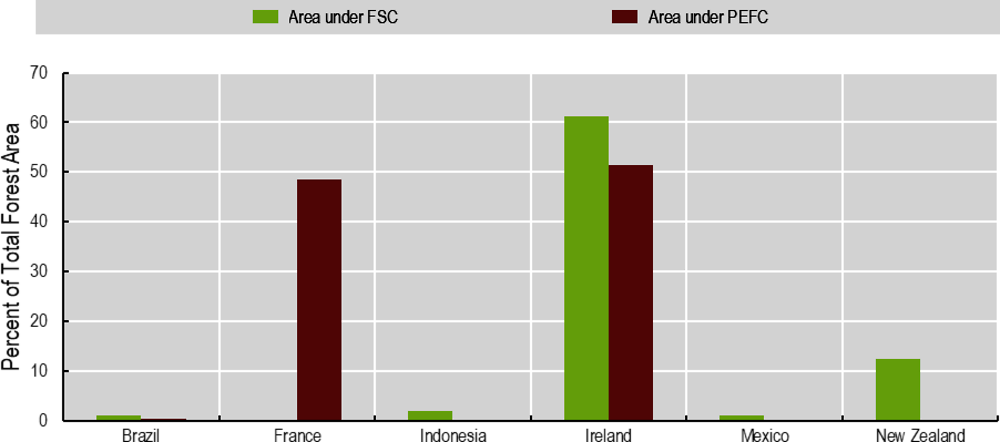
Note: PEFC national standards in Indonesia and New Zealand were officially endorsed in 2014 and 2015 respectively, hence there were no certified forests in 2014.
It must be noted that Indonesia and Brazil have much larger extents of forest so even though only a small percentage is certified, the total area certified is much larger than either Ireland or France.
Mexico does not have a PEFC endorsed national standard.
Source: FAO (2015[177]), Forest Resources Assessment 2015, http://www.fao.org/3/a-i4808e.pdf.
Large international certification systems, like FSC and PEFC, tend to have a large number of criteria for certification. As a result they do not represent a viable commercial option for smallholders or community managed forests, who often lack the capital and technical capacity required for the certification process (McDermott, Irland and Pacheco, 2015[178]). Despite offering a programme specifically tailored to these kinds of suppliers (small and low intensity managed forests programme), only 4% of forest area certified under FSC is managed by smallholders. Consequently, these programmes are not well aligned with forestry systems in tropical countries, which are typically dominated by community and smallholder managed areas. For example, in Mexico at least 70% of all forests is managed by Ejidos or Comunidades (two forms of communal tenure) which supply around 85% of all commercial roundwood (García-Montiel et al., 2017[179]). This lack of penetration into community and smallholder forest limits their utility for influencing nexus outcomes in the tropics, which is particularly important given small holder forestry generated an estimated USD 1.29 trillion in value in 2017 (Verdone, 2018[180]).
The PEFC operates slightly differently to the FSC and effectively endorses national level certification programmes that meet certain sustainability criteria. While national level forestry certification exists in all the case study countries, Mexico is the only case study country that does not have a PEFC endorsed standard.29 Instead, the state developed Mexico Forest Certification (MFC), has fewer and less rigorous standards, making it more attractive to smallholder and community managed forest. This is reflected in the uptake of certification schemes where smallholders favour the MFC and commercial operation the more rigorous FSC (García-Montiel et al., 2017[179]).
Beyond certification for timber management, there are a range of other state, non-state, national and international certification standards covering a wide variety of agricultural supply chains. Gruère (2013[181]) analysed 544 environmental labelling schemes and found around 63% of them were aimed at nexus relevant areas (chemical control, biodiversity conservation, natural resource management and climate change). There has also been a rapid increase in the use of certification and labelling, with a fivefold increase in systems from 1988 to 2007 (Gruère, 2013[181]).
In theory at least, certification standards can be used to balance goals, however, in some cases they can conflict with national legislation. The Round Table on Sustainable Palm Oil (RSPO) provides a good example of these legislative issues. Under the RSPO, companies are required to assess the biodiversity value of the concession and set aside areas of high conservation value preventing conversion. The same is also true under Indonesian law30, however the definitions of high conservation value are very different. Consequently, land set-aside under HCV can and has been excised from concessions and reallocated to non-RSPO companies for development into plantations, posing a challenge to RSPO implementation (Colchester et al., 2009[182]). Crucially, large markets have yet to adopt this standard: very little of the 10.6 Mt of palm oil imported by India and only 50 000 of the 4.8 Mt imported by China was RSPO certified (Schleifer and Sun, 2018[183]). Wider uptake would be needed to reach the goal of raising standards across the industry.
The second challenge to the effectiveness of certification as a tool to manage nexus goals is weak or poor enforcement of the standards. If not properly enforced, certification can fail to deliver environmental benefits and worse still it can be used to legitimise illegal activity. In Indonesia, the timber legality assurance system (SVLK) was set up in 2008 to ensure the legality of timber exported to the EU and issue FLEGT (Forest Law Enforcement Governance and Trade) licences to certified suppliers. However, the weak and inconsistent law enforcement in Indonesia has resulted in the laundering of illegal timber through certified companies (EIA and JPIK, 2017[184]). Weak enforcement of certification standards harms the credibility of the standard, particularly if such weak enforcement is publicly known. For many agricultural commodities and forest sector products, social and environmental production conditions are not visible to the final consumer. While certification schemes offer a way out of this situation of information asymmetry between producers and consumers, a lack of consumer trust (and consequently reduced price premiums) in turn can further limit certification effectiveness.
Certification is currently an effective tool for managing nexus goals in some areas, however, a lack of consistent price premium, capacity shortfalls (particularly among small holders), misalignments with national contexts and poor enforcement undermines its effectiveness. To improve the effectiveness of certification building capacity, particularly around community and smallholder land managers is essential, especially given the role they play in tropical agricultural systems (Verdone, 2018[180]). Finally, improving the auditing and enforcement capacity, again with a focus on more challenging governance environments in tropical systems, would help improve the effectiveness and the reliability of certification systems.
Policy measures promoting responsible business conduct (RBC) can ease pressures on land use originating from both the supply- and demand-side, in particular where they target global value chains. RBC can play an important role in positively influencing the impact of international trade on land-use nexus issues through the reduction of commodity-driven deforestation. As of June 2018, there are globally at least 785 public commitments by 471 producers, traders, manufacturers and retailers not to buy or sell commodities associated with deforestation have been made (Haupt et al., 2018[185]).31 Whether a commitment leads to measurable reductions in deforestation, however, depends on a large array of factors and corporate motivation and the relative power of corporate participants in the supply chain are particularly important (Gasparri and de Waroux, 2015[186]; le Polain de Waroux et al., 2016[187]). Supportive public policies (and other forms of public-private interactions) have contributed to the effectiveness of RBC commitments in reducing deforestation. They include, for instance, the strengthening and endorsement of private RBC standards and codes of conduct, the facilitation of information-sharing for supply chain transparency, public coverage of compliance costs for small producers, or the encouragement of industry self-regulation through threats of stronger public regulation (Lambin et al., 2018[188]).
A best practice example for the achievement of nexus-compatible agricultural supply chains through public-private co-operation is presented by the guidance by (OECD/FAO, 2016[189]). The guidance provides a model enterprise policy for responsible agricultural supply chains and a sample framework for risk-based due diligence integrating environmental protection and the sustainable use of land resources with other RBC principles. It can be used by enterprises to identify measures to effectively improve the environmental and social performance of agricultural supply chains, and by governments to promote these and to align public policies. A pilot project aiming at the implementation of the guidance is currently being undertaken. Participants include companies and initiatives with major operations in the case study countries, but implementation results remain to be awaited and evaluated (OECD/FAO, 2018[190]).
Agricultural information and knowledge transfer schemes
The decisions of individual land managers have a large influence on nexus outcomes, but despite advances in agriculture and forestry management, there are considerable differences between the performance of individual holdings. Closing the yield and efficiency gaps will lessen the pressure on unmanaged land areas, by reducing the need to open up new areas to meet production targets and reducing the emissions-intensity of production by fostering the uptake of climate-smart agricultural techniques.
There is, however, a strong caveat that knowledge transfer and informational approaches focused on efficiency gains and reducing yield gaps will only have the desired effects if they are introduced with a robust legislative framework, particularly concerning land-use change. If the other mechanisms to control land-use change are ineffective, closing yield gaps and increasing farmer efficiency could have the opposite effect, leading to increased biodiversity impacts and emissions. The increased profitability of production could create a rebound effect whereby the level of investment in the sector increases with an associated expansion of production into unmanaged areas. This phenomenon is of particular importance countries with large potential for agricultural expansion (e.g. Indonesia, Brazil and Mexico) and is likely to reduce the potential impacts of productivity increases in the absence of other effective policies (Martha, Alves and Contini, 2012[191]).
Aside from schemes focused on efficiency gains and closing yield gaps, knowledge transfer and information schemes can also be focused on encouraging more sustainable farming and forestry practices. Generally, these are in the form or advisory and extension services, which aim to facilitate and incentivise the uptake of environmentally beneficial land management practices, by highlighting the benefits to land managers and providing the knowledge and skills to put them into practice. Advisory and extension services are provided by a wide range of actors and institutions in the case study countries. For example, they are a key component of agriculture support programmes in Ireland (e.g. GLAS) and New Zealand (e.g Sustainable Farming Fund). While quantitative assessments of advisory and extension services is limited, evidence suggests they play a vital role in the uptake of environmentally-beneficial management practices (OECD, 2015[192]).
The six case study countries use several different approaches to knowledge transfer. In Ireland, knowledge transfer programmes are an integral part of agricultural support programmes (e.g. GLAS) and forestry support schemes (e.g. NeighbourWood scheme and Native Woodland Conservation scheme). In addition, there are several specific schemes directly addressing knowledge transfer in both the agricultural and forestry sectors (e.g. Forest Knowledge Transfer Group Scheme). For example, the Irish Beef Data and Genomics Programme (BDGP) tracks maternal traits of suckler cows in commercial herds to create an index that ranks the efficiency of individual animals under a five star system. This index is then used to support farmer decisions regarding replacement animals with the long-term aim of improving the efficiency of the Irish cattle herd as a whole. Improvements that will deliver emissions mitigation and improved production. The BDGP also require participating farmers to go through an emissions assessment under the carbon navigator programme, further increasing the mitigation impacts. Ireland also co-ordinates the efforts of knowledge transfer schemes, such as the BDGP, though the Origin Green32 programme (see Box 5.3).
Across the case study countries, the level of finance for knowledge transfer and innovation is highly variable. Brazil allocated 25.4% of all agricultural support to knowledge and innovation systems in 2015 (USD 1.8 billion) and Indonesia 0.5% in the same year (USD 209 million) (OECD, 2019[110]).33 To create the co-benefits required for effective management of trade-offs and ensure demand for agricultural products can be met in the future, significant investment in knowledge transfer and innovation programmes is key.
Launched in 2012, Origin Green (OG) is a whole supply chain national sustainability programme for the Irish food and drink sector run by Bord Bía. OG aims to provide the food and beverage industry with an infrastructure to measure and guide sustainability and ensure the industry as a whole is aligned with the SDGs.
Its members include farmers, food and beverage manufacturers, retailers and the food service industry. Farmers are automatically enrolled into OG by signing up to Bord Bía’s sustainability assurance scheme (mandatory for dairy farmers), which includes an 18 monthly audit of their production facilities and farm buildings. With food and drinks producers and other members, Origin Green now covers 90% of Ireland’s food and beverage portfolio and includes several major retailers (Tesco, Lidl and Aldi). Member companies must submit sustainability plans targeting certain areas (e.g. packaging, transport, refrigeration) which are subsequently audited independently.
OG has created 1 600 sustainability targets and 92 biodiversity targets, and has achieved some successes since its inception. These include diverting 4 600 tonnes of waste from landfill, 1.1 million cubic metres of water saved, and reductions in CO2e/kg of milk (1.21 in 2014 to 1.14 in 2016) and beef (11.79 in 2014 to 11.58 in 2016) (Bord Bía, 2017[193]). OG also represents a huge national data collection effort at all levels of the supply chain. The information gained from the data collection is then fed into adaptive management plans, allowing specific tailoring of sustainability programmes for individual members, and the flow of knowledge about best practice both within and between sectors (Bord Bía, 2017[193]).
Finally, the broad mandate of OG has allowed for significant co-ordination between various levels of the supply chain, and different aspect of nexus policy and the institutions responsible. OG has, for example, helped to co-ordinate knowledge transfer for AES and the BDGP, facilitated the development of remote habitat monitoring with Teagasc and helped develop the national pollinator plan with the National Biodiversity Data Centre.
Brazil, the country with the highest level of government investment (both relative and absolute) in agricultural knowledge and innovation systems across the six case studies, has achieved significant success in raising the yields of important agricultural products. These include soy (yield increased from just over 1,000kg/ha in 1970 to 3 200 kg/ha in 2012) (Figueiredo, 2016[116]), beef (17.61 kg c.e/head to 40.13 kg c.e/head 1975-2006) (Martha, Alves and Contini, 2012[191]) and reducing direct emissions from agriculture (Mello, 2015[132]). The Brazilian approach is highly decentralised with the national government playing a co-ordinating role through the Ministry of Agriculture, Livestock and Food Supply, but the actual knowledge transfer and research activities are carried out by state and municipal level organisations such as EMATER (Technical Assistance and Rural Co-operation) and EMBRAPA (Brazilian Agricultural Research Corporation). However, despite the success of these schemes highlighted above, ongoing land-use change in the Cerrado (Strassburg et al., 2017[55]), and Amazon (Hansen, Stehman and Potapov, 2010[194]), highlights the importance of having robust systems in place to control land use and ensure that improved efficiency of production does not also lead to increased land conversion.
copy the linklink copied!Reducing food loss and waste (FLW)
The output of approximately 30% of agricultural land (1.4 billion ha) is wasted or lost every year (FAO, 2013[195]). Reducing FLW therefore has potential to reduce the demand for agricultural land and relieve the pressure to convert natural ecosystems to farmland. Addressing FLW will become increasingly important in the future as demand for agricultural products increases with rising population and levels of development. In fact, the area used to produce lost and wasted food annually is nearly double the predicted area of new cropland required to meet demand by 2060 (710 million ha) (FAO, 2013[195]; Tilman et al., 2017[196]).34 Producing food that is lost or wasted is also associated with significant GHG emissions (4.4 GtCO2e) and water consumption (240km3) which leads to significant impacts on ecosystems. Reducing FLW could play an important role in reducing the impacts of food production on other areas of the nexus, with many different actors across governments, civil society and the private sector having important roles to play.
General approaches
The potential of FLW reduction measures to address nexus issues varies widely according to site-specific and product-specific factors. Thus, the land-use, climate and ecosystem impacts of FLW are heavily influenced by the type of food that is lost or wasted. While milk and meat only contribute 11 per cent of food waste by mass, they account for 78 per cent of the land occupation linked to FLW (FAO, 2013[195]).35 By contrast, despite significant rates of loss, the land occupation associated with vegetables that are wasted is much lower due to their comparatively high yields. In terms of carbon emissions, cereal crops are the largest contributor (34%), largely driven by high fertiliser inputs and paddy field rice systems is Asia which are associated with significant methane emissions from decaying vegetable matter (FAO, 2013[195]). The contribution of cereals to carbon emissions is unsurprising given they constitute approximately 63% of the global food supply and around 57% of all plant-based FLW (Kummu et al., 2012[197]). Animal products on the other hand account for only 15% of total food waste by volume, but 33% of the carbon footprint of FLW (FAO, 2013[195]). Thus, focussing public policies on high impact animal based products and dietary shifts away from meat and dairy products may have a greater ability to relieve demand for agricultural land than policies to address food waste in a general sense, however it is likely both approaches will be required (Willett et al., 2019[198]).
The global food system is complex and consequently causes of FLW are complicated and multi-faceted as well. FLW occurs at every stage of the food production system36, with the highest levels (by volume) associated with the upstream phases (agricultural production and postharvest handling and storage) (FAO, 2013[195]; Kummu et al., 2012[197]). This varies by region, however, and in general high income countries are associated with higher volumes of downstream (processing, distribution and consumption) FLW than lower income countries (FAO, 2013[195]). Since the environmental impacts accumulate along the food supply chain, the later the product is lost or wasted in the supply chain the higher the environmental cost, however the largest proportion of these impacts is associated with the production of the food in the first place (FAO, 2013[195]). It is also important to note that reducing FLW to zero is likely not possible or desirable, as it could lead to reduced food security though increased prices under some scenarios (OECD, n.d.[199]).
Table 5.7 summarises some of the most important sources of FLW in industrialised countries. Actions to address FLW are variable, however, it is possible to define a generalisable hierarchy of actions for addressing FLW, as shown in Figure 5.4. Actions to prevent FLW are given the highest priority under this hierarchy, because they avoid environmental and economic impacts that stretch the length of the food value chain (FAO, 2017[200]; Tonini, Brogaard and Astrup, 2017[201]). Waste management strategies are the least-preferred measures under this hierarchy because of the substantial impacts that food production, processing, and transport have before this point (FAO, 2017[200]). Jørgen et al. (2016[202]) further suggest that actions should focus more on addressing the loss and waste of foodstuffs with the highest environmental impacts, such as animal products and cereal products, and less on those with reasonably low environmental impacts such as certain root vegetables. The EIU (2018[203]) recommend that these hierarchies should be adopted as part of the formal mandates of authorities charged with addressing FLW.
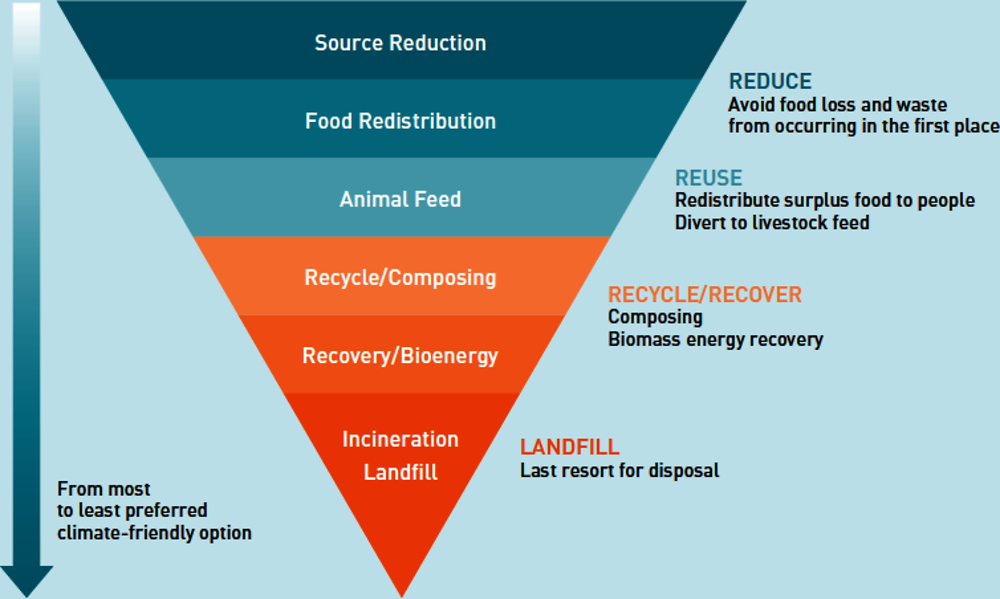
Source: FAO (2017[200]) Save Food for a Better Climate: Converting the food loss and waste challenge into climate action, http://www.fao.org/3/a-i8000e.pdf
Case study examples
There are currently no globally consistent measures of FLW that allow for a comparison of the actual volumes of FLW at different stages of the food chain system across countries (see Chapter 2). Understanding what actions are appropriate and where in the system they should be implemented is, therefore, challenging and likely to be specific to national and sub-national contexts. There are opportunities to reduce FLW at every stage of the food chain system, with downstream losses (processing, distribution and consumption) that are higher in developed countries, making interventions at the later stages of the food chain system preferable. Upstream losses, however, are relatively larger in less developed countries, so targeting these losses, through the improvement of agri-food systems is key (Kummu et al., 2012[197]).
France is a global leader in efforts to reduce FLW, and its actions far exceed the requirements set out by the European Commission, however, to date there is little evidence regarding how successful these efforts have been. France takes a holistic approach to addressing FLW including mandates for education and new business practices. Consequently, France was ranked first out of 35 countries in the EIU’s (2018[203]) index of food loss and waste, which takes into account levels of food waste and the policy responses to it. The French success in passing legislation to address FLW can be attributed to broad public debate and lobbying efforts by civil society.
In 2016, France passed a range of bold measures specifically aimed at addressing FLW. These included granting tax benefits to farmers who donate food that would otherwise be lost, requiring supermarkets to sign agreements with local charities to donate unsold but still edible food, and imposing fines of up EUR 75 000 on supermarkets that discard food (Henz and Porpino, 2017[204]; EIU, 2018[203]). However, the proportion of food that must be donated is not specified by law and consequently, it is likely only a small fraction of food intended for refuse is redistributed. In addition, France has removed expiration dates from foods that do not pose time-sensitive health risks, undertaken information campaigns aimed at educating consumers about food waste prevention, and included food waste prevention within school curricula (EIU, 2018[203]). The lack of national level monitoring makes it difficult to assess the success of these programmes, but a 2017 study found around 24% of food intended for disposal had been redistributed to charities in the province of Isére (Gore-Langton, 2017[205]).
Mexico has a relatively low level of food waste when compared to the other case study countries, although measurement issues likely play a role in the favourable comparison. Measurement issues aside, Mexico does have a long-established and highly sophisticated Programme for Waste Prevention and Integrated Waste Management. This programme formalises the hierarchy of actions to address FLW (Figure 5.4) and therefore focusses efforts on waste prevention. Importantly it includes requirements to measure food waste, which places Mexico in a small grouping of (mostly highly-developed) countries to do so (Champions 12.3, 2018[206]). Furthermore, Mexico has partnered with the United States and Canada under the Commission for Environmental Cooperation (2018[207]) to form the Food Loss and Waste Measurement Expert Group in order to advance the measurement of FLW throughout the supply chain in North America. Given the international nature of food systems, transnational approaches to FLW such as this are particularly important.
Much like France, Mexico has also included FLW into agricultural policies and programmes. Specifically, under Mexico’s Agricultural Sector Programme 9 Strategy 1.6, goals include improving transport networks and storage facilities, investing in cold chain technology, and improving handling capacity for perishable foodstuffs, an approach also utilised in Indonesia (González, 2017[208]; The Ministry of Agriculture, 2015[209]). In addition, the Agricultural Sector Programme 10 Strategy 1.6.8 encourages the reuse of surplus food for the benefit of food-insecure populations (González, 2017[208]), highlighting the potential of FLW reduction programmes to contribute more broadly to food security goals and the SDGs.37
The redistribution of surplus food to food-insecure sections of society is a common approach to addressing FLW, with programmes in operation across New Zealand, France, Mexico, Brazil and Indonesia. This approach is particularly important in countries such as Indonesia and Brazil, where food waste is relatively high, and around one third and one quarter of the population are food insecure respectively. In Brazil, more food is wasted annually than would be required to ensure food security for the entire population - making FLW a moral as well as environmental issue in the country (Henz and Porpino, 2017[204]; Embrapa, 2018[210]).
Much like other facets of the land-use nexus, the complex nature of FLW makes broad approaches difficult, especially in countries with a wide range of socio-economic contexts and differing food systems. In these cases sub-national approaches may be best suited to addressing the specific FLW issues. The city of Palembang in Indonesia, has developed one such programme, which aims to reduce the estimated 116 000 tonnes of food waste produced every year through a programmes of education and biomass utilisation for compost and biogas (Ministry of Agriculture and the Technology Assessment and Application Agency, n.d.[211]). In 2016, the Federal district in Brazil approved a law requiring supermarkets to donate rather than destroy food that is not sold. Supermarkets in breach of this law face fines of up to 3 000 USD, however as of December 2017, no such fines had been levied (Henz and Porpino, 2017[204]).
While all the case study countries have some kind of programme to address FLW the extent and scopes of these programmes is highly variable,38 hence there is still considerable opportunity for improvement. The lack of quantitative, national level targets for reducing FLW outside of France is surprising given the economic and environmental rationale for action and the potential synergies with other key national policy agendas, such as climate change, biodiversity and food security. The absence of consistent FLW monitoring at national and sub-national levels explains to some extent why these targets are missing in many cases. The recent EU effort to define measurement standards (Directive (EU) 2018/851)39 is an important step forward for FLW. However, greater co-ordination at an international level would increase the understanding of this complex issue and help identify key leverage points for policy interventions. While national-level approaches may prove to be too general to effectively reduce FLW in some cases, having national guidelines to define the targets, monitoring systems and basic standards for handling food waste are key for defining the scope within which more specific sub-national actions could take place. While Mexico, France and Indonesia all include some measures for reducing food waste in the agricultural plans (and to some extent Ireland through the Origin Green programme), FLW often has a relatively low profile in the ministries that could have key roles to play (e.g. Agriculture, Transport, Trade). Reducing FLW should be a key component of strategies to balance nexus goals, since it would also result in reduced demand and GHG emissions.
References
[28] Abram, N. et al. (2017), “Oil palm–community conflict mapping in Indonesia: A case for better community liaison in planning for development initiatives”, Applied Geography, Vol. 78, pp. 33-44, https://doi.org/10.1016/j.apgeog.2016.10.005.
[140] ADAS (2014), Ireland’s Forestry Programme 2014-2020: Appropriate Assessment (AA), Natura Impact Statement, ADAS UK ltd, Abingdon, UK.
[66] Aguilar, S. et al. (2011), Environmental Assessment of NAFTA by the Commission for Environmental Cooperation: An Assessment of the Practice and Results to Date, International Institute for Sustainable Development (IISD), Winnipeg, Canada, http://www3.cec.org/islandora/en/item/11047-environmental-assessment-nafta-commission-environmental-cooperation-en.pdf (accessed on 12 June 2019).
[156] Alix-Garcia, J. et al. (2018), “Avoided Deforestation Linked to Environmental Registration of Properties in the Brazilian Amazon”, Conservation Letters, Vol. 11/3, p. e12414, https://doi.org/10.1111/conl.12414.
[103] Alves-Pinto, H. et al. (2018), “Economic Impacts of Payments for Environmental Services on Livelihoods of Agro-extractivist Communities in the Brazilian Amazon”, Ecological Economics, Vol. 152, pp. 378-388, https://doi.org/10.1016/J.ECOLECON.2018.05.016.
[14] Azevedo, A. et al. (2017), “Limits of Brazil’s Forest Code as a means to end illegal deforestation.”, Proceedings of the National Academy of Sciences of the United States of America, Vol. 114/29, pp. 7653-7658, https://doi.org/10.1073/pnas.1604768114.
[145] Barr, C. et al. (2010), Financial governance and Indonesia’s Reforestation Fund during the Soeharto and post-Soeharto periods, 1989-2009: A political economic analysis of lessons for REDD+, CIFOR, Bogor, Indonesia, http://www.cifor.org/publications/pdf_files/OccPapers/OP-52.pdf (accessed on 12 March 2018).
[93] BBOP (2009), Biodiversity Offset Cost-Benefit Handbook, Business and Biodiversity Offsets Programme (BBOP) , Washington, D.C., http://www.forest-trends.org/biodiversityoffsetprogram/guidelines/. (accessed on 28 August 2018).
[3] Blanco, G. et al. (2014), “Drivers, Trends and Mitigation”, in Climate Change 2014: Mitigation of Climate Change. Contribution of Working Group III to the Fifth Assessment Report of the Intergovernmental Panel on Climate Change, Intergovernmental Panel on Climate Change, Cambridge, UK.
[108] BNDES (2018), Amazon Fund, http://www.amazonfund.gov.br/en/home/ (accessed on 29 August 2018).
[80] Böcker, T. and R. Finger (2017), “A Meta-Analysis on the Elasticity of Demand for Pesticides”, Journal of Agricultural Economics, Vol. 68/2, pp. 518-533, https://doi.org/10.1111/1477-9552.12198.
[79] Böcker, T. and R. Finger (2016), “European Pesticide Tax Schemes in Comparison: An Analysis of Experiences and Developments”, Sustainability, Vol. 8/4, p. 378, https://doi.org/10.3390/su8040378.
[193] Bord Bía (2017), Origin Green: sustainability report 2016, Bord Bía, https://www.origingreen.com/globalassets/publications/origin-green-sustainability-report-2016.pdf.
[160] Borie, M. et al. (2014), “Exploring the Contribution of Fiscal Transfers to Protected Area Policy”, Ecology and Society, Vol. 19/1, p. art9, https://doi.org/10.5751/ES-05716-190109.
[102] Börner, J. et al. (2013), Promoting Forest Stewardship in the Bolsa Floresta Programme: Local Livelihood Strategies and Preliminary Impacts, Rio de Janeiro, Brazil: Center for International Forestry Research (CIFOR). Manaus, Brazil: Fundação Amazonas Sustentável(FAS). Bonn, Germany: Zentrum für Entwicklungsforschung (ZEF), University of Bonn, http://www.cifor.org/publications/pdf_files/Books/BBorner1301.pdf (accessed on 21 August 2018).
[173] BPS Statistics Indonesia (2017), Statistical Yearbook of Indonesia 2017, BPS, Jakarta, Indonesia, https://www.bps.go.id/publication/2017/07/26/b598fa587f5112432533a656/statistik-indonesia-2017.html.
[32] Bren d’Amour, C. et al. (2016), “Future urban land expansion and implications for global croplands”, Proceedings of the National Academy of Sciences, p. 201606036, https://doi.org/10.1073/pnas.1606036114.
[96] Brower, A. et al. (2017), “Compliance with biodiversity compensation on New Zealand’s public conservation lands”, https://doi.org/10.20417/nzjecol.42.4.
[151] Buscardo, E. et al. (2008), “The early effects of afforestation on biodiversity of grasslands in Ireland”, Biodiversity and Conservation, Vol. 17/5, pp. 1057-1072, https://doi.org/10.1007/s10531-007-9275-2.
[54] Busch, J. et al. (2014), “Reductions in emissions from deforestation from Indonesia ’ s moratorium on new oil palm , timber , and logging concessions”, pp. 1-6, https://doi.org/10.1073/pnas.1412514112.
[91] CARB (2018), California Tropical Forest Standard, California Air Resources Board, https://www.arb.ca.gov/cc/ghgsectors/tropicalforests.htm (accessed on 13 June 2019).
[29] Carlson, K. et al. (2012), “Carbon emissions from forest conversion by Kalimantan oil palm plantations”, Nature Climate Change, Vol. 3/3, pp. 283-287, https://doi.org/10.1038/nclimate1702.
[56] Central Statistics Office (2019), Central Statistics Office, https://www.cso.ie/en/ (accessed on 12 July 2019).
[155] CER (2017), Public Service Obligation Levy 2017/18, Commission for Energy Regulation, Dublin, Ireland.
[162] CGIAR (2018), Pest and disease monitoring by using artificial intelligence | CGIAR Platform for Big Data in Agriculture, https://bigdata.cgiar.org/pest-and-disease-monitoring-by-using-artificial-intelligence/ (accessed on 23 October 2018).
[206] Champions 12.3 (2018), 2018 Progress Report: An annual update on behalf of Champions 12.3, http://www.champions123.org.
[18] Chapela y Mendoza, G. (2018), “Los bosques de México: Crisis del sector forestal y propuesta de política”, in Leticia Merino Pérez and Alejandro Velázquez Montes (eds.), Agenda Ambiental: Diagnóstico y propuestas, SUSMAI, Mexico City, Mexico.
[10] Chitra, J. and K. Cetera (2018), Indonesia Has a Carrot to End Illegal Logging; Now It Needs a Stick | World Resources Institute, https://www.wri.org/blog/2018/01/indonesia-has-carrot-end-illegal-logging-now-it-needs-stick (accessed on 7 March 2019).
[182] Colchester, M. et al. (2009), “HCV and RSPO: results of an investigation HCV and the RSPO Report of an independent investigation into the effectiveness of the application of High Conservation Value zoning in palm oil development in Indonesia”, http://www.forestpeoples.org/sites/default/files/publication/2010/08/rspoindonesiahcvstudyreportoct09eng.pdf (accessed on 30 March 2018).
[46] Collins, M. and E. Mitchard (2017), “A small subset of protected areas are a highly significant source of carbon emissions”, Scientific Reports, Vol. 7/January 2016, p. 41902, https://doi.org/10.1038/srep41902.
[207] Commission for Environmental Cooperation (2018), CEC launches expert group to better measure food loss and waste in North America | Commission for Environmental Cooperation, http://www.cec.org/news-and-outreach/press-releases/cec-launches-expert-group-better-measure-food-loss-and-waste-north-america (accessed on 2 November 2018).
[68] Commission for Environmental Cooperation (CEC) (2018), Agreement on Environmental Cooperation among the Governments of the United States of America, the United Mexican States, and Canada, CEC, Washington, D.C., https://www.epa.gov/sites/production/files/2018-11/documents/us-mxca_eca_-_final_english.2.pdf (accessed on 15 February 2019).
[118] Coordinating Ministry of Economic Affairs (2011), Master Plan: Acceleration and Expansion of Indonesia Economic Development 2011-2025, Republic of Indonesia, Jakarta, Indonesia.
[11] Corruption Eradication Comission (KPK) (2015), Preventing State Losses in Indonesia’s Forestry Sector: An Analysis of Non-tax Forest Revenue Collection and Timber Production Administration, Government of Indonesia, Jakarta, Indonesia, https://acch.kpk.go.id/images/tema/litbang/pengkajian/pdf/Preventing-State-Losses-in-Indonesia-Forestry-Sector-KPK.pdf (accessed on 7 March 2019).
[57] DAFM (2019), Public Consultation 2019 Nitrates Derogation Review, Department of Agriculture Food and the Marine, https://www.agriculture.gov.ie/media/migration/ruralenvironment/environment/nitrates/2019/PublicConsultation2019NitratesDerogationReview290319.pdf (accessed on 18 June 2019).
[126] DAFM (2018), Review of Expenditure under the Rural Development Programme (RDP) 2014-2020, Department of Agriculture, Food and the Marine, https://www.agriculture.gov.ie/media/migration/ruralenvironment/ruraldevelopment/ruraldevelopmentprogramme2014-2020/ReviewRDPExpenditureJune050718.pdf (accessed on 26 July 2018).
[127] DAFM (2017), The 2017 Evaluation on the Implementation of Ireland’s Rural Development Programme 2014-2020, Department of Agriculture, Food and the Marine, https://www.agriculture.gov.ie/media/migration/ruralenvironment/ruraldevelopment/ruraldevelopmentprogramme2014-2020/2017EvaluationofIrelandsRDP180917.pdf (accessed on 31 July 2018).
[125] DAFM (2015), Food Wise 2025, Department of Agriculture, Food and the Marine.
[139] DAFM (2015), Forestry Programme 2014-2020: Ireland, Department of Agriculture, Food and the Marine, https://www.agriculture.gov.ie/media/migration/forestry/forestryprogramme2014-2020/IRELANDForestryProgramme20142020230215.pdf (accessed on 3 August 2018).
[130] DAFM and DAHG (2014), Burren Farming for Conservation Programme, Annual Report No. 5, http://www.burrenprogramme.com/wp-content/uploads/2015/05/BFCP-Annual-Report-2014.pdf (accessed on 1 August 2018).
[50] DAHG (2015), Managing Ireland’s Peatlands: A national peatlands strategy 2015, Department of Arts, Heritage and the Gaeltacht.
[135] DCCAE (2017), National Mitigation Plan, Department of Communications, Climate Action and Environment.
[48] de Marques, A., M. Schneider and C. Peres (2016), “Human population and socioeconomic modulators of conservation performance in 788 Amazonian and Atlantic Forest reserves”, PeerJ, Vol. 4, p. e2206, https://doi.org/10.7717/peerj.2206.
[163] Deloitte (2017), Continuous interconnected supply chain Using Blockchain and Internet-of-Things in supply chain traceability, https://www2.deloitte.com/content/dam/Deloitte/lu/Documents/technology/lu-blockchain-internet-things-supply-chain-traceability.pdf (accessed on 19 June 2019).
[174] Department of Agriculture; Food and the Marine (2018), Annual Review and Outlook for Agriculture, Food and the Marine 2018, Government of Ireland, Dublin, https://www.agriculture.gov.ie/media/migration/publications/2018/AnnualReviewandOutlook2018310818.pdf (accessed on 4 February 2019).
[167] Deutsche Welle (2018), Can Europe defeat a palm oil ′monster′ of its own making? | Environment| All topics from climate change to conservation | DW | 22.08.2018, https://www.dw.com/en/can-europe-defeat-a-palm-oil-monster-of-its-own-making/a-45171111 (accessed on 8 March 2019).
[159] Droste, N. et al. (2017), “Municipal Responses to Ecological Fiscal Transfers in Brazil: A microeconometric panel data approach”, Environmental Policy and Governance, Vol. 27/4, pp. 378-393, https://doi.org/10.1002/eet.1760.
[90] Duchelle, A. et al. (2014), “Acre’s State System of Incentives for Environmental Services (SISA), Brazil”, in E.O. Sills, S. Atmadja, Sassi, C. de A.E. Duchelle, D. Kweka, I.A.P. Resosudarmo, W. (ed.), REDD+ on the ground: A case book of subnational initiatives across the globe, Center for International Forestry Research (CIFOR), Bogor, Indonesia, https://www.cifor.org/library/5262/ (accessed on 13 June 2019).
[184] EIA and JPIK (2017), Still Permitting Crime, Environmental Investigation Agency, http://jpik.or.id/info/wp-content/uploads/2017/06/Still-Permitting-Crime.pdf (accessed on 18 June 2018).
[203] EIU (2018), Food Sustainability Index, Country Index and Data, http://foodsustainability.eiu.com/ (accessed on 18 October 2018).
[210] Embrapa (2018), Food loss and food waste, https://www.embrapa.br/en/tema-perdas-e-desperdicio-de-alimentos/sobre-o-tema (accessed on 1 November 2018).
[106] Enrici, A. and K. Hubacek (2018), “Challenges for REDD+ in Indonesia: a case study of three project sites”, Ecology and Society, Vol. 23/2, p. art7, https://doi.org/10.5751/ES-09805-230207.
[2] Environmental Protection Agency (2018), Ireland’s Final Greenhouse Gas Emissions 1990-2016, Environmental Protection Agency, Dublin, ireland, http://www.epa.ie/pubs/reports/air/airemissions/ghgemissions2016/Report_GHG%201990-2016%20April_for%20Website-v3.pdf (accessed on 11 June 2019).
[58] EPA (2018), Water Quality in 2017: An Indicators Report, Environmental Protection Agency, http://www.epa.ie/pubs/reports/water/waterqua/Water%20Quality%20in%202017%20-%20an%20indicators%20report.pdf (accessed on 18 June 2019).
[72] EPA (2017), Guidelines on the Information to be Contained in Environmental Impact Assessment Reports, Environmental Protections Agency, Ireland, http://www.epa.ie/pubs/advice/ea/EPA%20EIAR%20Guidelines.pdf (accessed on 31 July 2018).
[123] European Commission (2018), EU Budget: The CAP after 2020, https://doi.org/10.2762/11307.
[119] European Commission (2017), Report on the distribution of direct payments to agricultural producers (financial year 2016), European Commission, http://ec.europa.eu/agriculture/direct-support/direct-payments/docs/small-farmers-scheme_en.pdf (accessed on 28 September 2018).
[75] European Commission (2016), Nature Protection and Environmental Impact Assessment, http://ec.europa.eu/environment/legal/law/2/module_3_2.htm (accessed on 15 May 2019).
[86] European Commission (2008), Proposal for a Directive of the European Parliament and of the Council amending Directive 2003/87/EC so as to improve and extend the greenhouse gas emission allowance trading system of the Community, Commission of the European Communities, Brussels, https://eur-lex.europa.eu/legal-content/EN/TXT/?uri=COM:2008:0016:FIN (accessed on 28 August 2018).
[166] European External Action Service (2018), Palm Oil Facts & Figures on Trade and Sustainability, European Commission, Brussels, https://eeas.europa.eu/sites/eeas/files/20180920_palm_oil_fact_sheet_en.pdf (accessed on 1 March 2019).
[147] Eurostat (2018), Agriculture, Forestry and Fisheries Statistics: 2018 edition, European Union.
[71] FAO (2017), Country Factsheet on Food and Agriculture Policy Trends: Indonesia, Food and Agriculture Organization of the United Nations, Rome, Italy, https://doi.org/10.1002/app5.83/full.
[200] FAO (2017), SAVE FOOD FOR A BETTER CLIMATE converting the Food loss and waste challenge into climate action, Food and Agriculture Organization, Rome, http://www.fao.org/3/a-i8000e.pdf (accessed on 28 February 2018).
[177] FAO (2015), Global Forest Resources Assessment 2015, Forest and Agriculture Organisation of the United Nations, Rome, http://www.fao.org/publications (accessed on 2 October 2018).
[195] FAO (2013), Food wastage footprint: Impacts on natural resources - Summary report, Food and Agriculture Organisation of the United Nations, Rome, http://www.fao.org/docrep/018/i3347e/i3347e.pdf.
[149] Farrelly, N. and G. Gallagher (2015), “The potential availability of land for afforestation in the Republic of Ireland”, Irish Forestry, Vol. 72, pp. 120-138.
[31] Fearnside, P. (2015), “Amazon dams and waterways: Brazil’s Tapajós Basin plans.”, Ambio, Vol. 44/5, pp. 426-39, https://doi.org/10.1007/s13280-015-0642-z.
[175] Fédération nationale du bois (2018), Crise: LÉxportation croissante de chene brut ruine la filière francaise de la transformation qui en appelle au président de la république, http://www.fnbois.com/wp-content/uploads/2018/03/DP_FNB_BoisFran%C3%A7aisEnDanger_draft9_050218.pdf (accessed on 11 February 2019).
[128] Feehan, J., D. Gillmor and N. Culleton (2005), “Effects of an agri-environment scheme on farmland biodiversity in Ireland”, Agriculture, Ecosystems & Environment, Vol. 107/2-3, pp. 275-286, https://doi.org/10.1016/J.AGEE.2004.10.024.
[116] Figueiredo, P. (2016), “New challenges for public research organisations in agricultural innovation in developing economies: Evidence from Embrapa in Brazil’s soybean industry”, The Quarterly Review of Economics and Finance, Vol. 62, pp. 21-32, https://doi.org/10.1016/J.QREF.2016.07.011.
[78] Finger, R. et al. (2017), “Revisiting Pesticide Taxation Schemes”, Ecological Economics, Vol. 134, pp. 263-266, https://doi.org/10.1016/J.ECOLECON.2016.12.001.
[165] Frank, S. et al. (2013), “How effective are the sustainability criteria accompanying the European Union 2020 biofuel targets?”, GCB Bioenergy, Vol. 5/3, pp. 306-314, https://doi.org/10.1111/j.1757-1707.2012.01188.x.
[85] Frank, S. et al. (2017), “Reducing greenhouse gas emissions in agriculture without compromising food security?”, Environmental Research Letters, Vol. 12/10, p. 105004, https://doi.org/10.1088/1748-9326/aa8c83.
[61] Freitas, F. et al. (2018), “Potential increase of legal deforestation in Brazilian Amazon after Forest Act revision”, Nature Sustainability, Vol. 1/11, pp. 665-670, https://doi.org/10.1038/s41893-018-0171-4.
[179] García-Montiel, E. et al. (2017), “An Analysis of Non-State and State Approaches for Forest Certification in Mexico”, https://doi.org/10.3390/f8080290.
[186] Gasparri, N. and Y. de Waroux (2015), “The Coupling of South American Soybean and Cattle Production Frontiers: New Challenges for Conservation Policy and Land Change Science”, Conservation Letters, Vol. 8/4, pp. 290-298, https://doi.org/10.1111/conl.12121.
[43] Gaveau, D. et al. (2012), “Examining protected area effectiveness in Sumatra: importance of regulations governing unprotected lands”, Conservation Letters, Vol. 5/2, pp. 142-148, https://doi.org/10.1111/j.1755-263X.2011.00220.x.
[7] Gaveau, D. et al. (2017), “Overlapping Land Claims Limit the Use of Satellites to Monitor No-Deforestation Commitments and No-Burning Compliance”, Conservation Letters, Vol. 10/2, pp. 257-264, https://doi.org/10.1111/conl.12256.
[42] Gaveau, D., H. Wandono and F. Setiabudi (2007), “Three decades of deforestation in southwest Sumatra: Have protected areas halted forest loss and logging, and promoted re-growth?”, Biological Conservation, Vol. 134/8, pp. 495-504, https://doi.org/10.1016/j.biocon.2006.08.035.
[150] Gawith, D. and I. Hodge (2018), “Moving beyond description to explore the empirics of adaptation constraints”, Ecological Indicators, Vol. 95, pp. 907-916, https://doi.org/10.1016/J.ECOLIND.2018.08.022.
[69] George, C. and S. Yamaguchi (2018), “Assessing Implementation of Environmental Provisions in Regional Trade Agreements”, OECD Trade and Environment Working Papers, No. 2018/01, OECD Publishing, Paris, https://dx.doi.org/10.1787/91aacfea-en.
[51] Gibbs, H. et al. (2015), “Brazil’s Soy Moratorium”, Science, Vol. 347/6220, pp. 377-378, https://doi.org/10.1126/science.aaa0181.
[208] González, A. (2017), Políticas públicas para la alimentación en México, https://fr.slideshare.net/FAOoftheUN/polticas-pblicas-para-la-alimentacin-en-mxico (accessed on 2 November 2018).
[205] Gore-Langton, L. (2017), France’s food waste ban: One year on, https://www.foodnavigator.com/Article/2017/03/24/France-s-food-waste-ban-One-year-on (accessed on 10 January 2019).
[64] Government of Indonesia and European Free Trade Association (2018), Comprehensive economic partnership agreement between the Republic of Indonesia and the EFTA states, https://www.efta.int/sites/default/files/documents/legal-texts/free-trade-relations/indonesia/efta-indonesia-main-agreement.pdf (accessed on 28 February 2019).
[34] Government of Ireland (2018), Project Ireland 2040, Government of Ireland.
[67] Governments of the United States; Mexico and Canada (2018), UMSCA: Chapter 24 - Environment, https://ustr.gov/sites/default/files/files/agreements/FTA/USMCA/Text/24_Environment.pdf (accessed on 15 February 2019).
[87] Grosjean, G. et al. (2018), “Options to overcome the barriers to pricing European agricultural emissions”, Climate Policy, Vol. 18/2, pp. 151-169, https://doi.org/10.1080/14693062.2016.1258630.
[181] Gruère, G. (2013), A Characterisation of Environmental Labelling and Information Schemes, OECD publishing, Paris, https://www.oecd-ilibrary.org/environment-and-sustainable-development/a-characterisation-of-environmental-labelling-and-information-schemes_5k3z11hpdgq2-en (accessed on 28 September 2018).
[101] Guedes, F. and S. Seehusen (2012), - Gestão - Série Biodiversidade 42 - Pagamentos por Serviços Ambientais na Mata Atlântica - Biodiversity Series 42 - Payments for Environmental Services in the Atlantic Forest, MMA - Ministério do Meio Ambiente, http://www.terrabrasilis.org.br/ecotecadigital/index.php/estantes/gestao/2109-serie-biodiversidade-42-pagamentos-por-servicos-ambientais-na-mata-atlantica (accessed on 28 August 2018).
[53] Hansen, M. et al. (2013), “High-resolution global maps of 21st-century forest cover change.”, Science (New York, N.Y.), Vol. 342/6160, pp. 850-3, https://doi.org/10.1126/science.1244693.
[194] Hansen, M., S. Stehman and P. Potapov (2010), “Quantification of global gross forest cover loss.”, Proceedings of the National Academy of Sciences of the United States of America, Vol. 107/19, pp. 8650-5, https://doi.org/10.1073/pnas.0912668107.
[16] Hansen, O. (2018), “Deforestation Caused by Illegal Avocado Farming: A Case Study on the Effectiveness of Mexico’ s Payment for Ecosystem Services Program”, University of Miami Inter-American Law Review, Vol. 89, https://repository.law.miami.edu/umialr/vol49/iss1/6 (accessed on 29 August 2018).
[76] Hardelin, J. and J. Lankoski (2018), “Land use and ecosystem services”, OECD Food, Agriculture and Fisheries Papers, No. 114, OECD Publishing, Paris, https://dx.doi.org/10.1787/c7ec938e-en.
[185] Haupt, F. et al. (2018), Progress on Corporate Commitments and their Implementation 2 2 Progress on Corporate Commitments and their Implementation, https://www.tfa2020.org/wp-content/uploads/2018/06/Progress-on-Corporate-Commitments-and-their-Implementation.pdf (accessed on 20 March 2019).
[112] Henderson, B. and J. Lankoski (2019), “Evaluating the environmental impact of agricultural policies”, OECD Food, Agriculture and Fisheries Papers, No. 130, OECD Publishing, Paris, https://dx.doi.org/10.1787/add0f27c-en.
[204] Henz, G. and G. Porpino (2017), “Food losses and waste: how Brazil is facing this global challenge?”, Horticultura Brasileira, https://doi.org/10.1590/s0102-053620170402.
[23] Herrera, D. et al. (2017), “Upstream watershed condition predicts rural children’s health across 35 developing countries”, Nature Communications, Vol. 8/1, p. 811, https://doi.org/10.1038/s41467-017-00775-2.
[170] Hia, A. and N. Kusumawardani (2016), “Indonesian Sustainable Palm Oil (ISPO), A Way to Reach The European Union Renewable Energy Directive (EU RED) 2009 and Boosting Indonesian Palm Oil Market to European Union (EU) 2009-2014”, AEGIS: Journal of International Relations, Vol. 1/1, http://e-journal.president.ac.id/presunivojs/index.php/AEGIS/article/view/83.
[141] INRA; IGN (2017), The Role of French Forests and the Forestry Sector in Climate-Change Mitigation: Summary of a study conducted by INRA and IGN for the Ministry of Agriculture and Food, INRA and IGN, https://inventaire-forestier.ign.fr/IMG/pdf/419860-c1d9a-resource-etude-forets-bois-changement-climatique-resume-anglais.pdf (accessed on 30 August 2018).
[158] Irawan, S., L. Tacconi and I. Ring (2013), “Stakeholders’ incentives for land-use change and REDD+: The case of Indonesia”, Ecological Economics, Vol. 87, pp. 75-83, https://doi.org/10.1016/j.ecolecon.2012.12.018.
[202] Jørgen, R. et al. (2016), Food losses and food waste Extent, underlying drivers and impact assessment of prevention approaches., http://ifro.ku.dk/publikationer/ifro_serier/rapporter/FindotherIFROCommissionedWork.
[117] Koch, N. et al. (2019), “Agricultural Productivity and Forest Conservation: Evidence from the Brazilian Amazon”, American Journal of Agricultural Economics, Vol. 101/3, pp. 919-940, https://doi.org/10.1093/ajae/aay110.
[197] Kummu, M. et al. (2012), “Lost food, wasted resources: Global food supply chain losses and their impacts on freshwater, cropland, and fertiliser use”, Science of The Total Environment, Vol. 438, pp. 477-489, https://doi.org/10.1016/J.SCITOTENV.2012.08.092.
[188] Lambin, E. et al. (2018), “The role of supply-chain initiatives in reducing deforestation”, Nature Climate Change, Vol. 8/2, pp. 109-116, https://doi.org/10.1038/s41558-017-0061-1.
[5] Lambin, E. and P. Meyfroidt (2011), “Global land use change, economic globalization, and the looming land scarcity.”, Proceedings of the National Academy of Sciences of the United States of America, Vol. 108/9, pp. 3465-72, https://doi.org/10.1073/pnas.1100480108.
[131] Lankoski, J. et al. (2015), “Environmental Co-benefits and Stacking in Environmental Markets”, OECD Food, Agriculture and Fisheries Papers, No. 72, OECD Publishing, Paris, https://dx.doi.org/10.1787/5js6g5khdvhj-en.
[187] le Polain de Waroux, Y. et al. (2016), “Land-use policies and corporate investments in agriculture in the Gran Chaco and Chiquitano”, Proceedings of the National Academy of Sciences, Vol. 113/15, pp. 4021-4026, https://doi.org/10.1073/pnas.1602646113.
[47] Le Tourneau, F. (2015), “The sustainability challenges of indigenous territories in Brazil’s Amazonia”, Current Opinion in Environmental Sustainability, Vol. 14, pp. 213-220, https://doi.org/10.1016/J.COSUST.2015.07.017.
[89] Leining, C. and S. Kerr (2016), “Lessons Learned from the New Zealand Emissions Trading Scheme”.
[17] Leverkus, A. et al. (2017), “Mexico’s logging threatens butterflies.”, Science (New York, N.Y.), Vol. 358/6366, p. 1008, https://doi.org/10.1126/science.aar3826.
[25] Ling, M. et al. (2018), A review of ecosystem service valuation progress and approaches by the Member States of the European Union, UNEP-WCMC, Cambridge, UK.
[137] MAA (2016), Le programme national de la forêt et du bois 2016 - 2026, Ministère de l’Agriculture et de l’Alimentation, https://agriculture.gouv.fr/le-programme-national-de-la-foret-et-du-bois-2016-2026 (accessed on 6 June 2019).
[4] Maestre Andrés, S. et al. (2012), “Ineffective biodiversity policy due to five rebound effects”, Ecosystem Services, https://doi.org/10.1016/j.ecoser.2012.07.003.
[191] Martha, G., E. Alves and E. Contini (2012), “Land-saving approaches and beef production growth in Brazil”, Agricultural Systems, Vol. 110, pp. 173-177, https://doi.org/10.1016/J.AGSY.2012.03.001.
[107] May, P. et al. (2016), The context of REDD+ in Brazil: drivers, agents, and institutions - 3rd edition, Center for International Forestry Research (CIFOR), https://doi.org/10.17528/cifor/006338.
[65] Mayrand, K., M. Paquin and S. Gagnon-Turcotte (2008), “Environmental Assessment of NAFTA: Lessons Learned from CEC’s Trade and Environment Symposia”, Background Paper for the Experts Roundtable JPAC Public Session, Phoenix, Arizona, April 2008, http://www.cec.org (accessed on 12 June 2019).
[178] McDermott, C., L. Irland and P. Pacheco (2015), “Forest certification and legality initiatives in the Brazilian Amazon: Lessons for effective and equitable forest governance”, Forest Policy and Economics, Vol. 50, pp. 134-142, https://doi.org/10.1016/J.FORPOL.2014.05.011.
[113] Mcfarland, W., S. Whitley and G. Kissinger (2015), Subsidies to key commodities driving forest loss Implications for private climate finance, Overseas Development Institute, London, http://www.odi.org.
[129] McMahon, B. et al. (2010), “Interactions between livestock systems and biodiversity in South-East Ireland”, Agriculture, Ecosystems & Environment, Vol. 139/1-2, pp. 232-238, https://doi.org/10.1016/J.AGEE.2010.08.008.
[168] Mekhilef, S., S. Siga and R. Saidur (2011), “A review on palm oil biodiesel as a source of renewable fuel”, Renewable and Sustainable Energy Reviews, Vol. 15/4, pp. 1937-1949, https://doi.org/10.1016/J.RSER.2010.12.012.
[132] Mello, F. (2015), ABC- National Plan for Low Carbon Emissions in Agriculture - Brazilian Experience, presentation to the OECD, https://csa.guide/csa/brazil-s-low-carbon-agriculture-abc-plan (accessed on 29 August 2018).
[27] Metternicht, G. (2017), GLOBAL LAND OUTLOOK WORKING PAPER: LAND USE PLANNING, United Nations Convention to Combat Desertification, https://static1.squarespace.com/static/5694c48bd82d5e9597570999/t/593a42d7197aea88458703df/1496990441721/Land+Use+Planning+__G_Metternicht.pdf (accessed on 31 August 2018).
[142] MfE (2013), New Zealand’s Sixth National Communication under the United Nations Framework Convention on Climate Change and Kyoto Protocol.
[49] Miettinen, J. et al. (2017), “From carbon sink to carbon source: extensive peat oxidation in insular Southeast Asia since 1990”, Environmental Research Letters, Vol. 12/2, p. 024014, https://doi.org/10.1088/1748-9326/aa5b6f.
[164] Ministère de la transition écologique et solidaire (2018), Strategie nationale de lutte contre la deforestation importee 2018-2030, Government of France, Paris, https://www.ecologique-solidaire.gouv.fr/sites/default/files/2018.11.14_SNDI_0.pdf (accessed on 4 February 2019).
[134] Ministério da Agricultura, Pecuária e abastecimento (2018), Adoção e mitigação de Gases de Efeitos Estufa pelas tecnologias do Plano Setorial de Mitigação e Adaptação às Mudanças Climáticas (Plano ABC), Government of Brazil, Brasilia, http://www.agricultura.gov.br/assuntos/sustentabilidade/plano-abc/plano-abc-em-numeros/arquivos/ResumodaadooemitigaodegasesdeefeitosestufapelastecnologiasdoPlanoABCPerodo2010a2018nov.pdf (accessed on 3 June 2019).
[214] Ministry for the Environment (2010), The New Zealand Waste Strategy: Reducing harm, improving efficiency | Ministry for the Environment, http://www.mfe.govt.nz/publications/waste/new-zealand-waste-strategy-reducing-harm-improving-efficiency (accessed on 24 October 2018).
[171] Ministry of Agriculture (2011), Pedoman Perkebunan Kelapa Sawit Berkelanjutan Indonesia (Indonesian Sustainable Palm Oil/ ISPO), Government of Indonesia, Jakarta, http://perundangan.pertanian.go.id/admin/file/Permentan%2011-2015%20ISPO.pdf.
[211] Ministry of Agriculture and the Technology Assessment and Application Agency (n.d.), Biomass Town Plan: Palembang City, Indonesia, http://www.scielo.org.co/pdf/esju/v17n1/v17n1a01.pdf.
[172] Ministry of Agriculture; Fisheries and Food Supply (2017), Intercâmbio comercial do agronegócio principais mercados de destino, Government of Brazil, Brasilia, http://www.agricultura.gov.br/assuntos/relacoes-internacionais/documentos/intercambio-comercial-do-agronegocio-10a-edicao/IntercambioComercial2017_web.pdf/view.
[144] Ministry of Environment and Forestry (2018), The State of Indonesia’s Forests 2018, The Ministry of Environment and Forestry, Republic of Indonesia.
[70] Ministry of Finance (2018), Amendment to the regulation of the Minister of Finance number 81 / PMK.05 / 2018 concerning the tariff service agency’s general service to the palm plantation funding management agency at the Ministry of Finance, http://www.bpdp.or.id/wp-content/uploads/2018/12/PMK-15-2018-Pungutan-Ekspor-Sawit.pdf.
[63] Monteiro, J. (2016), “Typology of Environment-related Provisions in Regional Trade Agreements”, WTO Working Paper, No. ERSD-2016-13, World Trade Organization, Geneva, Switzerland, https://www.wto.org/english/res_e/reser_e/ersd201613_e.pdf (accessed on 11 June 2019).
[169] Moreno-Peñaranda, R. et al. (2018), “Stakeholder Perceptions of the Ecosystem Services and Human Well-Being Impacts of Palm Oil Biofuels in Indonesia and Malaysia”, Springer, Tokyo, https://doi.org/10.1007/978-4-431-54895-9_10.
[136] MPI (2018), Planting one billion trees | MPI - Ministry for Primary Industries. A New Zealand Government Department., https://www.mpi.govt.nz/funding-and-programmes/forestry/planting-one-billion-trees/ (accessed on 9 November 2018).
[83] Muller, C. and M. Neal (2018), “The impact of nutrient regulations on dairy farm land values in Southland”, New Zealand Journal of Agricultural Research, pp. 1-19, https://doi.org/10.1080/00288233.2018.1509876.
[52] Nepstad, D. et al. (2014), “Slowing Amazon deforestation through public policy and interventions in beef and soy supply chains.”, Science (New York, N.Y.), Vol. 344/6188, pp. 1118-23, https://doi.org/10.1126/science.1248525.
[1] Newell, R. and W. Pizer (2003), “Regulating stock externalities under uncertainty”, Journal of Environmental Economics and Management, Vol. 45/2, pp. 416-432, https://doi.org/10.1016/S0095-0696(02)00016-5.
[133] Newton, P. et al. (2016), “Overcoming barriers to low carbon agriculture and forest restoration in Brazil: The Rural Sustentável project”, https://doi.org/10.1016/j.wdp.2016.11.011.
[40] Nolte, C. et al. (2013), “Governance regime and location influence avoided deforestation success of protected areas in the Brazilian Amazon”, Proceedings of the National Academy of Sciences of the United States of America, Vol. 110/13, pp. 4956-4961, https://doi.org/10.1073/pnas.1214786110.
[73] Nugraha, I. (2015), Faulty impact assessments plague Indonesian mines: Komnas HAM, Mongabay, https://news.mongabay.com/2015/04/faulty-impact-assessments-plague-indonesian-mines-komnas-ham/ (accessed on 26 July 2018).
[146] Nurfatriani, F. et al. (2015), “Redesigning Indonesian forest fiscal policy to support forest conservation”, Forest Policy and Economics, https://doi.org/10.1016/j.forpol.2015.07.006.
[148] NZIER (2017), Plantation Forestry Statistics: Contribution of forestry to New Zealand, New Zealand Institute of Economic Research, https://nzier.org.nz/static/media/filer_public/c6/a5/c6a55bbf-8f36-484e-82a0-91bb59211880/plantation_forestry_statistics.pdf.
[9] Observatory of Public Sector Innovation (OECD-OSPI) (2013), The Indonesian Timber Legality Assurance System (SVLK) - Observatory of Public Sector Innovation Observatory of Public Sector Innovation, https://oecd-opsi.org/innovations/the-indonesian-timber-legality-assurance-system-svlk/ (accessed on 6 March 2019).
[120] OECD (2019), Agricultural Policy Monitoring and Evaluation 2019, OECD Publishing, Paris, https://dx.doi.org/10.1787/39bfe6f3-en.
[110] OECD (2019), Agricultural support (indicator), https://doi.org/10.1787/6ea85c58-en (accessed on 22 August 2019).
[39] OECD (2019), “Biodiverisity: Protected areas”, OECD Environment Statistics (database), https://doi.org/10.1787/5fa661ce-en (accessed on 15 May 2019).
[22] OECD (2019), Biodiversity: Finance and the Economic and Business Case for Action, http://www.oecd.org/environment/resources/biodiversity/G7-report-Biodiversity-Finance-and-the-Economic-and-Business-Case-for-Action.pdf (accessed on 22 May 2019).
[12] OECD (2019), Green Growth Policy Review of Indonesia, Organisaiton for Economic Co-operation and Development.
[114] OECD (2018), Agricultural Policy Monitoring and Evaluation 2018, OECD Publishing, Paris, https://doi.org/10.1787/agr_pol-2018-en.
[124] OECD (2018), Deepening the Sustainable Productivity Framework, Organisation for Economic Co-operation and Development, Paris, France.
[152] OECD (2018), OECD Companion to the Inventory of Support Measures for Fossil Fuels 2018 - en - OECD, OECD publishing, https://www.oecd.org/tax/oecd-companion-to-the-inventory-of-support-measures-for-fossil-fuels-2018-9789264286061-en.htm (accessed on 29 August 2018).
[161] OECD (2018), Open Government Data in Mexico: The Way Forward, OECD Digital Government Studies, OECD Publishing, Paris, https://dx.doi.org/10.1787/9789264297944-en.
[33] OECD (2018), Rethinking Urban Sprawl: Moving Towards Sustainable Cities, OECD Publishing, Paris, https://doi.org/10.1787/9789264189881-en.
[122] OECD (2017), Agricultural Policy Monitoring and Evaluation 2017, OECD Publishing, Paris, https://dx.doi.org/10.1787/agr_pol-2017-en.
[82] OECD (2017), Environmental Performance Reviews Mid-term progress report: Mexico, https://one.oecd.org/document/ENV/EPOC/WPEP(2018)5/en/pdf (accessed on 13 March 2018).
[88] OECD (2017), OECD Environmental Performance Reviews: New Zealand 2017, OECD Environmental Performance Reviews, OECD Publishing, Paris, https://doi.org/10.1787/9789264268203-en.
[81] OECD (2017), The Political Economy of Biodiversity Policy Reform, OECD Publishing, Paris, https://doi.org/10.1787/9789264269545-en.
[94] OECD (2016), Biodiversity Offsets: Effective Design and Implementation, OECD Publishing, Paris, https://doi.org/10.1787/9789264222519-en.
[84] OECD (2016), Effective Carbon Rates: Pricing CO2 through Taxes and Emissions Trading Systems, OECD Publishing, Paris, https://doi.org/10.1787/9789264260115-en.
[95] OECD (2016), “Mexican Environmental Compensation Scheme for Land-Use Change in Forested Areas”, in Biodiversity Offsets: Effective Design and Implementation, OECD Publishing, Paris, https://doi.org/10.1787/9789264222519-10-en.
[37] OECD (2016), OECD Environmental Performance Reviews: France 2016, OECD Environmental Performance Reviews, OECD Publishing, Paris, https://doi.org/10.1787/9789264252714-en.
[111] OECD (2016), The PSE Manual, OECD Publishing, Paris, http://www.oecd.org/agriculture/topics/agricultural-policy-monitoring-and-evaluation/documents/producer-support-estimates-manual.pdf.
[192] OECD (2015), Fostering Green Growth in Agriculture: The Role of Training, Advisory Services and Extension Initiatives, OECD Green Growth Studies, OECD Publishing, Paris, https://dx.doi.org/10.1787/9789264232198-en.
[13] OECD (2015), OECD Environmental Performance Reviews: Brazil 2015, OECD Environmental Performance Reviews, OECD Publishing, Paris, https://doi.org/10.1787/9789264240094-en.
[99] OECD (2013), OECD Environmental Performance Reviews: Mexico 2013, OECD Environmental Performance Reviews, OECD Publishing, Paris, https://doi.org/10.1787/9789264180109-en.
[20] OECD (2013), Scaling up finance mechanisms for biodiversity, OECD Publishing, Paris, http://www.oecd.org/env/resources/OECD%20Finance%20for%20Biodiversity%20%5Bf%5D%20%5Blr%5D%20WEB%20SM.pdf.
[21] OECD (2011), Food and Agriculture, OECD Green Growth Studies, OECD Publishing, Paris, https://doi.org/10.1787/9789264107250-en.
[213] OECD (2006), “Decoupling: A Conceptual Overview”, OECD Papers, Vol. 5/11, https://dx.doi.org/10.1787/oecd_papers-v5-art37-en.
[121] OECD (2020, forthcoming), Economic and Environmental Sustainability Performance of Environmental Policies in Agriculture: A Literature Review, Organisation of Economic Co-operation and Development.
[199] OECD (n.d.), Options for climate change mitigation in the agricultural sector: A partial equilibrium analysis, Organisation for Economic Co-operation and Development, Paris.
[190] OECD/FAO (2018), OECD-FAO Pilot project on the implementation of the OECD-FAO Guidance for Responsible Agricultural Supply Chains : Baseline Report, http://www.oecd.org/about/publishing/corrigenda.htm. (accessed on 20 March 2019).
[189] OECD/FAO (2016), OECD-FAO Guidance for Responsible Agricultural Supply Chains, OECD Publishing, Paris, https://dx.doi.org/10.1787/9789264251052-en.
[62] Ortiz Tapia, E. (2018), The black hole in Mexico’s Forestry Law - Investigación | Ojo Público, OjoPúblico.com, https://ojo-publico.com/902/black-hole-mexicos-forestry-law (accessed on 7 March 2019).
[176] PEFC (2010), PEFC International Standard: Requirements for certification schemes, PEFC Council, Geneva, https://www.scribd.com/document/44967214/Sustainable-Forest-Management-PEFC-ST-1003-2010#download&from_embed (accessed on 18 September 2018).
[41] Pfaff, A., F. Santiago-Ávila and L. Joppa (2016), “Evolving Protected-Area Impacts in Mexico: Political Shifts as Suggested by Impact Evaluations”, Forests, Vol. 8/1, p. 17, https://doi.org/10.3390/f8010017.
[212] Priefer, C., J. Jörissen and K. Bräutigam (2016), “Food waste prevention in Europe – A cause-driven approach to identify the most relevant leverage points for action”, Resources, Conservation and Recycling, Vol. 109, pp. 155-165, https://doi.org/10.1016/J.RESCONREC.2016.03.004.
[38] QEII National Trust (2018), FAQs: About Covenanting, http://www.openspace.org.nz/Site/About_covenanting/FAQs.aspx.
[98] Quétier, F., B. Regnery and H. Levrel (2014), “No net loss of biodiversity or paper offsets? A critical review of the French no net loss policy”, Environmental Science and Policy, Vol. 38, pp. 120-131, https://doi.org/10.1016/j.envsci.2013.11.009.
[100] Ramirez-Reyes, C. et al. (2018), “Payments for ecosystem services in Mexico reduce forest fragmentation”, Ecological Applications, https://doi.org/10.1002/eap.1753.
[138] Republic of Indonesia (2016), “First Nationally Determined Contribution”, http://www4.unfccc.int/ndcregistry/PublishedDocuments/Indonesia%20First/First%20NDC%20Indonesia_submitted%20to%20UNFCCC%20Set_November%20%202016.pdf (accessed on 12 June 2018).
[6] Robinson, B., M. Holland and L. Naughton-Treves (2013), “Does secure land tenure save forests? A meta-analysis of the relationship between land tenure and tropical deforestation”, Global Environmental Change, https://doi.org/10.1016/j.gloenvcha.2013.05.012.
[15] Rochedo, P. et al. (2018), “The threat of political bargaining to climate mitigation in Brazil”, Nature Climate Change, p. 1, https://doi.org/10.1038/s41558-018-0213-y.
[8] Sahide, M. and L. Giessen (2015), “The fragmented land use administration in Indonesia - Analysing bureaucratic responsibilities influencing tropical rainforest transformation systems”, Land Use Policy, https://doi.org/10.1016/j.landusepol.2014.11.005.
[115] Sainteny, G. et al. (2011), Les aides publiques dommageables à la biodiversité, Centre d’analyse stratégique, http://archives.gouvernement.fr/fillon_version2/sites/default/files/fichiers_joints/Aides_dommageables_a_la_biodiversite_Rapport_CAS_Octobre2011.pdf (accessed on 3 June 2019).
[157] Santika, T. et al. (2017), “Community forest management in Indonesia: Avoided deforestation in the context of anthropogenic and climate complexities”, Global Environmental Change, Vol. 46/August, pp. 60-71, https://doi.org/10.1016/j.gloenvcha.2017.08.002.
[183] Schleifer, P. and Y. Sun (2018), “Emerging markets and private governance: the political economy of sustainable palm oil in China and India”, Review of International Political Economy, pp. 1-25, https://doi.org/10.1080/09692290.2017.1418759.
[44] SEEG (2018), Emissions By Sector - Mudança de Uso da Terra e Floresta|, http://plataforma.seeg.eco.br/sectors/mudanca-de-uso-da-terra-e-floresta (accessed on 12 November 2018).
[30] Shahab, N. (2016), Indonesia: One Map Policy, Open Government Partnership, https://www.opengovpartnership.org/sites/default/files/case-study_Indonesia_One-Map-Policy.pdf (accessed on 26 March 2018).
[109] Simonet, G. et al. (2018), “Effectiveness of a REDD+ Project in Reducing Deforestation in the Brazilian Amazon*”, American Journal of Agricultural Economics, https://doi.org/10.1093/ajae/aay028.
[45] Soares-Filho, B. et al. (2010), “Role of Brazilian Amazon protected areas in climate change mitigation.”, Proceedings of the National Academy of Sciences of the United States of America, Vol. 107/24, pp. 10821-6, https://doi.org/10.1073/pnas.0913048107.
[97] Souza, B. and L. Sánchez (2018), “Biodiversity offsets in limestone quarries: Investigation of practices in Brazil”, Resources Policy, Vol. 57, pp. 213-223, https://doi.org/10.1016/J.RESOURPOL.2018.03.007.
[92] State Governments of Acre, Chiapas, A. (2010), Memorandum of Understanding on Environmental Cooperation Between the State of Acre of the Federative Republic of Brazil, the State of Chiapas of the United Mexican States, and the State of California of the United States of America, Authors, https://www.arb.ca.gov/cc/capandtrade/sectorbasedoffsets/2010%20MOU%20Acre-California-Chiapas.pdf (accessed on 13 June 2019).
[55] Strassburg, B. et al. (2017), “Moment of truth for the Cerrado hotspot”, Nature Ecology & Evolution, Vol. 1/4, p. 0099, https://doi.org/10.1038/s41559-017-0099.
[104] Suich, H. et al. (2017), “Payments for ecosystem services in Indonesia”, Oryx, Vol. 51/3, pp. 489-497, https://doi.org/10.1017/s0030605316000259.
[77] Sutton, M. et al. (2011), The European nitrogen assessment : sources, effects, and policy perspectives, Cambridge University Press, Cambridge (UK), https://inis.iaea.org/search/search.aspx?orig_q=RN:42079361 (accessed on 28 August 2018).
[143] Te Uru Rākau (2018), One Billion Trees Fund: Report on Policy and Design Recommendations, Forestry New Zealand, https://www.mpi.govt.nz/dmsdocument/32908-3-appendix1-report-on-policy-and-design-recommendations-oia (accessed on 17 May 2019).
[209] The Ministry of Agriculture (2015), Rencana Strategis Kementerian Pertanian Tahun 2015-2019, The Ministry of Agriculture, Jakarta, Indonesia.
[105] The Republic of Indonesia (2017), Third National Communication Under the United Nations Framework Convention on Climate Change, UNFCCC.
[59] The Tax Working Group (2019), Future of Tax: Final Report Volume I - Recommendations, https://taxworkinggroup.govt.nz/resources/future-tax-final-report-vol-i-html (accessed on 22 May 2019).
[196] Tilman, D. et al. (2017), “Future threats to biodiversity and pathways to their prevention”, Nature, Vol. 546/7656, pp. 73-81, https://doi.org/10.1038/nature22900.
[154] Tilman, D. et al. (2009), “Beneficial Biofuels—The Food, Energy, and Environment Trilemma”, Science, Vol. 325/5938, pp. 4-5, https://doi.org/10.1126/science.1177970.
[201] Tonini, D., K. Brogaard and T. Astrup (2017), Food waste prevention in Denmark Identification of hotspots and potentials with Life Cycle Assessment.
[19] Urrunaga, J., A. Johnson and I. Orbegozo Sánchez (2018), Moment of Truth: promise or peril for the Amazon as Peru confronts its illegal timber trade, Environmental Investigation Agency, Washington, D.C., http://www.eia-global.org/momentoftruth (accessed on 7 March 2019).
[153] USDA (2017), Brazil Biofuels Annual, United States Department of Agriculture, https://gain.fas.usda.gov/Recent%20GAIN%20Publications/Biofuels%20Annual_Sao%20Paulo%20ATO_Brazil_9-15-2017.pdf (accessed on 29 August 2018).
[74] Van Der Sluys, C. (2018), The Evolution of Strategic Environmental Assessment in Indonesia, Environmental Support Programme - Indonesia, Jakarta, Indonesia, http://www.esp3.org/images/Library/PapersReports/SEA-Review-Eng.pdf (accessed on 26 July 2018).
[180] Verdone, M. (2018), The world’s largest private sector? Recognising the cumulative economic value of small-scale forest and farm producers, IUCN, International Union for Conservation of Nature, https://doi.org/10.2305/IUCN.CH.2018.13.en.
[36] Visser, M. et al. (2007), “The Irish agri-environment: How turlough users and non-users view converging EU agendas of Natura 2000 and CAP”, Land Use Policy, Vol. 24/2, pp. 362-373, https://doi.org/10.1016/J.LANDUSEPOL.2006.04.004.
[26] WAVES (2017), Indonesia Country Report 2017, Wealth Accounting and Valuation of Ecosystem Services, http://www.wavespartnership.org (accessed on 22 October 2018).
[198] Willett, W. et al. (2019), “Food in the Anthropocene: the EAT-Lancet Commission on healthy diets from sustainable food systems.”, Lancet (London, England), Vol. 0/0, https://doi.org/10.1016/S0140-6736(18)31788-4.
[24] Wolff, N. et al. (2018), “Impacts of tropical deforestation on local temperature and human well-being perceptions”, Global Environmental Change, Vol. 52, pp. 181-189, https://doi.org/10.1016/J.GLOENVCHA.2018.07.004.
[35] Woodworth, P. (2018), The farmer and the ecologist should be friends, Irish Times, https://www.irishtimes.com/opinion/the-farmer-and-the-ecologist-should-be-friends-1.2143105 (accessed on 25 July 2018).
[60] Wright, T., A. Rahmanulloh and A. Abdi (2017), Indonesia Biofuels Annual Report 2017 Biofuels Annual Indonesia, USDA, Foreign Agricultural Service, https://gain.fas.usda.gov/Recent%20GAIN%20Publications/Biofuels%20Annual_Jakarta_Indonesia_6-20-2017.pdf (accessed on 18 June 2018).
Notes
← 1. i) Forests ecosystems; ii) Marine and coastal environments; iii) Urban ecosystems; iv) Rocky and high mountain ecosystems; v) Agricultural ecosystems; vi) Continental wetlands
← 2. Law No. 32/2009 on Environmental Protection and Management
← 3. As defined by the IUCN: A protected area is a clearly defined geographical space, recognised, dedicated and managed, through legal or other effective means, to achieve the long term conservation of nature with associated ecosystem services and cultural values. (https://www.iucn.org/theme/protected-areas/about)
← 4. Author calculations based on supplementary data from Collins and Mitchard (2017[46]).
← 5. Most recently extended through presidential regulation 6/2017.
← 6. Government regulation 57/2016 bans the clearance of peatlands for up to 2 years if the government has not yet completed a zoning process. The zoning process essential separates peat areas into 2 zones depending on criteria laid out in the regulation.
← 7. Unless the land is officially designated as protection forest (Hutan Lindung).
← 8. Law 39/2014.
← 9. An example of a multilateral agreement limiting illegal trade in other products of relevance to at least some dimensions the land-use nexus (in particular biodiversity) is the Convention on International Trade in Endangered Species of Wild Fauna and Flora (CITES), which encourages measures to curb both supply and demand of illegally traded animal and plant species.
← 10. Regulation (EU) No 995/2010 of the European Parliament and of the Council of 20 October 2010
← 11. Ley General de Desarrollo Forestal Sustenable, 05/06/2018
← 12. (1) Restructuring of rural land holdings (2) commencing to use uncultivated land or semi-natural areas for intensive agriculture and (3) land drainage works on lands used for agriculture (excluding drainage or reclamation of wetlands).
← 13. These sectors are: (i) Agriculture; (ii) Forestry; (iii) Fisheries; (iv) Energy; (v) Industry; (vi) Transport; (vii) Waste management; (viii) Water management; (ix) Telecommunications (x); Tourism, Town; and (xi) Country Planning or Land use.
← 14. Government Regulation of the Republic of Indonesia No.46 Year 2016 on Procedures for Implementation of Strategic Environmental Assessment (Peraturan Pemerintah Republik Indonesia No.46 Tahun 2016 Tentang tata Cara Penyylenggaraan Kajian Lingkungan Hidup Strategis).
← 15. Only approximate number based on OECD PSE database for Brazil, Indonesia, Mexico and New Zealand and figures for CAP spending from the EC in France and Ireland.
← 16. https://www.waikatoregion.govt.nz/council/policy-and-plans/plans-under-development/healthy-rivers-plan-for-change/infosheets/nitrogen-reference-points/
← 17. For more details see OECD (2016[94]) Biodiversity Offsets: Effective Design and Implementation.
← 18. Certain types of development are required by law to purchase offsets for unavoidable environmental damage in some countries (see table 5.2).
← 19. The European Innovation Partnership for Agriculture Productivity and Sustainability, for example, supports a broad range of projects in Ireland. These projects include some conceptually similar to PES, such as the Inishowen Upland Farmers Project, amongst other non-PES projects. For more information see https://www.nationalruralnetwork.ie/eip-agri/.
← 20. Often referred to as a conditional cash transfer programme.
← 21. For a policy measure to be deemed decoupled, that production (or trade) not differ from the level that would have occurred in the absence of the measure. For more detailed explanation see (OECD, 2006[213]).
← 22. Often referred to as an agri-environment-climate scheme.
← 23. Performance-based means the scheme is targeted at reducing agricultural pressure on the environment. Results-based means the schemes are targeting a specific environmental outcome or outcomes.
← 24. Since 2015, weakening environmental governance, budget cuts and political instability have led to an increase in deforestation in the Brazilian Amazon.
← 25. Intergovernmental fiscal transfers consist in the transfer of resources between different governments in the same country, e.g. from one state or regional government to another.
← 26. These include inter alia the requirement that biomass used for biofuel production must not originate from primary forest, protected areas or highly biodiverse grasslands. Wetlands, peatlands and other land with high carbon stock, however, can be used for biomass production under certain circumstances.
← 27. Directive (EU) 2018/2001
← 28. OECD (2019[12]), for instance states that on current trends, growing demand for Indonesian palm oil for biofuel production would be met by expansion of harvested area. While the Indonesian government is planning to increase the productivity of already harvested areas, both of these options likely imply adverse impacts on at least some dimensions of the nexus.
← 29. The PEFC endorsed standards as of 2018 are: Brazil Forest Certification programme (CERFLOR), PEFC France, Indonesia Forestry Certification Cooperation (IFCC), PEFC Ireland and New Zealand Forest Certification Association Inc. (NZFCA).
← 30. Law 39/2014
← 31. Commodities covered by these commitments are those accounting for the majority of land-use nexus impacts associated with international trade in the case study countries, namely palm, soy, timber and pulp, and cattle.
← 32. https://www.origingreen.ie
← 33. Full list of countries’ spending on agricultural knowledge and innovation systems as a percentage of total support estimate in 2015 is as follows: Brazil 25.4% (USD 1.8 billion); European Union (disaggregated figures for France and Ireland not available) 5.77% (USD 6.2 billion); Indonesia 0.5% (USD 209 million); Mexico 5.19% (USD 394 million); New Zealand 36.5% (USD 182.8 million).
← 34. The geographic distribution of land needed by 2060 and land used for wasted food is different, so they are not directly replaceable.
← 35. Land occupation refers to land utilised in the production of these products and in the case of livestock also includes land utilised to produce feed.
← 36. Agricultural production, postharvest handling and storage, processing, distribution, consumption, end of life.
← 37. SDG 2: Zero hunger.
← 38. New Zealand for example lacks national level policy measures to address food waste, and there is no mention of food waste or specific strategies to reduce organic waste in New Zealand’s Waste Strategy (Ministry for the Environment, 2010[214]).
← 39. This directive requests the Commission to adopt legislation on food waste measurement by end-March 2019.
Metadata, Legal and Rights
https://doi.org/10.1787/3809b6a1-en
© OECD 2020
The use of this work, whether digital or print, is governed by the Terms and Conditions to be found at http://www.oecd.org/termsandconditions.