copy the linklink copied! 3. The methodology of the Survey of Adult Skills (PIAAC) and the quality of data

This chapter focuses on how the Survey of Adult Skills (PIAAC) was designed, managed and conducted. It discusses the target population, exclusions from the survey, sample size, response rates, and how the survey was scored.
A note regarding Israel
The statistical data for Israel are supplied by and under the responsibility of the relevant Israeli authorities. The use of such data by the OECD is without prejudice to the status of the Golan Heights, East Jerusalem and Israeli settlements in the West Bank under the terms of international law.
The 1st cycle of the Survey of Adult Skills involved three rounds of data collection: the first involving 24 countries/economies, the second nine and the third six. The first round of the study extended from January 2008 to October 2013. The second extended from January 2012 until June 2016 and the third extended from September 2014 until November 2019. Table 3.1 presents the dates of key phases of the three rounds as well as listing the participating countries/economies.
In addition to participating in Rounds 1 and 3 of PIAAC the United States also conducted a supplementary data collection in 2014. Box 3.2 gives an overview of the PIAAC data collections that have been undertaken by the United States and also provides information about the arrangements under which these data collections were carried out.
All three rounds of PIAAC were guided by the same set of technical standards and guidelines (PIAAC, 2014) developed to ensure that the survey yielded high-quality and internationally comparable data. The PIAAC Technical Standards and Guidelines articulates the standards to which participating countries/economies were expected to adhere in implementing the assessment, describes the steps that should be followed in order to meet the standards, and offers recommendations for actions relating to the standards that were not mandatory but that could help to produce high quality data. Standards were established for 16 discrete aspects of the design and implementation of the survey (Table 3.2). It should be noted that the Round 3 data collection in the United States deviated to some degree from the requirements of the PIAAC Technical Standards and Guidelines. Details are provided in Box 3.2.
The PIAAC Technical Standards and Guidelines is one element of a comprehensive process of quality assurance and control that was put in place to reduce potential sources of error and maximise the quality of the data produced by the Survey of Adult Skills. Participating countries/economies received assistance in meeting the standards in a variety of ways. Where relevant, manuals, training materials, testing plans and toolkits were produced. Training was provided to countries at appropriate stages of the project. In certain areas, such as sampling, translation and adaptation, and the operation of the computer-delivery platform, passage through the various stages of implementation was subject to a review of the steps completed, and sign-off was often required as a condition of moving to a subsequent stage. Regular consultations were held with countries at project meetings and through bilateral contact. Compliance with the technical standards was monitored throughout the development and implementation phases through direct contact, evidence that required activities were completed, and the ongoing collection of data from countries concerning key aspects of implementation.
The quality of each participating country’s data was reviewed prior to publication. The review was based on the analysis of the psychometric characteristics of the data and evidence of compliance with the technical standards. An assessment of the quality of each country’s data was prepared and recommendations were made regarding release and, if necessary, restrictions and/or qualifications that should apply to the release and publication. The approach to the review of data was validated by the project’s Technical Advisory team; the project’s steering body, the PIAAC Board of Participating Countries (BPC), made the final decision on release.
The development and implementation of the Survey of Adult Skills (PIAAC) was overseen by the PIAAC Board of Participating Countries (BPC). The Board consisted of representatives from each of the countries participating in the survey, with the exception of Cyprus1, Ecuador, Kazakhstan and the Russian Federation. The Board was responsible for making major decisions regarding budgets, the development and implementation of the survey, reporting of results, and for monitoring the progress of the project. The Board was supported in its work by the OECD Secretariat, which was responsible for providing advice to the Board and managing the project on behalf of the Board.
An international Consortium was contracted by the OECD to undertake a range of tasks relating to the design and development of the assessment, implementation and analysis. The Consortium was responsible for developing questionnaires, instrumentts, and the computer-delivery platform, supporting survey operations, quality control, scaling, and database preparation.
Participating countries/economies were responsible for the national implementation of the assessment. This covered sampling, adaptation and translation of assessment materials, data collection and database production. In each country, national project teams were led by national project managers.
This chapter focuses on aspects of the design and the methodology of the Survey of Adult Skills that are essential for interpreting the results of the data-quality review. To this end, it describes:
-
the design of the assessment and administration of the survey
-
sampling
-
translation and adaptation of instruments
-
survey administration
-
survey response
-
scoring
-
the outcomes of the adjudication of data quality.
copy the linklink copied! Assessment design
The Survey of Adult Skills involved the direct assessment of literacy, numeracy and problem solving in technology-rich environments. While conceived primarily as a computer-based assessment (CBA), the option of taking the literacy and numeracy components of the assessment in paper-based format (PBA) had to be provided for those adults who had insufficient experience with computers to take the assessment in CBA mode. This necessitated a relatively complex design, which is presented graphically in Figure 3.1.
In Jakarta (Indonesia), the assessment was delivered in paper-based format only due to the low rate of familiarity with computers among the target population. This was a version of the paper-based assessment used in other countries that included additional items.
Pathways through the cognitive assessments in the Survey of Adult Skills (PIAAC): Computer-based assessment
As can be seen, there are several pathways through the computer-based assessment. Respondents with no experience in using computers, as indicated by their response to the relevant questions in the background questionnaire, were directed to the paper-based version of the assessment. Respondents with some experience of computer use were directed to the computer-based assessment where they took a short test of their ability to use the basic features of the test application (use of a mouse, typing, use of highlighting, and drag and drop functionality) – the CBA core Stage 1. Those who “failed” this component were directed to the paper pathway.
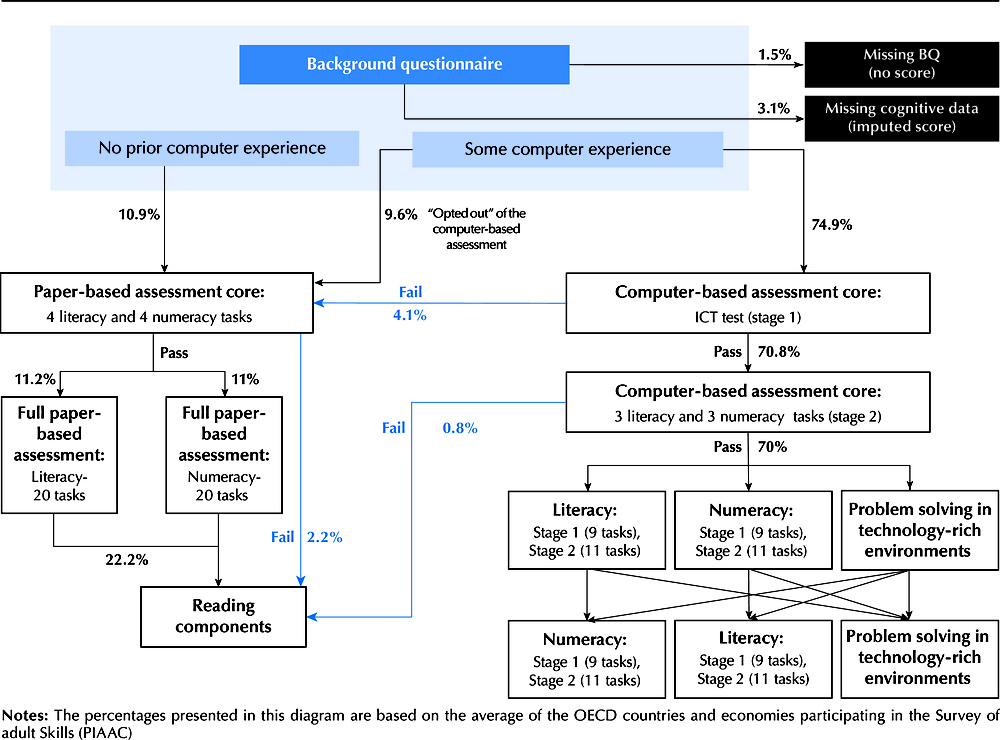
Notes: The percentages presented in this diagram are based on the average of the OECD countries and economies participating in the Survey of adult Skills (PIAAC)
Respondents taking the computer path then took a short test (the CBA core Stage 2) composed of three literacy and three numeracy items of low difficulty to determine whether or not they should continue with the full assessment. Those who “failed” this module were directed to the reading components assessment. Respondents who passed this module continued on to take the full test and were randomly assigned to a first module of literacy, numeracy or problem-solving items. Following completion of the first module, respondents who had completed a literacy module were randomly assigned to a numeracy or problem-solving module, respondents who had completed a numeracy module were randomly assigned to a literacy or problem-solving module, and respondents who had completed a problem-solving module were randomly assigned to a literacy, a numeracy or a second problem-solving module.
The assessment design assumed that the respondents taking the PBA path would be either those who had no prior experience with computers (as assessed on the basis of responses to the relevant questions in the background questionnaire) or those who failed the ICT core. It was, however, possible for respondents with some computer experience to take the PBA pathway if they insisted. Respondents with some computer experience who opted to take the paper-based pathway without attempting the CBA core represented 9.5% of all respondents in Rounds 1 and 2.
Respondents taking the paper path first took a “core” test of four simple literacy and four simple numeracy items. Those who passed this test were randomly assigned to a module of either 20 literacy tasks or 20 numeracy tasks. Once the module was completed, respondents were given the reading-components test. Respondents who failed the initial “core” test proceeded directly to the reading-components test.
Some 76.6% of respondents attempted the CBA core Stage 1. In total, 72.4% of respondents took the CBA core Stage 2 and 71.6% of the sample went on to the CBA literacy, numeracy or problem solving assessment with 0.8% being directed to the reading components assessment.
Some 23.8% of respondents took the PBA assessment core and 21.6% went on to complete the paper-based literacy and numeracy assessment modules and the reading components assessment. A total of 2.9% of respondents completed the reading components assessment only. There was a small proportion of respondents who did not complete the cognitive assessment.
The Survey of Adult Skills was designed to provide accurate estimates of proficiency in the three domains across the adult population and its major subgroups, rather than at the level of individuals. Each respondent was given a subset of the test items used in the assessment. No individual took modules from all the domains assessed. As can be seen from Figure 3.1, respondents following the CBA path took two assessment modules in either one or two of the three assessment domains.1 Respondents following the PBA path took either a literacy or a numeracy module.
In the CBA mode, the literacy and numeracy assessments had an adaptive design. Respondents were directed to different blocks of items on the basis of their estimated ability. Individuals who were estimated to have greater proficiency were more likely to be directed to groups of more difficult items than those who were estimated to be less proficient. Each of the literacy and numeracy modules was composed of two stages containing testlets (groups of items) of varying difficulty. Stage 1 contained three testlets and Stage 2, four. Respondents’ chances of being assigned to testlets of a certain difficulty depended on their level of educational attainment, whether their native language was the same as the test language, their score on the literacy/numeracy core and, if relevant, their score on a Stage 1 testlet.2
All participating countries/economies were required to administer the literacy and numeracy components of the assessments. Administration of the problem solving in technology-rich environments and the reading-components assessments was optional. All but four countries administered the problem-solving assessment, and all but three administered the reading components assessment. Table 3.3 provides details of participation in each of the cognitive assessments.
copy the linklink copied! Sampling
To maximise the comparability of results, countries/economies participating in the Survey of Adult Skills were expected to meet stringent standards relating to the target population, sample design, sample selection response rates, and non-response bias analysis.
The target population and sampling frame
The target population for the survey consisted of the non-institutionalised population, aged 16-65 years, residing in the country at the time of data collection, irrespective of nationality, citizenship or language status. The normal territorial unit covered by the survey was that of the country as a whole. However, in three countries the sample frame covered subunits of the national territory. In Round 1, only the Flemish region (Flanders) participated in the survey in Belgium and in the United Kingdom, only the autonomous administrative regions of England and Northern Ireland participated. In Round 2, in Indonesia, only the Jakarta municipal area participated in the survey. Following the tsunami of March 2011, Japan had to revise its sample design to exclude affected regions. In the case of the Russian Federation, the results relate to the territory of the Russian Federation excluding the Moscow municipal area. Moscow was excluded after the data collection had been completed due to problems with a data collection in this area.
The sampling frame used by participating countries/economies at each stage of sample selection was required to be up-to-date and include only one record for each member of the target population. Multi-stage sample designs require a sampling frame for each stage of selection.
The sampling frames used by participating countries/economies were of three broad types: population registers (administrative lists of residents maintained at either national or regional level); master samples (lists of dwelling units or primary sampling units maintained at national level for official surveys); or area frames (a frame of geographic clusters formed by combining adjacent geographic areas, respecting their population sizes and taking into consideration travel distances for interviewers). The frames used by countries/economies at different stages of the sample selection are described in Tables 3.4 to 3.6.
Coverage of the target population
Countries’/economies’ sampling frames were required to cover at least 95% of the target population. The exclusion (non-coverage) of groups in the target population was expected to be limited to the greatest extent possible and to be based on operational or resource constraints, as in the case of populations located in remote and isolated regions. Countries/economies using population registers as sample frames could also treat untraceable individuals (i.e. individuals selected in the sample but who were not living at the registered address and could not be traced after multiple attempts) as exclusions, provided that the 5% threshold was not exceeded. All exclusions were required to be approved by the international consortium. Table 3.7 provides details of groups excluded from the sampling frame by design and the estimated proportion of the target population in the two categories of exclusions.
Sample size
The minimum sample size required for the Survey of Adult Skills depended on two variables: the number of cognitive domains assessed and the number of languages in which the assessment was administered. Participating countries/economies had the choice of assessing all three domains (literacy, numeracy and problem solving) or assessing literacy and numeracy only. Assuming the assessment was administered in only one language, the minimum sample size required was 5 000 completed cases3 if all three domains were assessed and 4 500 if only literacy and numeracy were assessed. If a country wished to fully report results in more than one language, the required sample size was either 4 500 or 5 000 cases per reporting language (e.g. 9 000 or 10 000 cases for two languages, depending on the domains assessed). If a country administered the assessment in more than one language but did not wish to report results separately by language, the sample size required was determined as follows: at least 5 000 (or 4 500) completed cases had to be collected in the principal language. The minimum number of completed cases in each of the additional languages was calculated in proportion to the estimated number of adults using the language. In other words, if 10% of the target population spoke a test language other than the principal language, the minimum required sample size was increased by 10%. A reduced sample was agreed for Northern Ireland (United Kingdom) to allow results to be reported separately from those of England (United Kingdom) for key variables. In Round 3, the United States administered PIAAC to a sample of 3 660.
Participating countries/economies were able to oversample particular subgroups of the target population if they wished to obtain more precise estimates of proficiency by geographical area (e.g. at the level of states or provinces) or for certain population groups (e.g. 16-24 year-olds or immigrants). A number of countries did so. Canada, for example, considerably increased the size of its sample to provide reliable estimates at the provincial and territorial level as well as oversampling persons aged 16-25, linguistic minorities, aboriginal population, and recent immigrants.
In addition, Australia and Denmark surveyed samples of individuals outside the survey target population. In the case of Australia, 15-year-olds and 66-74 year-olds were included as a supplemental sample. Chile also surveyed 15-year-olds. Denmark administered the assessment to individuals who had participated in PISA in 2000 and Singapore administered the assessment to individuals who had participated in PISA 2012. Results from individuals included in these national “supplemental samples” are not reported as part of the Survey of Adult Skills.
In 2014, the United States administered the PIAAC instruments to an additional sample of adults in order to enhance the PIAAC Round 1 sample in the US (the PIAAC National Supplement). The objective was to increase the sample size of two key subgroups of interest, unemployed adults (aged 16–65) and young adults (aged 16–34). As sample of older adults (aged 66–74) was also added.
The United States has combined data from the Round 1 collection (2011-12) and the data from the National Supplement to create a combined 2012-14 PIAAC database for the United States. These data have been used in the analysis in the report on Round 3.
Table 3.8 provides information on the sample size by participating country, languages and oversampling.
Sample design
Participating countries/economies were required to use a probability sample representative of the target population. In other words, each individual in the target population had a calculable non-zero probability of being selected as part of the sample. In multi-stage sampling designs, each stage of the sampling process was required to be probability based. Non-probability designs, such as quota sampling and the random route approach, were not allowed at any sampling stage. Detailed information regarding sample designs can be found in the Technical Report of the Survey of Adult Skills, Third Edition (OECD, 2019a).
copy the linklink copied! Translation and adaptation of instruments
Participating countries/economies were responsible for translating the assessment instruments and the background questionnaire. Any national adaptations of either the instruments or the questionnaire was subject to strict guidelines, and to review and approval by the international consortium. The recommended translation procedure was for a double translation from the English source version by two independent translators, followed by reconciliation by a third translator.
All national versions of the instruments were subject to a full verification before the field test, which involved:
-
A sentence-by-sentence check of linguistic correctness, equivalence to the source version, and appropriateness of national adaptations.
-
A final optical check to verify the final layout of the instruments, the equivalence of computer and paper forms, and the correct implementation of changes recommended by the verifiers.
All national version materials revised following the field test were subject to partial verification before the main study. Edits made between the field test and the main study were checked for their compliance with the PIAAC translation and adaptation guidelines and for correct implementation.
copy the linklink copied! Survey administration
The Survey of Adult Skills was administered under the supervision of trained interviewers either in the respondent’s home or in a location agreed between the respondent and the interviewer. After the sampled person was identified, the survey was administered in two stages: completion of the background questionnaire and completion of the cognitive assessment.
The background questionnaire, which was the first part of the assessment, was administered in Computer-Aided Personal Interview format by the interviewer. Respondents were able to seek assistance from others in the household in completing the questionnaire, for example, in translating questions and answers. Proxy respondents were not permitted.
Following completion of the background questionnaire, the respondent undertook the cognitive assessment either using the computer provided by the interviewer or, by completing printed test booklets in the event that the respondent had limited computer skills, was estimated to have very low proficiency in literacy and numeracy, or opted not to take the test on the computer. Respondents were permitted to use technical aids such as an electronic calculator, a ruler (which were provided by interviewers) and to take notes or undertake calculations using a pen and pad during the assessment.
The United States has conducted three rounds of data collection using PIAAC instruments.
Round 1
The United States was one of the 24 countries that participed in the Round 1 of PIAAC which collected data in 2011-12. The data collection for the US Round 1 of PIAAC was undertaken as part of the international data collection managed by the OECD and followed the same procedures and standards as the other countries in Round 1. These are described in the study’s Technical Report (OECD, 2013a) which also provides details of the US’s compliance with these standards and the quality of the data collected. Results for the US were published in the international report of Round 1 (OECD, 2013b).
US data for Round 1 of PIAAC have been released as a public use file (PUF) by the OECD. A PUF including US national variables and restricted use file containing data at a more disaggregated level for some key variables are also available from the NCES website (https://nces.ed.gov/pubsearch/pubsinfo.asp?pubid=2014045REV).
PIAAC National Supplement
The PIAAC National Supplement administered the PIAAC instruments to an additional sample of adults in order to enhance the PIAAC Round 1 sample in the US. The National Supplement included a sample of adults from households not previously selected located in the 80 primary sampling units (PSUs) included in Round 1. The National Supplement household sample increased the sample size of two key subgroups of interest, unemployed adults (aged 16-65) and young adults (aged 16-34), and added a new subgroup of older adults (aged 66-74). The completed sample included 3 660 repondents: 1 064 unemployed adults, 1 545 young adults who were not unemployed and 749 older adults. In addition there were 247 adults aged 35-65 who were not unemployed included in the final sample due to the initial misclassification of their employment status (Hogan et al, 2016, pp. 3-14). The same procedures and instruments used during Round 1 collection were employed during the household data collection for the National Supplement.
The PIAAC National Supplement was a national project managed by US National Centre for Education Statistics (NCES) and was conducted independently of the OECD. The procedures for data collection and reporting closely followed those of PIAAC Round 1. As it was a national project, the OECD was not involved in monitoring the compliance of the US data collection and subsequent data processing with the PIAAC standards or in the assessment of data quality. The technical details of the implementation of National Supplement are presented in the project’s Technical Report (Hogan et al, 2016).
The data from the US National Supplement have been released in the form of a national U.S. PUF and an OECD PUF for 2011 (available on OECD website) combining data from the 2011-12 and 2014 data collections. An 2017 OECD PUF for the U.S. is planned to be released as well. Restricted use versions of the files are also available to researchers.
It should be noted that the PIAAC 2012/2014 data set was weighted to control totals from the 2012 American Community Survey (ACS) (a supplement to the population census) (Hogan et al., 2016, 8-1). The PIAAC 2012 data was weighted to the 2010 ACS (OECD, 2013a). The reweighting has some impact on the estimated proficiency of the population. The 2010 ACS was linked to the 2000 census whereas the 2012 ACS was based on the 2010 census. As it is weighted to more up-to-date control totals (as well as being based on a larger sample), the combined PIAAC 2012/2014 data set for the US provides a more accurate representation of the proficiency of the US population (in the period 2011-14) than the 2012 data set. For this reason, data from the 2012-2014 US data set has been used in this report in place of the 2012 data set used in earlier reports.
Round 3
The US Round 3 data collection was also conducted as a national project managed by the NCES in conjunction with the Round 3 data collection managed by the OECD. It used the same instruments and followed similar procedures to the other countries participating in Round 3. Data collection was undertaken on a slightly different timetable to that of other participants. In the US data were collected over March-September, 2017 compared to August 2017-April 2018 in other Round 3 countries. The US deviated from the PIAAC Technical Standards (PIAAC, 2014) in some areas. A field test was not undertaken. The sample size (a target of 3 800 cases) was less than the minimum sample size required by the PIAAC Standards and Guidelines (5 000 completed cases). Quality control activies were not the same in the US as in other countries. In addition, the quality of the data for the US was not reviewed by the PIAAC Technical Advisory Group (TAG) as was the case for the other five countries in Round 3. As in the case of the National Supplement, a full Technical Report has been released (Krenzke et al., 2019). On the basis of the information in the Technical Report, the US data are considered to meet the PIAAC standards for publication.
The Round 3 data for the US have been released in the form of a PUF and a restricted use file.
Sources :
Hogan, J., N. Thornton, L. Diaz-Hoffmann, L. Mohadjer, T. Krenzke, J. Li, W. VanDeKerckhove, K. Yamamoto, and L. Khorramdel (2016), U.S. Program for the International Assessment of Adult Competencies (PIAAC) 2012/2014: Main Study and National Supplement Technical Report (NCES 2016-036REV). U.S. Department of Education. Washington, DC: National Center for Education Statistics. Available from http://nces.ed.gov/pubsearch.
Krenzke, T., W. VanDeKerckhove, N. Thornton, L. Diaz-Hoffmann, L. Mohadjer, J. Hogan, J. Li, K. Yamamoto, and L. Khorramdel (2019), U.S. Program for the International Assessment of Adult Competencies (PIAAC) 2012/2014/2017: Main Study, National Supplement, and PIAAC 2017 Technical Report (NCES 2020042). U.S. Department of Education. Washington, DC: National Center for Education Statistics. Available from http://nces.ed.gov/pubsearch.
OECD (2013a), Technical Report of the Survey of Adult Skills, October, www.oecd.org/skills/piaac/_Technical%20Report_17OCT13.pdf.
OECD (2013b), OECD Skills Outlook 2013: First Results from the Survey of Adult Skills, OECD Publishing, Paris, https://doi.org/ 10.1787/9789264204256-en.
PIAAC (2014), PIAAC Technical Standards and Guidelines, June, www.oecd.org/skills/piaac/PIAAC-NPM(2014_06)PIAAC_Technical_Standards_and_Guidelines.pdf.
Respondents were not allowed to seek assistance from others in completing the cognitive assessment. However, the interviewer could intervene if the respondent had problems with the computer application or had questions on how to proceed with the assessment.
The direct-assessment component of the survey was not designed as a timed test; respondents could take as much or as little time as needed to complete it. However, interviewers were trained to encourage respondents to move to another section of the assessment if they were having difficulties. Respondents who started the cognitive assessment tended to finish it. The time taken to complete the cognitive assessment varied between 41 and 50 minutes on average depending on the country/language version.
The survey (background questionnaire plus cognitive assessment) was normally undertaken in one session. However, in exceptional circumstances, a respondent could take the questionnaire in one session and the cognitive assessment in another. The cognitive assessment was required to be completed in one session. Respondents who did not complete the assessment within a single session for whatever reason were not permitted to finish it at a later time.
Data collection in Round 1 of the Survey of Adult Skills took place from 1 August 2011 to 31 March 2012 in most participating countries/economies. In Canada, data collection took place from November 2011 to June 2012 and France collected data from September to November 2012. Data collection for Round 2 of the Survey of Adult Skills took place from 1 April 2014 to 31 March 2015. Data collection for Round 3 of the Survey of Adult Skills took place from 1 August 2017 to 30 April 2018 with the exception of the United States where data collection took place between March 2017 and September 2017.
Interviewers administering the survey were required to be trained according to common standards. These covered the timing and duration of training, its format and its content. A full set of training materials was provided to countries. The persons responsible for organising training nationally attended training sessions organised by the international consortium.
copy the linklink copied! Response rates and non-response bias analysis
A major threat to the quality of the data produced by the Survey of Adult Skills was low response rates. The PIAAC Technical Standards and Guidelines (PIAAC, 2014) required that countries/economies put in place a range of strategies to reduce the incidence and effects of non-response, to adjust for it when it occurred, and to evaluate the effectiveness of any weighting adjustments implemented to reduce non-response bias. In particular, countries/economies were expected to establish procedures during data collection to minimise non-response. These included pre-collection publicity, selecting high-quality interviewers, delivering training on methods to reduce and convert refusals, and monitoring data collection closely to identify problem areas or groups and directing resources to these particular groups. At least seven attempts were to be made to contact a selected individual or household before it could be classed as a non-contact. The overall rate of non-contact was to be kept below 3%.
Response rates were calculated for each stage of the assessment: screener (only for countries/economies that need to sample households before selecting respondents); background questionnaire and Job Requirement Approach module; assessment (without reading components); and reading components.
The overall response rate was calculated as the product of the response rates (complete cases/eligible cases) for the relevant stages of the assessment. For countries/economies with a screener questionnaire, the overall response rate was the product of the response rates for the screener, background questionnaire/Job Requirement Approach module and assessment; for countries/economies without a screener, it was the product of the response rates for the questionnaire/module and the assessment.
The computations at each stage are hierarchical in that they depend on the response status from the previous data collection stage. A completed case thus involved completing the screener (if applicable), the background questionnaire, and the cognitive assessment. In the case of the questionnaire, a completed case was defined as having provided responses to key background questions, including age, gender, highest level of schooling and employment status or responses to age and gender for literacy-related non-respondents. For the cognitive assessment, a completed case was defined as having completed the “core” module, and a literacy/numeracy core module, or a case in which the core module was not completed for a literacy-related reason, for example, because of a language difficulty or because the respondent was unable to read or write in any of a country’s test languages or because of learning or mental disability.
As noted above, countries/economies using population register-based sampling frames were able to treat some or all of the individuals in their samples who were untraceable as exclusions (i.e. as outside the target population) and exclude them from the numerator and denominator of the response-rate calculation (provided that the 5% threshold for exclusions was not exceeded).
The survey’s Technical Standards and Guidelines set a goal of a 70% unit response rate. Ten countries achieved this goal, five in Round 1, two in Round 2, and 3 in Round 3. For the most part, response rates were in the range of 50%-60%. Response rates by country/economy are presented in Table 3.9.
Countries/economies worked to reduce non-response bias to the greatest extent possible before, during, and after data collection. Before data collection, countries implemented field procedures with the goal of obtaining a high level of co-operation. Most countries followed the PIAAC required sample monitoring activities to reduce bias to the lowest level possible during data collection. Finally, countries gathered and used auxiliary data to reduce bias in the outcome statistics through non-response adjustment weighting.
All countries/economies were required to conduct a basic non-response bias analysis (NRBA) and report the results. The basic analysis was used to evaluate the potential for bias and to select variables for non-response adjustment weighting. In addition, countries were required to conduct and report the results of a more extensive NRBA if the overall response rate was below 70%, or if any stage of data collection (screener, background questionnaire, or the assessment) response rate was below 80%. A NRBA was required for any BQ item with response rate below 85%.
Australia, Indonesia (Jakarta), Kazakhstan, Korea, Mexico, Peru, Turkey and the United States achieved an overall response rate of 70% or greater. As their response rates for each stage were greater than 80%, they did not require the extended NRBA. Cyprus4 and Ireland also achieved overall response rates of 70% or greater, but they achieved a lower than 80% response rate for one stage of their sample. The remaining countries achieved response rates lower than 70%.
The main purpose of the extended analysis was to assess the potential for remaining bias in the final weighted proficiency estimates after adjusting for non-response. As the proficiency levels of non-respondents are unknown, the NRBA is carried out by making assumptions about non-respondents. Multiple analyses were, therefore, undertaken to assess the potential for bias as each individual analysis has limitations due to the particular assumptions made about non-respondents. The extended NRBA included seven analyses (as listed below). Together, they were used to assess the patterns and potential for bias in each country data.
-
1 Comparison of estimates before and after weighting adjustments
-
2 Comparison of weighted estimates to external totals
-
3 Correlations of auxiliary variables and proficiency estimates
-
4 Comparison of estimates from alternative weighting adjustments
-
5 Analysis of variables collected during data collection
-
6 Level-of-effort analysis
-
7 Calculation of the range of potential bias
Cyprus1 and Ireland were required to do only a subset of the analyses since their overall response rate was higher than 70%.
Table 3.10 summarises the results of the NRBA for countries/economies with response rates lower than 70%. The overall conclusion was that, on the balance of evidence, the level of non-response bias was in the range of minimal to low in countries required to undertake the extended analysis available. The results for England/Northern Ireland (United Kingdom) were, however, inconclusive because many of the analyses were either incomplete or not conducted. Data users should be aware that the analyses are all based on various assumptions about non-respondents. Multiple analyses, with different assumptions, were included in the NRBA to protect against misleading results. However, the lower the response rate, the higher is the risk of hidden biases that are undetectable through non-response bias analysis even when multiple analyses are involved.
copy the linklink copied! Literacy-related non-response
In most participating countries/economies a proportion of respondents were unable to undertake the assessment for literacy-related reasons, such as being unable to speak or read the test language(s), having difficulty reading or writing, or having a learning or mental disability. Some of these respondents completed the background questionnaire, or key parts of it, presumably with the assistance of an interviewer who spoke the respondent’s language, a family member or another person.
The available background information regarding these respondents was used to impute proficiency scores in literacy and numeracy. Scores were not, however, imputed in problem solving in technology-rich environments domain, as these respondents did not undertake the ICT core assessment. Other respondents were able to provide only very limited background information as there was no one present (either the interviewer or another person) to translate into the language of the respondent or answer on behalf of the respondent. For most of these respondents, the only information collected was their age, gender and, in some cases, highest educational attainment. As a result, proficiency scores were not estimated for these respondents in any domain; however, they have been included as part of the weighted population totals and are included in the charts and tables in OECD Skills Outlook 2013 (OECD, 2013) and Skills Matter: Further Results from the Survey of Adult Skills (OECD, 2016), and Skills Matter: Additional Results from the Survey of Adult Skills (2019b) under the category of literacy-related non-response (missing).The proportions of respondents who did not undertake the cognitive assessment and (a) received imputed scores and (b) did not receive imputed scores are presented in Table 3.11. Flanders (Belgium) and Cyprus1 each stand out as having a high proportion of respondents who did not receive imputed scores due to having relatively high proportions of respondents for whom limited background information was available.
copy the linklink copied! Scoring
For the large majority of respondents who took the assessment in its CBA format, scoring was done automatically. Manual scoring was necessary in the case of respondents taking the PBA version. Participating countries/economies were required to undertake within-country reliability studies during both the field test and main survey to check the consistency of scoring. This required a second scorer to re-score a pre-defined number of cognitive paper-and-pencil assessments.5 The level of agreement between the two scorers was expected to be at least 95%.
In addition, a cross-country reliability study was conducted to identify the presence of systematic scoring bias across countries. At least two bilingual scorers (fluent in the national language and English) scored English-language international anchor booklets to ensure the equivalence of scoring across countries. These scores were compared and evaluated against the master scores for accuracy.
The levels of agreement achieved in the within-country and between-country studies of scoring reliability are presented in Table 3.12.
copy the linklink copied! Overall assessment of data quality
The data from participating countries/economies was subject to a process of “adjudication” to determine whether it was of sufficient quality to be reported and released to the public. The adjudication process used a broad definition of quality – that of “fitness for use”. While countries’ compliance with the requirements of the PIAAC Technical Standards and Guidelines (PIAAC, 2014) was an important component of the quality assessment, the goal was to go beyond compliance to assess whether the data produced were of sufficient quality in terms of their intended uses or applications. In assessing overall quality, the focus was on four key areas:
-
sampling
-
coverage and non-response bias
-
data collection, and
-
instrumentation.
In each of the domains identified above, countries/economies were assessed against a set of quality indicators. These indicators reflected the major requirements of the survey’s Technical Standards and Guidelines (PIAAC, 2014) in the domains concerned. All countries/economies either fully met the required quality standards or, if they did not fully meet them, they met them to a degree that was believed not to compromise the overall quality of the data. The data from all participating countries/economies were determined to have met the quality standards required for reporting and public release. The assessments of the quality of participating countries’ data were reviewed by the project’s Technical Advisory Group before being submitted to the Board of Participating Countries.
Over the three data collection rounds of the first cycle of PIAAC, there were specific concerns about some aspects of the quality of data in three countries: the Russian Federation, Greece and Kazakhstan. These concerns and the action taken to rectify them are described below. In the Russian Federation (Round 1), concerns regarding the process of data collection in the Moscow municipal area led to data from this area to be removed from the Russian data file. Thus, the sample for the Russian Federation covers the population of the Russian Federation with the exception of the population of the Moscow municipal area. In Greece (Round 2), a large number of cases (1 032 in total) were collected without complete cognitive data. Proficiency scores in literacy and numeracy have been imputed for these cases. In Kazakhstan, as a result of quality control checks, 70 interviewers were identified who had falsified interviews. A total of 239 falsified cases were identified out of a randomly sampled 1 961 cases for verification among the entire sample of 6 343. The PIAAC Consortium ran quality control checks on all the data and further identified a further 19 interviewers who had duplicated 55 cases. The Technical Advisory Group recommended that both the 239 falsified cases and the 55 duplicated cases be deleted from the final dataset (one case was both falsified and duplicated). Accordingly, a total of 293 unique cases were excluded and Kazakhstan’s remaining data of 6 050 cases received their final weights. Further information can be found in the Technical Report of the Survey of Adult Skills, Third Edition (OECD, 2019a).
The sample for the Russian Federation does not include the population of the Moscow municipal area. The data published, therefore, do not represent the entire resident population aged 16-65 in the Russian Federation but rather the population of the Russian Federation excluding the population residing in the Moscow municipal area.
More detailed information regarding the data from the Russian Federation as well as that of other countries can be found in the Technical Report of the Survey of Adult Skills, Third Edition (OECD, 2019a).
References
OECD (2019a), Technical Report of the Survey of Adult Skills, Third Edition, www.oecd.org/skills/piaac/publications/PIAAC_Technical_Report_2019.pdf.
OECD (2019b), Skills Matter: Additional Results from the Survey of Adult Skills, OECD Publishing, Paris, https://doi.org/10.1787/1f029d8f-en.
OECD (2013), OECD Skills Outlook 2013: First Results from the Survey of Adult Skills, OECD Publishing, Paris, https://doi.org/ 10.1787/9789264204256-en.
PIAAC (2014), PIAAC Technical Standards and Guidelines, OECD Programme for the International Assessment of Adult Competencies, www.oecd.org/site/piaac/PIAAC-NPM%282014_06%29PIAAC_Technical_Standards_and_Guidelines.pdf.
Notes
← 1. The exception was countries in which problem solving in technology-rich environments was not tested. In these cases, some respondents would take both a literacy and a numeracy module in CBA mode.
← 2. However, all respondents, whatever their characteristics and score on the core or the Stage 1 testlet, had some chance of being assigned to a testlet of a certain difficulty.
← 3. A completed case is defined as an interview in which the respondent provided answers to key background questions, including age, gender, highest level of schooling and employment status, and completed the “core” cognitive instrument (except in cases in which the respondent did not read the language[s] of the assessment).
← 4. See note regarding Cyprus under Table 3.1.
← 5. In the main study, at least 600 cases (or 100% of cases if the number of respondents was less than 600) in each of the test languages had to be re-scored.
Metadata, Legal and Rights
https://doi.org/10.1787/f70238c7-en
© OECD 2019
The use of this work, whether digital or print, is governed by the Terms and Conditions to be found at http://www.oecd.org/termsandconditions.