Chapter 3. The changing landscape of teaching
This chapter describes the age, experience and gender distribution profiles of lower secondary teachers and school principals in countries and economies participating in TALIS and examines how their demographic characteristics and experience have evolved since 2008. It explores how teachers deal with societal changes that have created new contexts for teaching, with increasingly diverse classrooms and schools. It also explores the practices implemented in schools to respond to student diversity, as well as teachers’ preparedness and confidence to teach in these more diverse environments. The chapter then turns to school and classroom climate as an important lever within the school for students’ learning and well-being, as well as for teachers’ confidence and commitment to teaching. Finally, it sets the scene for the remainder of the report by identifying school resources issues that, according to teachers and school leaders, particularly require action.
A note regarding Israel
The statistical data for Israel are supplied by and under the responsibility of the relevant Israeli authorities. The use of such data by the OECD is without prejudice to the status of the Golan Heights, East Jerusalem and Israeli settlements in the West Bank under the terms of international law.
-
Across OECD countries and economies participating in the Teaching and Learning International Survey (TALIS), principals are generally older than teachers, with the average age for a principal being 52, compared to 44 for teachers. However, the teacher workforce has also aged in a number of countries over the past five to ten years.
-
Women account for 68% of the teacher workforce, while only 47% of principals are women, on average across OECD countries and economies participating in TALIS.
-
On average across OECD countries and economies participating in TALIS, 17% to 31% of teachers work in schools with diverse student composition in terms of socio-economic, cultural, linguistic background or educational needs, as reported by school leaders. Since it is unlikely that the same schools concentrate all forms of diversity at the same time, the proportion of teachers actually working with diverse students is likely much higher. These averages, however, conceal significant cross-country variations.
-
According to school leaders, more than 75% of schools implement equity-related policies to address gender and socio-economic discrimination, on average across OECD countries and economies participating in TALIS.
-
According to school leaders, the most common policies and practices related to diversity are those embedded in the teaching process: 80% of teachers working in multicultural schools work in a school that has integrated global issues throughout the curriculum and teaches students how to deal with ethnic and cultural discrimination. Policies and practices promoting diverse cultures are less common: only 61% of teachers working in multicultural schools work in a school that supports activities or organisations encouraging students’ expression of diverse ethnic and cultural identities.
-
According to school leaders, schools in OECD countries and economies participating in TALIS remain immune from daily and weekly safety-related incidents for the most part. But, 14% of school principals still report regular acts of intimidation or bullying among their students. Change over time suggests that the frequency of incidents related to bullying has decreased in eight participating countries and economies since 2013, according to principals’ reports. But, in a few systems, their frequency has increased, according to principals, which calls for close monitoring and specific action.
-
Relations between teachers and their students are extremely positive. On average across OECD countries and economies participating in TALIS, 96% of teachers concur that teachers and students usually get on well with one another – up from 2008 for most countries with available data. Change in student-teacher relations over time also reveals that teachers’ belief in the importance of student well-being has progressed in the vast majority of countries since 2008.
-
The most common resource issues reported by school leaders in participating countries and economies are shortages of:
1) support personnel; 2) teachers with competence in teaching students with special needs; and 3) time for instructional leadership (each reported by about one-third of principals).
-
The most common priorities for policy intervention reported by teachers in participating countries and economies are: 1) reducing class sizes (reported by 65% of teachers); 2) improving teacher salaries (64%); 3) offering high-quality professional development for teachers (55%) and 4) reducing teachers’ administration load (55%).
Introduction
Since the first cycle of TALIS in 2008, the world has experienced substantial changes: emergence of a global middle class, greater digitalisation, rapid dissemination of innovation, the 2008 financial crisis and its ongoing impacts, growing pressures on public budgets, challenges to social cohesion and democratic values and a large influx of refugees in recent years. All these trends have an impact on countries and societies, as well as on students, teachers and school leaders in their education systems (OECD, 2016[1]; OECD, 2019[2]).
In addition to their impact on the characteristics and profiles of learners and the learning environments and climate in schools and classrooms, these issues challenge the way education has been conceived and the nature of teaching in the 21st century, engendering a sense of urgency to adapt to new realities as the pace of change is accelerating.
It is now widely accepted that students today need to develop broader knowledge, skills and attitudes than previous generations to be successful in their careers and personal lives (Kuhn and Weinberger, 2005[3]; OECD, 2018[4]; UNESCO, 2016[5]). This is prompting many education systems to review their curriculum and the way it is taught, to prepare students to confront the future with confidence as responsible citizens (Barber and Mourshed, 2009[6]; Reimers and Chung, 2016[7]; UNESCO, 2016[8]). Thus, the work of teachers is more complex than ever, raising the question of how well teachers are prepared for these new contexts and new demands. This chapter describes the current landscape of teaching and the extent and complexity of change since the two previous TALIS surveys in 2008 and 2013.
The strong influence of teachers on instructional quality and student achievement is widely accepted (Hattie, 2009[9]; Kyriakides, Christoforou and Charalambous, 2013[10]), as is the acknowledgement of school leadership as a lever for school-level improvement (Hallinger and Heck, 2010[11]; Horng and Loeb, 2010[12]; Scheerens and Bosker, 1997[13]).
Recognising that teachers are central to the teaching process and school leadership is critical to enhancing education quality, this chapter begins by describing the profiles of lower secondary teachers and school principals in countries and economies participating in TALIS, in terms of age, experience and gender distribution and how their demographic characteristics and experience have evolved since 2008. It then explores how teachers deal with societal changes that have created new contexts for their teaching, with increasingly diverse classrooms and schools in terms of students’ backgrounds and ability levels. It also examines the practices implemented in schools to respond to student diversity, as well as teachers’ preparedness and confidence to teach in these more diverse environments. Attention then turns to school and classroom climate, as important context and a school-level lever for both students’ learning and social well-being and teachers’ confidence and commitment to teaching. The chapter concludes by identifying school resources issues and areas that particularly require intervention and improvement, according to teachers and school leaders. This sets the scene for the remainder of this volume and for Volume II, Teachers and School Leaders as Valued Professionals (to be published in 2020).
Changing demographics of the profession
Only some education systems have staffing surveys or census information providing a detailed profile of their teachers and principals. When this is not the case, the TALIS survey offers a useful alternative, as well as an international comparative perspective on the characteristics of teachers and school leaders across participating countries and economies. This makes it possible to capture their demographic profiles in terms of age and gender and also, through analysis of their work experience (overall and at their current school), to provide indications on career paths of teachers and principals, as well as the degree of staff stability and mobility in the system. Patterns of experience also have implications for policy makers, with respect to the nature of training and support mechanisms needed to support the profession, through induction and mentoring schemes for inexperienced teachers and principals (see Chapter 4) and professional development for more experienced teachers and school leaders (see Chapter 5). Changes over time in these indicators also provide valuable information on the dynamics of human resources in school education.
Age and experience profile of teachers and school leaders
Information from TALIS about the age and experience distribution of the teacher workforce is valuable to policy makers because, in combination with projections on student numbers, it helps them to assess the renewal of the profession needed to compensate for retirement attrition in education systems with ageing populations (OECD, 2009[14]; OECD, 2018[15]). Information on the age and experience distribution of teachers also helps policy makers to assess needs for training and support mechanisms to best support the profession. Having a diverse age distribution among teachers can also expose students to different role models at different stages of the lifespan.
Likewise, the demographic and experience profiles of principals help policy makers to forecast and manage human resources for principals in the system and to support them in schools. Indeed, school principals are increasingly viewed as critical in fostering quality teaching, through their influence – direct or indirect – on school organisation and climate and on teachers and teaching (OECD, 2016[16]; Orphanos and Orr, 2014[17]). School leadership has become a priority for many countries concerned about improving student achievement (Pont, Nusche and Moorman, 2008[18]) and improving schools that are underperforming or failing (Branch, Hanuschek and Rivkin, 2013[19]). School leaders are at the intersection between teachers, students, parents/ guardians, the educational system and the wider community in which the school exists. There is mounting evidence that the role of school leaders has become increasingly challenging, with increased workloads and accountability duties (OECD, 2014[20]; OECD, 2016[16]). It is even more so for new principals, who find it particularly challenging to collaborate with and gain the credibility of different stakeholders (Beam, Claxton and Smith, 2016[21]). The challenges that school leaders face also depend on the social, economic and physical context of the schools they lead (Pont, Nusche and Moorman, 2008[18]). Previous evidence from TALIS shows that principals’ actions as instructional leaders are limited but are positively associated with training received in instructional leadership (OECD, 2014[20]). This brings to the fore the question of how much experience they bring to the job and how to best support them to meet the many demands they face.
In 2018, the average age of teachers across the OECD1 was around 44, with considerable variation across countries (Figure I.3.1, Table I.3.1). These differences are reflected in varied proportions of younger teachers (under age 30) and older teachers (aged 50 or above). At one end of the spectrum, the average teacher is aged 40 or younger in Belgium (and in the Flemish Community), England (United Kingdom), Malta, Saudi Arabia, Shanghai (China), Singapore, Turkey, the United Arab Emirates and Viet Nam. At the other extreme, the average teacher is over age 48 in Bulgaria, Estonia, Georgia, Italy, Latvia, Lithuania and Portugal.
More than half of teachers are aged 50 or above in Bulgaria, Estonia, Georgia, Latvia and Lithuania, and this is also the case for over 45% of teachers in Hungary, Italy and Portugal, suggesting ageing teacher populations. These education systems may face the challenge of replacing teachers in large numbers over the next 15 years (or even sooner), since the average normal pension age in OECD countries in 2016 was 64.3 years for men and 63.7 years for women (OECD, 2017, pp. 93, Table 3.7[22]). Such challenges will inevitably emerge if new teacher recruitment does not keep pace with retirement-induced attrition, after accounting for projected changes in student enrolments (Figure I.3.1, Table I.3.1).
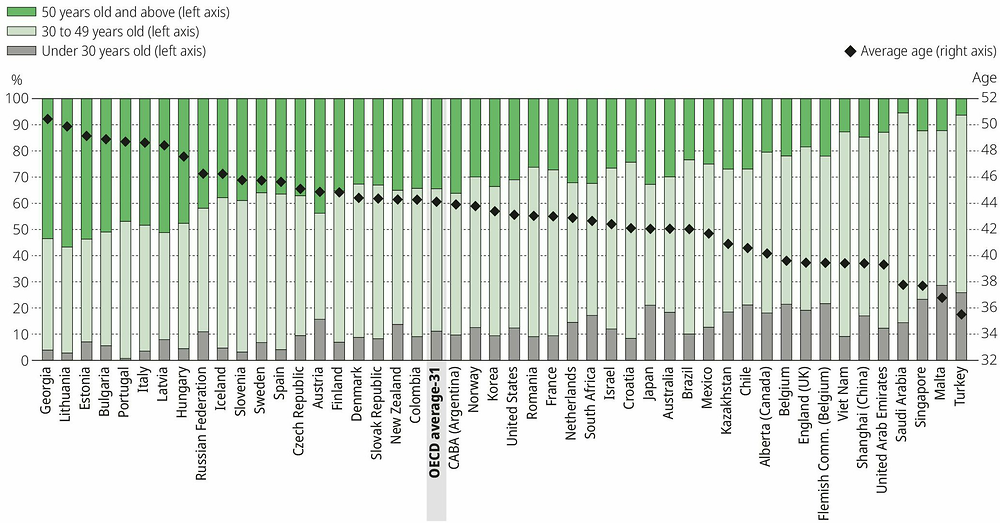
Countries and economies are ranked in descending order of the average age of teachers.
Source: OECD, TALIS 2018 Database, Table I.3.1.
While TALIS 2018 demographics data provide a snapshot of the profile of the teacher population in participating countries and economies, changes over time shed further light on its dynamics. Indeed, the challenges currently faced by policy makers (or expected in the years to come) depend on countries’ historical trajectories in education. For example, in many countries, entry of the baby-boom generation into the education system in the 1950s and 1960s, combined with widening access to secondary education, translated into mass recruitment of teachers in the 1960s and 1970s and hence mass retirements a generation later (Lim, 2013[23]).
Since the earlier rounds of TALIS in 2008 and 2013, some education systems have faced ageing of their teacher population. The share of teachers age 50 or above rose by over 5 percentage points or more in Brazil, Estonia, Georgia, Iceland, Korea, Latvia, Portugal and Shanghai (China) since 2013 (Figure I.3.3), and in Bulgaria, Hungary, Lithuania, Slovenia and Spain since 2008. The change has been most dramatic in Portugal, with an increase in the share of teachers age 50 or above from 28% in 2013 to 47% in 2018. By contrast, Australia and Croatia saw the share of their teachers over age 50 drop by more than 5 percentage points since 2013, as did Denmark, Malta and Norway since 2008 (Table I.3.4 and Box I.3.1).
As far as school leaders are concerned, across the OECD in 2018, the average principal is 52 years old, 8 years older than the average teacher. This is not surprising, as principals are usually recruited from among the ranks of teachers, and their positions often require higher academic credentials and more years of experience. Brazil, Malta, Romania, Saudi Arabia, Turkey and the United States have the youngest principals (under age 48 on average), while the average principal is aged 56 or above in Italy, Japan and Korea. The largest proportions of principals under age 40 are found in Brazil, Mexico, Saudi Arabia, Turkey and the United States, with over 20% of school leaders in this age group. The five countries with the largest proportions of principals nearing retirement (at age 60 or above) are Austria, Colombia, Italy, Korea and Lithuania (Figure I.3.2, Table I.3.5).
A critical problem concerning the teaching workforce in Denmark was the high dropout rates of students from teacher education institutions. In order to address this issue, initial teacher education reforms in 2013 have shifted the focus of institutions from the quantity of teacher candidates to the quality of teacher graduates. Admission requirements for entry into teacher education institutes, initially limited to marks obtained in upper secondary education, were revised to a two-tier process. Following these reforms, teacher candidates can gain admission to university colleges that offer teacher education programmes through either specific requirements for performance in upper secondary education or an entry examination and interview. In addition to these changes in selection processes, the curriculum of initial teacher education institutions was considerably deregulated. The focus of teacher education programmes has shifted from subject-specific knowledge to pedagogical content. Teaching candidates also take competency-based examinations and are expected to graduate with teaching competencies in two main subjects. In the last five years, dropout rates in teacher education have declined considerably, and an increased number of young and high-quality teacher graduates have entered the Danish teaching workforce.
Source: Nusche, D., et al. (2016[24]), OECD Reviews of School Resources: Denmark 2016, OECD Reviews of School Resources, https://doi.org/10.1787/9789264262430-en.
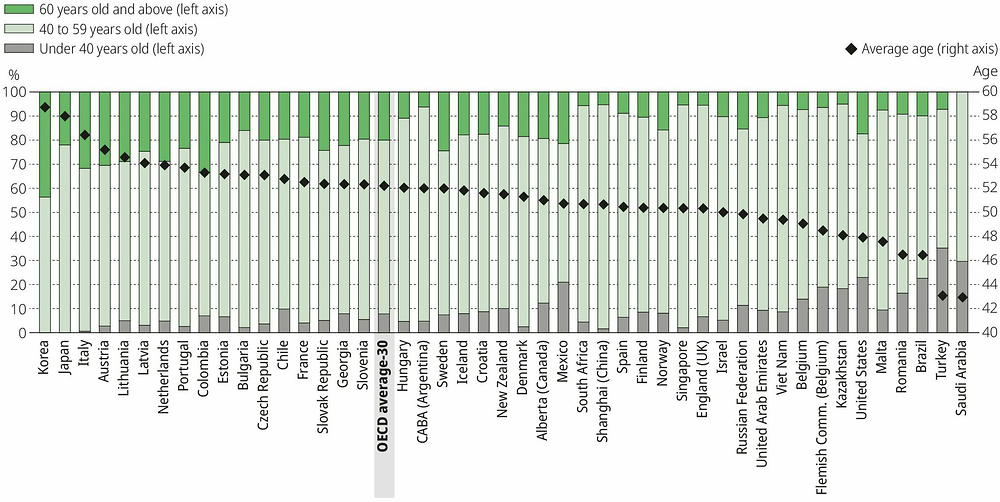
Countries and economies are ranked in descending order of the average age of principals.
Source: OECD, TALIS 2018 Database, Table I.3.5.
Changes in the share of principals nearing retirement show that some education systems have experienced ageing in their principal population, with increases greater than 5 percentage points in the share of principals age 60 or above. This is the case for the Czech Republic, France and Portugal since 2013 (Figure I.3.3), and Austria, Brazil, Bulgaria, Estonia, Lithuania, Mexico, the Slovak Republic, Slovenia and Turkey since 2008. To accommodate the attrition of principals to come as a result of retirements, those systems will need to prepare and promote a new generation of school leaders in the near future or reorganise their school networks and school management responsibilities in new ways (Table I.3.8).
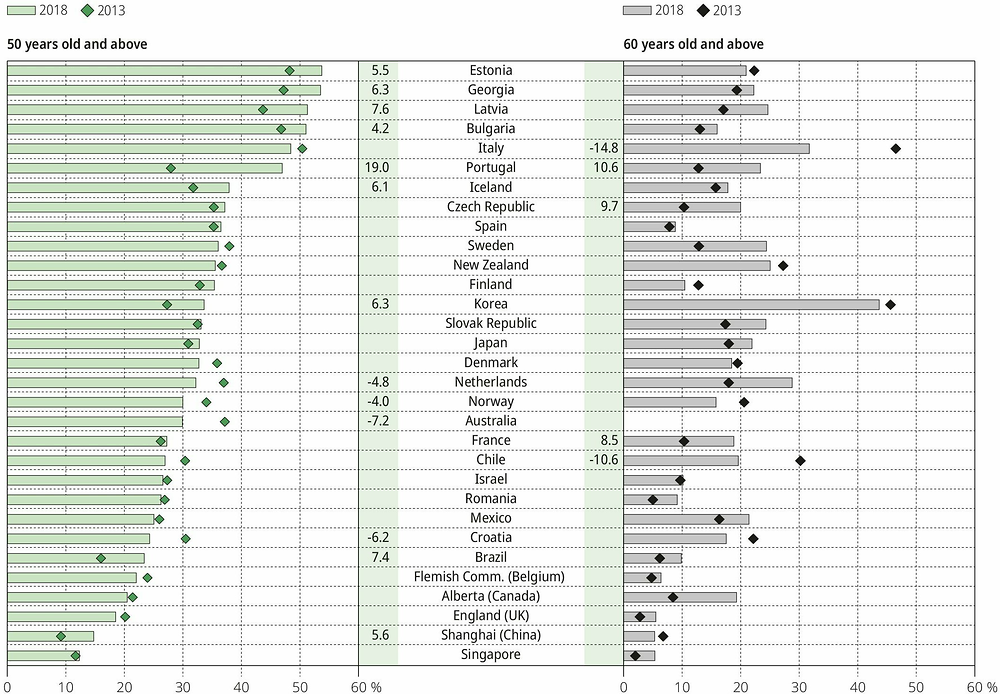
Notes: Only countries and economies with available data for 2013 and 2018 are shown.
Statistically significant changes between 2013 and 2018 (TALIS 2018 – TALIS 2013) are found next to the category and the country/economy name (see Annex B).
Countries and economies are ranked in descending order of the percentage of lower secondary teachers who are 50 years old and above in 2018.
Source: OECD, TALIS 2018 Database, Tables I.3.4 and I.3.8.
Demographic patterns of the teacher and principal populations inevitably translate into diverse patterns of teacher and principal experience across countries. In 2018, on average across the OECD, teachers have about 17 years of experience in teaching in total, of which about 10 years is at their current school (Table I.3.9). Likewise, the average principal across the OECD has 10 years of experience in this role in total in 2018, of which 7 years is at the current school (Table I.3.13).
Changes in the proportions of teachers and school leaders with different levels of experience confirm some of the change patterns identified in relation to ageing of the profession. Brazil, Portugal, Singapore and Shanghai (China) have experienced an increase in the levels of experience (“seniorisation”) of their teachers since 2013, with either increases in the share of the most experienced teachers (over 20 years of experience) or decreases in the share of new teachers (less than or equal to 5 years) of at least 5 percentage points (Table I.3.12). With respect to school leaders, a relative seniorisation of principals has occurred in France since 2013, and in Bulgaria, Estonia and Lithuania since 2008. These systems benefit from having more experienced teachers and principals, but they will need to plan for their replacement in coming years wherever large proportions of staff are over age 60 (Table I.3.16).
Patterns of teacher experience vary with respect to the degree to which they have worked (or are still working) in non-education roles in addition to being a teacher, which can signal either late entry into the profession (as a second career) or holding two jobs at a time. On average across the OECD, teachers have worked 3.5 years in non-education roles. Work experience outside education is commonplace in Alberta (Canada), Brazil, Ciudad Autónoma de Buenos Aires (hereafter CABA, Argentina), Iceland, New Zealand, Sweden and the United States, where teachers have worked at least 5 years on average in non-education roles. But this is seldom the case in Japan, Korea, Saudi Arabia, Shanghai (China), Slovenia, Turkey and Viet Nam (Table I.3.9).
Principals also bring a variety of experiences to their role. School leadership careers typically build upon a foundation of teaching experience, and the average OECD principal has close to 20 years of experience as a teacher as well as 5 years working in school management roles other than principal. However the routes to school leadership positions vary across education systems. Principals in Austria, CABA (Argentina), Japan, Korea and Latvia have the longest teaching background, with over 25 years of teaching experience on average. Intermediate (non-principal) school management roles are most common in England (United Kingdom) and Shanghai (China), where principals have over 10 years of experience in such positions, on average. Principals with the most experience in jobs other than teaching, principal or school management roles (5 years or more) are found in CABA (Argentina), Colombia, Estonia, Georgia, New Zealand, Sweden and the United States. This suggests that they might have entered the education sector as a second career or that they have or have had two jobs at the same time (Table I.3.13).
The experience of teachers and principals at their current school sheds light on the degree of staff mobility within the system. On average across the OECD, teachers have been working at their current school for 10 years, which suggests relatively low levels of staff mobility across schools within the education system. The reasons for this can derive from many different factors: geography (schools dispersed across a large territory with few other schools nearby); legislation (e.g. mandatory staff mobility in Japan and Korea, (OECD, 2005[25]); degree of school autonomy (state or school employer and easiness to transfer to another school); age and settlement in a residential area; and degree of satisfaction with the current school. Mobility across schools is lowest in Georgia, Latvia, Lithuania, the Russian Federation and Slovenia, where teachers have worked at the same school for more than 15 years on average, and highest in Japan, Korea and Turkey, where the average experience at the same school is 5 years or less (Table I.3.9).
Principals in Colombia, France, the Netherlands, Singapore, Sweden and Viet Nam display the lowest levels of experience at their current school when contrasted with their total experience as principals – suggesting mobility across schools. By contrast, there is little mobility (non-significant difference between total years of experience as a principal and time as a principal at the current school) in 20 countries and economies participating in TALIS (Table I.3.13).
Gender of teachers and school leaders
Information about the gender distribution of the teacher and principal workforces makes it possible to assess the degree of gender imbalance in the teaching profession. This is a well-documented phenomenon, with female teachers dominating the teaching profession, most prominently in pre-primary and primary education, although the differences persist well into secondary education in many countries (OECD, 2014[20]; OECD, 2018[15]; UNESCO Institute for Statistics, 2006[26]; UNESCO Institute for Statistics, 2009[27]). There is also evidence that gender balance issues differ across disciplines (American Academy of Arts & Sciences, 2017[28]),2 levels of education (OECD, 2018[15]), and between the teaching and leadership professions.
Gender imbalances in the teaching profession are a policy concern in a number of systems that struggle to attract men to the profession (Drudy, 2008[29]; OECD, 2005[25]; OECD, 2009[14]), but there are two distinct aspects to this policy issue. The first has to do with the impact of teachers’ and principals’ gender on students. In terms of education quality, there is little evidence that a teacher’s gender has an impact on student performance (Antecol, Eren and Ozbeklik, 2012[30]; Holmlund and Sund, 2006[31]). However, the gender balance of the teaching force has been shown to have an impact on students’ attitudes, career aspirations and achievements in some disciplines and contexts, through role model effects (Beilock et al., 2010[32]; Dee, 2005[33]). The effect of a teacher’s gender is particularly associated with the learning outcomes of female students (Lim and Meer, 2017[34]), which could be explained by differences in the way teachers interact with students of the same or opposite gender (Jones and Dindia, 2004[35]). The second aspect of gender balance relates to the degree of gender equity within the workforce and gender disparities in the career progression of teachers, as well as the scope for promotion to leadership positions. It is, thus, interesting to examine gender balance patterns in 2018 and how they have changed since 2008.
TALIS data show that in 2018, 68% of all teachers are female, on average across the OECD, and women make up more than half of the teaching workforce in all participating countries and economies, with the exception of Japan. The gender distribution of teachers is most imbalanced in Latvia, where about 90% of teachers are women, as well as in Israel, Italy and a number of other countries in the Balkans, Baltic region, Eastern Europe and Central Asia, where women make up more than 75% of teachers (Table I.3.17).3
TALIS data further suggest that gender patterns in the teaching profession are enduring, and change little over time for most countries and economies. However, the proportion of female teachers has grown in Croatia, Japan and Romania since 2013, as well as in Australia4, Austria, Iceland, Malta, Mexico, Norway, Portugal and Spain since 2008, with the share of female teachers rising by at least 2 percentage points. By contrast, the gender distribution of teachers has become more balanced in Finland since 2013, as well as in Brazil and Bulgaria since 2008 (Figure I.3.4, Table I.3.20).
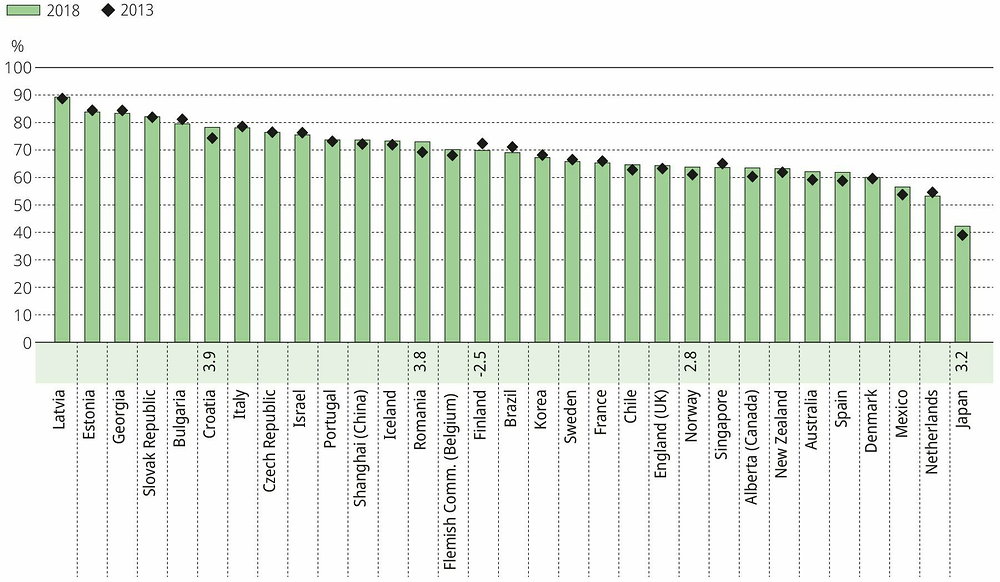
Notes: Only countries and economies with available data for 2013 and 2018 are shown.
Statistically significant changes between 2013 and 2018 (TALIS 2018 – TALIS 2013) are found next to the category and the country/economy name (see Annex B).
Countries and economies are ranked in descending order of the average proportion of lower secondary female teachers.
Source: OECD, TALIS 2018 Database, Table I.3.20.
Women are a majority in the teaching profession in all countries and economies participating in TALIS except Japan, but they are a minority among school principals in around half of the participating countries and economies (Figure I.3.5). In 2018, on average across the OECD, only 47% of principals are women, compared to 68% of teachers. This suggests significant gender imbalances in the promotion of female teachers to leadership positions, particularly for countries and economies that are most distant from the equal feminisation line5 in Figure I.3.5. It is important to acknowledge, however, that the cause for this pattern can be endogenous, with a lesser propensity of women to apply for leadership positions, as much as exogenous, with a lesser propensity for women to be selected when applying for leadership positions (Table I.3.21). Box I.3.2 describes how policy can help reduce gender imbalances among principals.
In a number of countries, often those where women strongly outnumber men among teachers, more than 60% of principals are female. This is the case in Brazil, Bulgaria, CABA (Argentina), Georgia, Hungary, Iceland, Italy, Latvia, Romania, the Russian Federation, the Slovak Republic, Slovenia and Sweden. By contrast, female principals are the exception in Japan and Turkey, where they make up less than 10% of the principal population, and they are also scarce in Alberta (Canada), Korea, South Africa and Viet Nam, at less than 30% of the total (Table I.3.21).
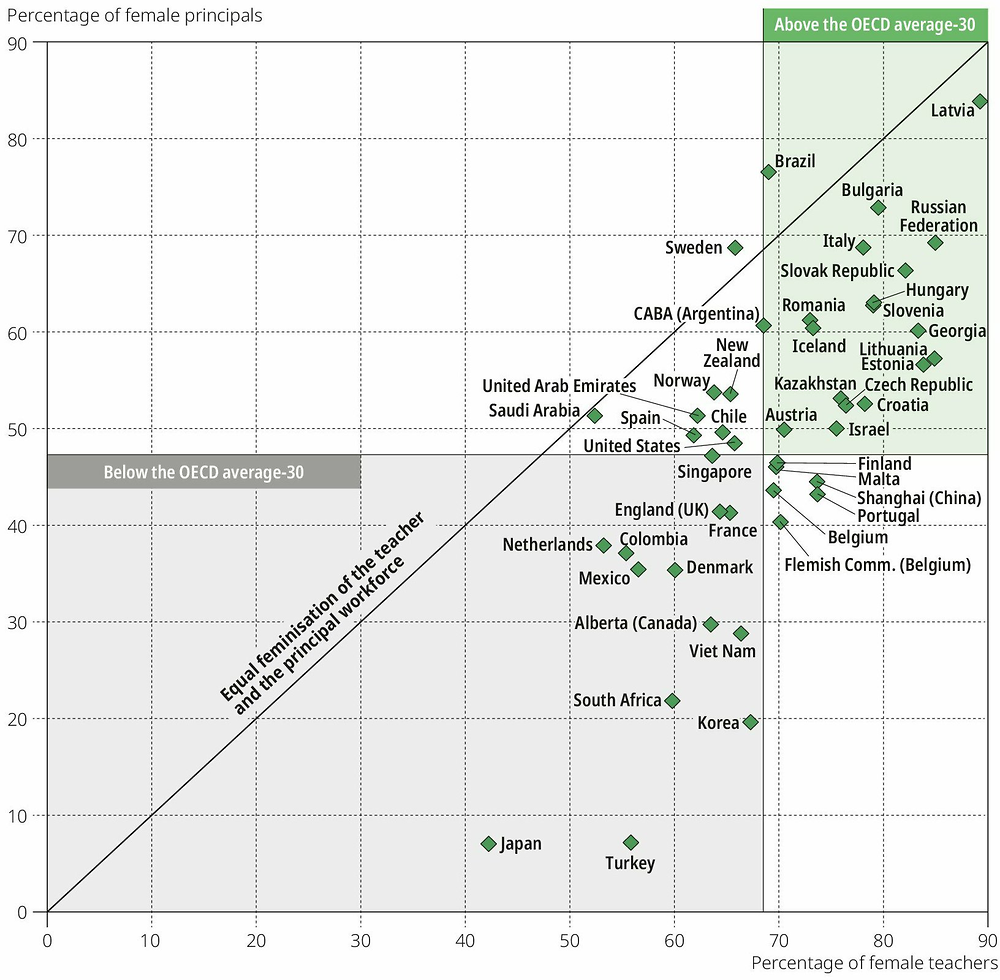
Notes: Only countries and economies with available data for the percentage of female teachers and the percentage of female principals are shown.
The OECD average-30 includes all TALIS 2018 OECD countries, except for Australia.
Source: OECD, TALIS 2018 Database, Tables I.3.17 and I.3.21.
As a part of Austria’s Federal Equal Treatment Act, the government has included a comprehensive set of provisions to improve opportunities for women for promotion and leadership positions in public sector jobs. Under the act, each federal department is required to issue a Women’s Promotion Plan based on the proportion of women in the total number of permanent employees in that department (updated every two years). The plan specifies the personnel, organisational and further training measures through which the existing under-representation of women in the department can be eliminated. These include measures such as priority in career advancement policy to select female candidates among equally skilled candidates and priority in education and training that enables women to take up roles involving higher functions and advanced skills.
Source: Federal Ministry for Digital and Economic Affairs, Austria (2019[36]), Bundesrecht konsolidiert: Gesamte Rechtsvorschrift für Bundes-Gleichbehandlungsgesetz, Fassung vom 22.03.2019, www.ris.bka.gv.at/GeltendeFassung. wxe?Abfrage=Bundesnormen&Gesetzesnummer=10008858.
Changes over time in the gender profiles of principals reveal that a few countries have experienced substantial increases in the proportion of female principals in recent years, reversing the under-representation of females among principals compared to their share of the teacher population. The share of female principals has surged by more than 10 percentage points in Italy and Sweden6 since 2013, and in Austria7 (Box I.3.2), Hungary and Norway8 since 2008 (Table I.3.24).
The average age of teachers increases gradually with the level of education they teach. In 7 out of 13 countries and economies with available data for ISCED 1 and 2, primary teachers are at least one year younger than their lower secondary counterparts, with the largest difference of three years in Korea (Table I.3.2). At the upper secondary level, teachers are, on average, older by at least one year in 8 out of 11 countries and economies with available data for ISCED 2 and 3 (Table I.3.3). This tendency is found in most OECD countries (OECD, 2018[15]) and reflects the teachers’ recruitment and retirement cycle (Lim, 2013[23]). The opposite pattern is observed only in Viet Nam, where 40 is the average age for primary teachers, 39 for lower secondary teachers, and 38 for upper secondary teachers. In contrast, there are almost no significant differences in the age distribution of principals across levels of education. One striking exception is France, where primary principals are six years younger, on average, than lower secondary principals (Tables I.3.5 and I.3.6).
The highest proportions of female teachers are concentrated in the lower levels of education, and the share shrinks at each successive level. At the primary level, female teachers are a majority in all 13 countries and economies with available data for ISCED 1 and 2. The proportion of women among primary teachers is at least 15 percentage points higher than in lower secondary education in CABA (Argentina), England (United Kingdom), Japan and Sweden, and at least 20 percentage points higher in France and the United Arab Emirates (Table I.3.18). The gender profile of upper secondary teachers is much more balanced than that of lower secondary teachers, with a proportion of female teachers at least 4 percentage points lower in all 11 countries and economies with available data for ISCED 2 and 3, and at least 10 percentage points lower in Brazil, Croatia and Sweden (Table I.3.19).
The gender distribution of principals mirrors the gender distribution of teachers. At the primary level, more than 50% of principals are women in 7 of the 13 countries and economies with available data for ISCED 1 and 2, but this only holds true for 3 of the 13 countries at lower secondary levels of education (Table I.3.22). The gender profile of upper secondary principals is similar to that of lower secondary principals in most of the 11 countries and economies with available data for ISCED 2 and 3, except in Sweden, where men are more represented among upper secondary principals than among lower secondary principals (Table I.3.23).
Changing contexts for teaching and learning
Several aspects of diversity in schools and classrooms help to understand the key features of teachers’ working conditions and the context in which teaching and learning currently take place in schools. The diversity of student backgrounds encompasses many dimensions, including cultural background, language spoken at home, socio-economic background, ability level and learning needs, as well as gender. Such information is of interest from a descriptive perspective, but also because of the relationship between school composition and other factors, such as student outcomes (OECD, 2013[37]; OECD, 2015[38]; Sirin, 2005[39]) or teaching processes (Echazarra et al., 2016[40]).
Analyses of PISA data show that a school’s socio-economic background and student intake matter for student performance and that students, regardless of their own socio-economic background, are advantaged scholastically if they attend a school whose students are from more advantaged socio-economic backgrounds (OECD, 2004, p. 189[41]; OECD, 2013[37]), although the strength of this advantage varies across countries. Likewise, data from the 2013 TALIS-PISA link show that the use and impact of effective teaching practices vary depending on school composition (Le Donné, Fraser and Bousquet, 2016[42]). Evidence from PISA also shows that students from immigrant backgrounds who are culturally and ethnically different from other students in their country of schooling perform less well academically and that these cultural differences also relate to their psychological and social well-being at school (OECD, 2015[38]).9 Furthermore, the way teachers perceive multicultural learning environments shapes, in turn, the effectiveness of their teaching (Stanovich and Jordan, 1998[43]).10 These findings have heightened interest in the composition of schools’ intakes and how they relate to the characteristics of teachers, the pedagogical approaches that teachers implement in their classrooms (Echazarra et al., 2016[40]) and the broader policies on diversity adopted in the school.
TALIS provides a unique opportunity to investigate these issues, as it asks principals and teachers about the composition of the student body in their school/classroom in terms of special needs, socio-economic disadvantage, immigrant background, language background and refugee status of students. These measures differ from those used in PISA studies (see Box I.3.4) and provide more direct context on how teachers and principals perceive the profile of their students. This provides important context for examining teachers’ work, school practices related to diversity and teachers’ preparedness and confidence to teach in diverse environments.
PISA measures of school composition rely upon information collected through student questionnaires administered to a random sample of 30 students in each PISA school and aggregates at the school level of students’ responses on their gender, migration background and index of economic, social and cultural status (ESCS). The school socio-economic composition in PISA is the mean value of the ESCS index of students in the school (OECD, 2016[44]).
TALIS relies upon the perspectives of teachers and school leaders on the composition of their school and of teachers on the composition of a randomly selected target class. It asks teachers and school leaders about the share of students with different profiles at the classroom level (this is unique to TALIS) and at the school level.
In TALIS, the approach is different, as it is based on the perceptions of teachers and school leaders. This is more subjective, but it is also more complete than the PISA measures, as principals describe the entire school composition and teachers refer to their entire target classroom (not just a random sample of students), and TALIS uniquely provides information on classroom composition as perceived by teachers. The two approaches provide complementary perspectives on actual school composition. But because TALIS measures reflect the subjective perceptions of teachers and school leaders, it can be argued that they are more likely to be related to teachers’ practices (Gay, 2014[45]; Kielly et al., 2014[46]; Lucas, Villegas and Martin, 2014[47]) and to school policies put in place by principals.
School and classroom composition
A substantial body of research has investigated the impact on student achievement of school and classroom context, conceptualised either as the social composition of the school and classroom or as the neighbourhood in which the school is located (OECD, 2013[37]; OECD, 2015[38]; Sirin, 2005[39]). There is much debate on the extent to which school composition has an effect on student learning outcomes, after controlling for individual student characteristics (Banting and Kymlicka, 2004[48]; Borman and Dowling, 2010[49]; Firmino et al., 2018[50]; Willms, 2010[51]). But school composition remains relevant for policy makers, to better understand the profile of the students that schools and teachers serve and how it has changed over time, so they can provide adequate support and training to schools and teachers.
TALIS asks school principals and teachers to estimate the broad percentage (none, 1% to 10%, 11% to 30%, 31% to 60%, more than 60%) of certain types of students in their school (for principals) and in their target class (for teachers): “students with special needs”; “students from socio-economically disadvantaged homes”; “students who are immigrants or with a migrant background” (hereafter referred to as “students with a migrant background”); “students whose first language is different from the language of instruction or from a dialect of this/these language(s)” (hereafter referred to as “students whose first language is different from the language(s) of instruction”); and “students who are refugees”. An international cut-off value is set for each student characteristic, in order to group the percentage categories in a relevant manner.11
As some of these questions were asked in previous cycles of the survey in 2008 and 2013, TALIS 2018 makes it possible to assess the degree to which learning environments have changed in terms of school and classroom composition. But TALIS 2018 tackles topics that have emerged since the last cycle. In particular, it more closely examines students with a migrant or refugee background, as their education is currently a priority for many countries in the context of the global refugee crisis (OECD, 2015[38]; OECD, 2018[52]).
In 2018, working with quite diverse student populations is no longer exceptional and is part of the reality for a number of teachers. Depending on which aspect of diversity is considered, 17% to 31% of teachers on average across the OECD work in schools with a diverse student composition as reported by school principals, and since it is unlikely that the same schools concentrate all forms of diversity at the same time, the proportion of teachers actually working with diverse students is likely much higher (Figure I.3.6 and Table I.3.25). More specifically, the share of teachers working with these types of students is as follows:
-
31% in schools with at least 10% of students with special needs (i.e. those for whom a special learning need has been formally identified because they are mentally, physically, or emotionally disadvantaged)
-
30% in schools with at least 1% of refugee students (i.e. those who, regardless of legal status, fled to another country seeking refuge from war, political oppression, religious persecution, or a natural disaster)
-
21% in schools with at least 10% of students whose first language is different from the language(s) of instruction or from a dialect of this (these) language(s)
-
20% in schools with at least 30% of socio-economically disadvantaged students (i.e. those whose homes lack the basic necessities or advantages of life, such as adequate housing, nutrition or medical care)
-
17% in schools with at least 10% of students with a migrant background (i.e. those born outside the country or whose parents were both born outside the country).
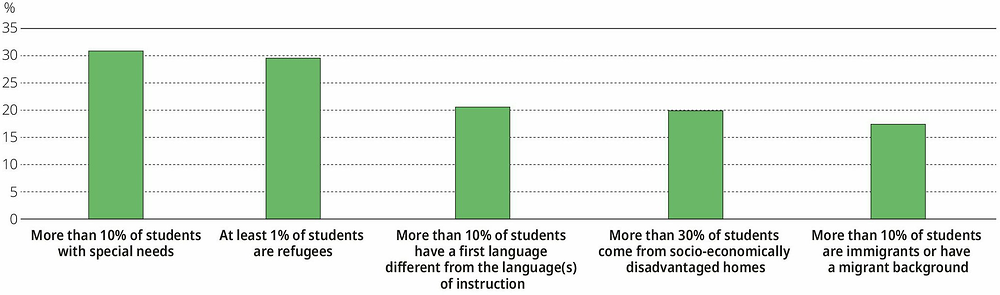
Values are ranked in descending order of the percentage of lower secondary teachers teaching in schools with the following composition.
Source: OECD, TALIS 2018 Database, Table I.3.25.
However, these averages reflect very different patterns and realities across countries. More than 40% of teachers in Brazil, Chile, Colombia, France, Mexico, Portugal, South Africa and the United States work in schools with over 30% of socio-economically disadvantaged students, according to principals. This pattern may signal either high levels of poverty/inequality in these countries and/or high degrees of social segregation in their education systems. By contrast, less than 3% of teachers work in schools with over 30% of socio-economically disadvantaged students in the Czech Republic, Iceland, Malta, and the Russian Federation, suggesting either lower levels of poverty/inequality or lower levels of social segregation in those systems (Table I.3.25). Teachers’ reports on the socio-economic composition of their target class confirm these patterns (Table I.3.28).
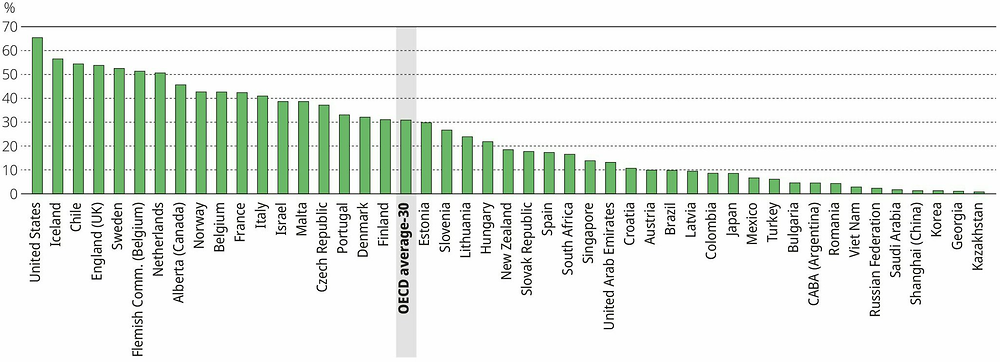
With respect to students with special needs, their access to formal education has improved around the world, as a number of international initiatives12 have acknowledged the rights of children with disabilities to be included in the general education system and receive appropriate instructional support (Cooc, 2018[53]; Peters, 2007[54]; Winzer and Mazurek, 2014[55]; United Nations, 2015[56]). Accordingly, students with special needs are increasingly enrolled in mainstream schools, although the extent to which this is the case varies across countries (Cooc, 2018[53]). In 2018, more than 50% of teachers in Chile, England (United Kingdom), the Flemish Community of Belgium, Iceland, the Netherlands, Sweden and the United States work in schools with at least 10% of special needs students, according to principals (Figure I.3.7, Table I.3.25). The high concentration of special needs students in these countries is confirmed by teachers’ reports (Table I.3.28). At the other end of the spectrum, less than 5% of teachers work in schools with a large proportion of special needs students in Georgia, Kazakhstan, Korea, Romania, the Russian Federation, Saudi Arabia, Shanghai (China) and Viet Nam. There are many causes for these wide differences across countries. They could reflect different conceptions of special needs across countries and the extent of “labelling” and formal identification of special needs students, differences in the inclusiveness of education systems and the enrolment of special needs students in regular schools, as well as possible segregation effects (e.g. if only a subset of schools is equipped and staffed to serve them) (Figure I.3.7, Table I.3.25).
Another major societal development in past decades is the growing integration of world economies and societies and associated labour mobility across countries (OECD, 2015[38]; OECD, 2018[52]; OECD, 2019[2]). In some regions, such as the European Union, this phenomenon has been facilitated by regional integration. In other parts of the world, more traditional drivers of economic migration, family reunion and skilled migration have been at play. But a more recent issue has been the rapid surge of refugee flows (OECD, 2018[52]), fuelling yet another type of population movement. With migration on the rise in many parts of the world, the children of immigrants are enrolled in the school systems of their host countries, often requiring specific support from their schools and teachers (OECD, 2015[38]). It is, thus, interesting to examine how much of a reality this phenomenon is in the countries and economies participating in TALIS.
← 1. “Students with special needs” are those for whom a special learning need has been formally identified because they are mentally, physically, or emotionally disadvantaged.
Countries and economies are ranked in descending order of the percentage of teachers teaching in schools where more than 10% of students have special needs.
Source: OECD, TALIS 2018 Database, Table I.3.25.
The largest proportions of teachers working in schools with more than 10% of students with a migrant background13 are found in Alberta (Canada), Austria, Belgium (and in the Flemish Community), CABA (Argentina), Italy, Singapore and Sweden, where more than a third of teachers work in such schools, according to their principals (Table I.3.25). Teachers’ reports on the composition of their target class confirm this pattern, with diversity related to students with a migrant background highest in Alberta (Canada), Australia, Austria, Belgium, CABA (Argentina), Sweden and the United Arab Emirates (Table I.3.28). However, just like the socio-economic composition of schools and classrooms, it is not possible to disentangle whether these patterns reflect large migration inflows or patterns of school segregation, where students with a migrant background are concentrated in some neighbourhoods and the schools located there (OECD, 2015[38]; OECD, 2018[57]). At the other end of the spectrum, countries and economies with traditionally low migration inflows have 1% or less teachers working in schools with large proportions of students with a migrant background: Bulgaria, Croatia, the Czech Republic, Estonia, Hungary, Japan, Korea, Lithuania, Romania, Shanghai (China), the Slovak Republic and Viet Nam (Table I.3.25).
Linguistic diversity is a phenomenon related to migration flows. But it can also exist due to the presence of linguistic or indigenous minorities in a country. On average across the OECD in 2018, 21% of teachers work in schools with more than 10% of students whose native language is different from the language of instruction, according to principals (Table I.3.25), and 18% of teachers report having more than 10% of students whose first language is different from the language(s) of instruction in their target class (Table I.3.28). However, this phenomenon is not universally shared across participating countries and economies (Figure I.3.8). In Singapore, nearly 82% of teachers work in schools with at least 10% of students whose first language is different from the language(s) of instruction, according to their principals, and this is also the case for over 40% of teachers in Alberta (Canada), Austria, Bulgaria, England (United Kingdom), the Flemish Community of Belgium, South Africa, Sweden and the United Arab Emirates. The Singaporean pattern is not surprising, given the multicultural and multilingual make-up of the island state’s population and the fact that English was chosen as the language of instruction over the official ethnic languages (Mandarin, Malay and Tamil) (Chua, 2010[58]). Likewise, the other countries above also have large populations of linguistic minorities, immigrants or expatriate workers. At the other end of the spectrum, some education systems face very little linguistic diversity, with less than 5% of teachers working in schools with more than 10% of students whose first language is different from the language(s) of instruction in Brazil, Chile, Colombia, the Czech Republic, Hungary, Japan, Korea, Mexico, Saudi Arabia and Shanghai (China), where the populations are linguistically more homogenous (Table I.3.25).
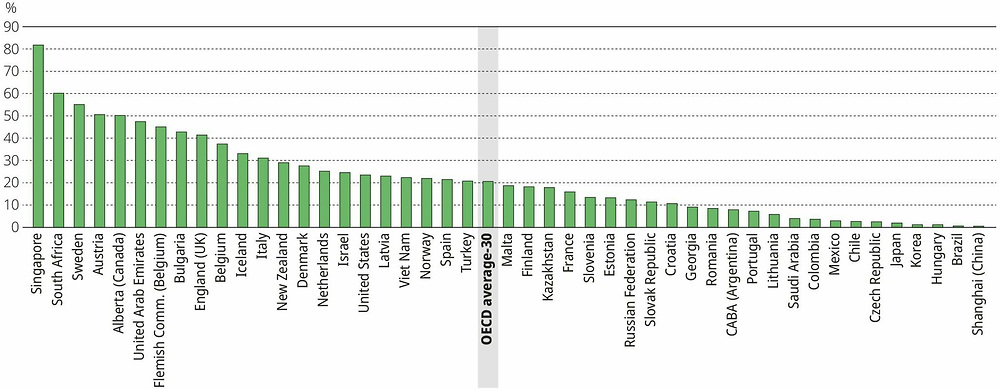
Countries and economies are ranked in descending order of the percentage of teachers teaching in schools with more than 10% students whose first language is different from the language(s) of instruction.
Source: OECD, TALIS 2018 Database, Table I.3.25.
TALIS makes it possible to examine the extent to which the 2015-16 refugee crisis is visible in schools across participating countries and economies. As the question on this subject is new to TALIS 2018, it is not possible to analyse change over time. But the 2018 school composition with respect to refugee students provides an indication of the share of teachers directly exposed to refugee students, and presumably some of these refugee students are a result of the refugee crisis. Refugee students often come with a personal history of forced relocation and trauma that requires specific support from the school and its community (Graham, Minhas and Paxton, 2016[59]; Hart, 2009[60]; Taylor and Sidhu, 2012[61]). In nearly half of the participating countries and economies, at least 25% of teachers work in a school with at least 1% of refugee students, according to principals. This is the case for more than 50% of teachers in Austria, Belgium (and the Flemish Community), Denmark, England (United Kingdom), Finland, the Netherlands, Norway and Sweden. By contrast, less than 1% of teachers are working in such schools in Japan, Kazakhstan, Latvia, Romania, Shanghai (China), Singapore and the Slovak Republic, where, according to principals, there are almost no refugees (Table I.3.25).
On these various aspects of school composition, teachers’ perceptions on the composition of their target class are generally consistent with the views of their principals on the composition of the entire school, although teachers tend to report less diversity than principals. In the case of Australia, the insufficient response rate for school principals does not allow examination of school composition, but teachers’ reports on the composition of their target class suggest that the percentage of teachers working with diverse students is slightly above the OECD average for students from disadvantaged backgrounds and with special needs, about 10 percentage points above the OECD average for students whose home language is different from the language(s) of instruction, and close to 20 percentage points above the OECD average when it comes to students with a migrant background and refugee students (Table I.3.28).
Changes in school composition over time provide a good indication of how much the learning environments have transformed in recent years. TALIS data make it possible to explore this through principals’ reports on their school composition in terms of students from disadvantaged homes, students with special needs and students whose first language is different from the language(s) of instruction.14 It is not possible to do such analysis for students with a migrant background or for refugee students, as these questions are new to TALIS 2018. But changes in linguistic diversity over time provide a good indication of how much the learning environments for teachers have changed in terms of dealing with more linguistically diverse students, irrespective of the underlying cause of this diversity.15
One group of countries and economies participating in TALIS experienced a rise in linguistic diversity, with a significant increase in the proportion of teachers who work in schools with more than 10% of students whose first language is different from the language(s) of instruction. This is the case in Austria, the Flemish Community of Belgium and Iceland since 2008, and in Bulgaria, England (United Kingdom), Finland, Portugal and Sweden since 2013. This suggests patterns in these countries of either growing international migration and/or refugee inflows, greater ethnic or linguistic grouping of students, or lag effects from differential birth rates of different linguistic communities that change the linguistic make-up of society (Table I.3.29). By contrast, another group of countries and economies experienced a reverse pattern, with a decrease in the share of teachers working in schools that are very diverse linguistically in Brazil, Korea, Lithuania, Mexico, the Slovak Republic, Slovenia and Spain since 2008, and in Singapore since 2013 (Table I.3.29).
With respect to socio-economic diversity; several education systems have experienced a decline since 2013 in the share of teachers working in schools with more than 30% of students from socio-economically disadvantaged homes: Estonia, Israel, Latvia, Shanghai (China) and the Slovak Republic. This may result from a decline in poverty and social inequalities among students in these countries and economies or a rise in school social inclusion. Denmark and Sweden experienced the opposite pattern (Table I.3.30).
As for diversity in terms of educational needs, the share of teachers working in schools with more than 10% of students with special needs has increased in six countries since 2013: Brazil, Chile, the Czech Republic, Italy, Portugal and Singapore. This could result from a greater propensity to identify and detect students with special needs and to implement school policies and practices catering to these students, or changes in how these students are grouped across schools. In three other systems, the share of schools with more than 10% of students with special needs has substantially decreased: England (United Kingdom), Korea and Sweden (Table I.3.31).
Student diversity presents mixed patterns
The levels of student diversity in schools, be it socio-economic, cultural, linguistic or based on educational needs, present mixed patterns across all three levels of education and all countries. Negative, positive and non-significant differences between the primary and lower secondary levels are found among the 13 countries and economies with available data for ISCED 1 and 2. However, upper secondary teachers tend to work in less diverse schools than lower secondary teachers in 2 to 5 out of 10 countries and economies with available data for ISCED 2 and 3, depending on the particular dimension of student diversity examined (Tables I.3.26 and I.3.27).
However, the largest difference in the school composition of primary and lower secondary schools is found with the proportion of refugee students at school. In 6 out of 13 countries and economies with available data for ISCED 1 and 2, the percentage of teachers teaching in schools with at least 1% of refugees is lower in primary schools than in lower secondary schools, with the largest differences in England (United Kingdom) (24 percentage points) and France (22 percentage points).
Compared to the lower secondary level, at the upper secondary level, in 5 out of 10 countries and economies with available data for ISCED 2 and 3, fewer teachers teach in schools that enrol at least 10% of special needs students, with the largest differences in Portugal and Sweden.
School diversity policies and practices differ slightly across levels of education
Primary teachers tend to report more often than lower secondary teachers that their school implements practices addressing student cultural diversity. Across several countries among the 13 countries and economies with available data for ISCED 1 and 2, more primary schools tend to implement the following practices: organising multicultural events, teaching how to deal with ethnic and cultural discrimination, and adopting teaching and learning practices that integrate global issues throughout the curriculum (Table I.3.36). The largest gaps between primary and lower secondary schools in the prevalence of these three school practices are found in Korea. In contrast, in France and Denmark, some diversity-related practices are more frequent in lower secondary schools than in primary schools.
Differences between the lower and upper secondary levels are generally smaller (Table I.3.37). However, in 5 out of 11 countries and economies with available data for ISCED 2 and 3, teaching how to deal with ethnic and cultural discrimination is less frequent in upper secondary schools than in lower secondary schools, with the largest differences in Denmark and Slovenia.
Principals tend to report higher levels of policies and practices related to diversity at their schools than teachers, and the respective proportions tend to be similar across all three levels of education (Tables I.3.36 and I.3.37).
Attitudes of school staff towards student diversity
In the context of rising migration worldwide and the growing integration of world economies and labour markets, many societies have become more globalised and multicultural (OECD, 2018[52]; OECD, 2019[2]). This new reality and the challenges and opportunities it entails have prompted academic and policy interest on how education systems manage to integrate populations with a high proportion of students from migrant backgrounds (Alsubaie, 2015[62]; Bowen and Salsman, 1979[63]; Jackson and Boutte, 2018[64]; OECD, 2012[65]; OECD, 2015[38]; OECD, 2018[57]).
School responses to student diversity take multiple forms, varying greatly in prevalence across participating countries and economies, depending on the type of diversity issue. A key aspect of school responses to student diversity derives from the attitudes of staff and their beliefs in relation to equity and diversity. Research has shown that asking sensitive questions directly can result in significant proportions of respondents16 hiding their true sentiments due to social desirability pressures (Janus, 2010[66]). To overcome this issue, one approach used by survey methodologists is to ask sensitive issues indirectly. Thus, TALIS asks principals to estimate approximately what proportion of teachers in their school (“none or almost none”; “some”; “many”; or “all or almost all”) would agree with a series of statements related to equity and cultural diversity. The responses of principals show that their teachers share very inclusive and positive views on equity and diversity.
With respect to equity beliefs, the importance of treating male and female students equally is a belief almost universally shared by teachers, according to their principals: 98% of principals on average across OECD countries and economies report that “many” or “all or almost all” teachers in their school find this important in 2018. The same holds for treating students from all socio-economic backgrounds in the same manner: 97% of principals so report across the OECD. There is not the same consensus that students should be taught how to avoid gender discrimination, with 93% of principals reporting agreement among their teachers on average, and less than 90% in 10 countries and economies. There is also less consensus on the belief that schools should encourage students from different socio-economic backgrounds to work together, with 92% of principals reporting agreement among their teachers on average, and less than 90% in 17 countries and economies (Table I.3.32).
As far as cultural diversity beliefs are concerned, the conviction that children and young people should learn that people of different cultures have a lot in common is the most widely shared belief among teachers, according to their school leaders (95% of them so report in 2018). The belief that respecting other cultures is something that children and young people should learn as early as possible comes next (94% of principals reporting agreement among their staff). On average across the OECD, 92% of principals also report agreement among their teachers that it is important for students to learn that people from other cultures can have different values, and 91% of principals report that teachers find it important to be responsive to differences in students’ cultural backgrounds. However, less than 90% of principals report agreement of their teachers with cultural diversity beliefs in the Czech Republic, Saudi Arabia and Shanghai (China) for all four diversity beliefs, in Alberta (Canada)17, Belgium (and the Flemish Community) and the Slovak Republic for three diversity beliefs, and in Austria, France, Hungary, Japan, Kazakhstan, Romania, South Africa and Turkey for two diversity beliefs (Table I.3.33).
One of the critical challenges facing Kazakhstan’s education system is the high number of students from socio-economically disadvantaged backgrounds who are at risk of dropping out of school. For almost a decade, Kazakhstan has been deploying significant efforts to integrate these students from socio-economically disadvantaged backgrounds into its education system through a systemic approach. Kazakhstan’s Care programme involves both investing financial resources and using teachers as social actors to bring these students to school. Teachers do community visits with households to identify students who are out of school or have been absent for more than ten days without a valid reason. Teachers interact with these students and their families to identify the barriers preventing them from coming to school regularly and provide assistance to them in coming back to school. In addition to the role of teachers, the Care programme focuses on providing material support in the form of uniforms, stationery, textbooks, etc. The programme has supported more than 1.1 million disadvantaged students since 2010. The focus on supporting students from low socio-economic backgrounds remains a priority in education policy for the government of Kazakhstan. Overall, socio-economic background has a weaker influence on student outcomes in Kazakhstan than in other OECD countries, as indicated by PISA results.
Source: OECD (2018[70]), Education Policy Outlook: Kazakhstan, www.oecd.org/education/Education-Policy-Outlook-Country-Profile-Kazakhstan-2018.pdf.
In 2018, a range of equity-related policies and practices are implemented in schools, according to their principals, to address gender and socio-economic equity issues (Figure I.3.9). The most common practice is teaching students to be inclusive of different socio-economic backgrounds (implemented in 93% of schools in 2018, on average across the OECD). The provision of additional support for students from disadvantaged backgrounds and explicit policies against gender discrimination come next (80% each), followed by explicit policies against socio-economic discrimination (75%). It is noteworthy that, at a time when there is growing awareness of the importance of educating youngsters to respect women at the earliest ages (Simmonds, 2017[67]; UNESCO, 2018[68]), 20% of lower secondary schools in the OECD do not have explicit policies to fight gender discrimination. Likewise, at a time of growing social inequalities in most OECD countries (OECD, 2018[69]), only 75% of schools have policies combating socio-economic discrimination (Table I.3.34). Box I.3.6 describes some of the initiatives undertaken in Kazakhstan to support the needs of students from disadvantaged backgrounds.
Differences exist across participating countries and economies in the prevalence of these equity-related policies and practices. Teaching students to be inclusive of different socio-economic backgrounds is implemented in at least 95% of schools in almost half of participating countries and economies, but in less than 85% of schools in Denmark, Japan, the Slovak Republic, Sweden and Viet Nam. Interestingly, the education systems where this practice is least used are countries with less socio-economic inequality,18 which may signal that this practice is less necessary. The provision of additional support for students from disadvantaged backgrounds is also a widespread practice, implemented by at least 80% of schools in about 80% of participating countries and economies. But, again, it is least used in Finland and Norway, as well as in Sweden. In the case of Sweden, the practice is to support challenging schools and neighbourhoods rather than students within schools, in order to pursue equity objectives while avoiding stigmatisation. There is much more variation across systems in the prevalence of explicit policies against gender and socio-economic discrimination. The percentage of schools implementing such policies ranges from 45% in the Flemish Community of Belgium, to over 95% in the Czech Republic, Finland and Korea for gender discrimination, and from 39% in New Zealand to over 95% in the Czech Republic and Lithuania for socio-economic discrimination (Table I.3.34).19
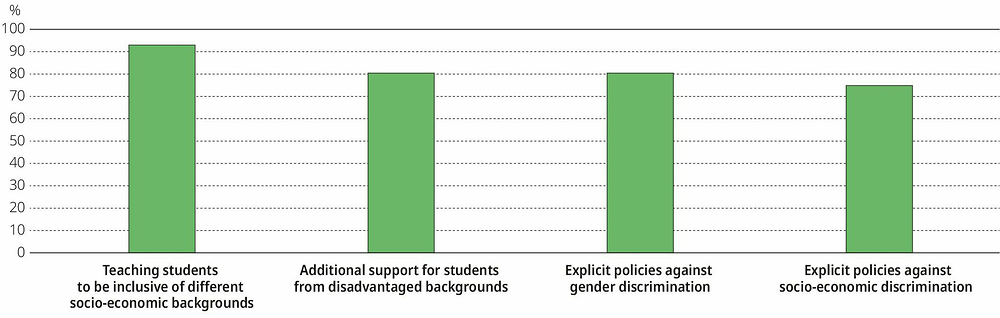
Values are ranked in descending order of the prevalence of equity-related school practices.
Source: OECD, TALIS 2018 Database, Table I.3.34.
For diversity-related school policies and practices, the previous section has shown the wide variation across participating countries and economies in the prevalence of multicultural diversity in the composition of schools. There is also variation in the degree to which schools have adopted specific policies and practices related to multicultural diversity and the nature of these policies and practices at the school level. The examination of these policies and practices is restricted to the sample of teachers who reported that students from more than one cultural or ethnic background are enrolled in their school (around 70% of the sample of teachers across all participating countries and economies and on average across the OECD20). For the sake of simplicity, these schools are referred to as “multicultural schools”.
An important consideration in reviewing school policies and practices related to multicultural diversity is the social context in which they take place. The dominant paradigm in research on cultural diversity identifies two main ideological approaches and perspectives of countries’ policies: equity and multiculturalism (Ely and Thomas, 2001[71]). The equity approach emphasises fostering equality and inclusion and valuing diversity. In education, it is often referred to as a colour-blind approach that regards all children in a class as equals, avoids discrimination and treats all students fairly, with the goal of creating and maintaining homogeneity (Schachner et al., 2016[72]). Some argue that, in practice, this homogeneity often implicitly refers to the dominant culture of a country, and tends to be associated with assimilationist ideological models (Plaut, Thomas and Goren, 2009[73]). By contrast, the multiculturalism approach is based on the premise that diversity can enrich the school and promote respect for and knowledge of other cultures and the enhancement of intercultural skills. Accordingly, it acknowledges and recognises expressions of diversity. Although the two policy streams of equity and multiculturalism may seem at odds, empirical studies show that schools often combine components of both (Schachner et al., 2016[72]).
In 2018, TALIS examines school policies and practices in relation to cultural diversity for the first time. On average across the OECD, the most common policies and practices related to diversity, according to principals, are those embedded in the teaching process: 80% of teachers working in multicultural schools – that is, schools with more than one cultural or ethnic background among students – do so in a school that has integrated global issues throughout the curriculum, and an equal proportion of 80% work in a school that teaches how to deal with ethnic and cultural discrimination (Figure I.3.10). Policies and practices promoting diverse cultures are less common: only 61% of teachers working in multicultural schools do so in a school that supports activities or organisations encouraging students’ expression of diverse ethnic and cultural identities, and 55% work in a school that organises multicultural events. Box I.3.7 describes some of the initiatives undertaken in Austria to support the needs of multicultural schools and their teachers.
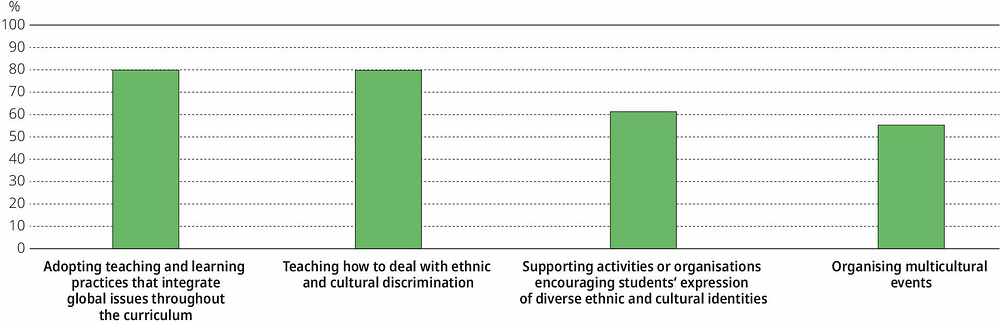
← 1. Data based on principals’ views. Principals’ responses were merged with teacher data, and weighted using teacher final weights. Values are ranked in descending order of the prevalence of diversity-related school practices.
Source: OECD, TALIS 2018 Database, Table I.3.35.
It is interesting to examine teachers’ perspectives on school policies and practices related to multicultural diversity, as they are based on the perceptions of the actors on the frontline of classrooms. They show the wide variation across countries and economies in the prevalence of school policies and practices related to diversity, even when the analysis is limited to teachers working in multicultural schools.
According to teachers’ views, the education systems where global issues are most systematically integrated into the curriculum of multicultural schools (with over 85% of teachers in multicultural schools so reporting) are Alberta (Canada), Austria, Brazil, Singapore, the United Arab Emirates and Viet Nam. Those where this practice is least common in multicultural schools are Iceland, Japan, Korea and Saudi Arabia. Teaching how to deal with ethnic and cultural discrimination is, according to teachers, most widespread in CABA (Argentina), Chile, Colombia, Singapore, Slovenia and Viet Nam, and least common in the multicultural schools of Denmark, Iceland, Japan, Norway and Turkey (Table I.3.35).
The last two diversity practices examined in TALIS are more illustrative of the multiculturalism approach. Supporting activities or organisations encouraging students’ expression of diverse ethnic and cultural identities is most common in Kazakhstan, New Zealand, Shanghai (China), Singapore, the United Arab Emirates and Viet Nam, and least widespread in Denmark, Finland,21 Japan, Norway and Sweden. Finally, the organisation of multicultural events is most prevalent in the multicultural schools of Kazakhstan, Shanghai (China), Singapore and the United Arab Emirates, and least common in the Czech Republic, Denmark, Japan, the Netherlands, Norway, Sweden and Turkey (Table I.3.35).
The education system in Austria is continuously adapting itself to cater to the needs of students from diverse ethnic and cultural backgrounds. In order to build teacher capacity, a nationwide course on home-language teaching, Teaching First Languages In The Context Of Migration, is offered to teachers as a four-semester course. Further, home-language teaching is organised in two ways in Austria, based on the number of students: teaching at a single school, when the number of students for a particular language is high, and grouping students from different schools together when the number from each school is low.
The Ministry of Education has also implemented a programme called Mobile Intercultural Teams that offers support to schools with a high proportion of immigrant students. These teams work with teachers, principals and administrators at these schools, offering advice based on teachers’ experiences in working with immigrant students, workshops on classroom climate, etc. The teams include educational psychologists who interact with teachers, principals, students and their parents, serving as a bridge between these stakeholders so that schools and teachers can best support students in their daily classroom instruction.
Source: European Commission/EACEA/Eurydice (2019[74]), “Integrating Students from Migrant Backgrounds into Schools in Europe: National Policies and Measures”, Eurydice Report, https://doi.org/10.2797/222073.
As for equity-related school policies and practices, the limited number of principals’ observations in each country does not allow regression analyses on the factors associated with diversity-related school policies and practices. Interestingly, at the system level, the proportion of teachers working in linguistically diverse schools, which can act as a proxy for schools’ cultural diversity, is unrelated to the share of schools with multicultural policies and practices as reported by principals (the linear correlation coefficient is close to 0).
Teachers’ readiness to teach in multicultural environments
With migration on the rise in many parts of the world (OECD, 2018[52]), the children of immigrants are enrolled in the schools of their host countries and a number of education systems have experienced an increase in the linguistic diversity of their students over the past decade. This phenomenon is not exclusively driven by migration flows, but it is strongly related to migration patterns and the countries of origin of immigrants and refugees. An implication of both migration/refugee flows and greater linguistic diversity in schools is that schools and teachers increasingly need to cater to multicultural student profiles.
In this context, a key issue for policy makers and school leaders is to understand teachers’ readiness to teach multicultural classes. Indeed, a recent international review of the integration of immigrant students acknowledged that handling cultural diversity in class is difficult and requires preparation. Often, students differ not only in the knowledge and skills they have acquired in their early years, but also in the strategies they use to approach and solve problems. De Abreu (2006[75]) argues that, in mathematics for instance, teachers who are not fully aware of cultural differences in approaches to mathematical problems or who play down cultural differences, arguing for general notions of ability and equity, are ill-equipped to build on their students’ knowledge and experience (OECD, 2015[38]).
Thus, it is important to examine how confident teachers feel about teaching a culturally diverse class. TALIS 2018 includes several questions on teaching in diverse environments for teachers who have previously taught a classroom with students from different cultures.22 In particular, TALIS asks teachers to report on their preparedness for teaching in a multicultural or multilingual setting. As discussed in Chapter 4, the vast majority of teachers did not feel ready for the challenge at the time they completed their teacher education. Indeed, more than 50% of teachers report that they were not well prepared to teach in a multicultural or multilingual setting in all participating countries except Shanghai (China), Singapore, South Africa and the United Arab Emirates (Table I.4.20 in Chapter 4).
TALIS also asks about teachers’ perceived need for professional development. As noted in Chapter 5, 15% of teachers report a high need for professional development in teaching in a multicultural or multilingual setting, and this need has become even more prominent in 2018. It is now the third-highest area of need for professional development reported by teachers, after teaching students with special needs and information and communication technology (ICT) skills for teaching (Table I.5.21 in Chapter 5).
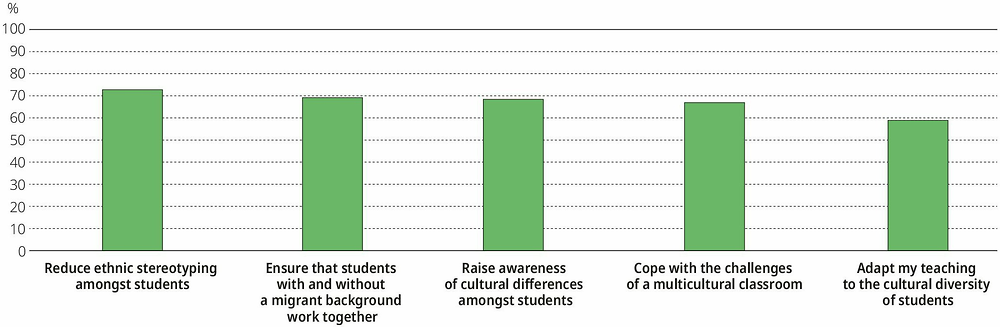
TALIS 2018 also asks teachers who have previously taught classrooms with students from different cultures a range of questions about their experience and self-efficacy teaching a culturally diverse class, and to what extent (“not at all”; “to some extent”; “quite a bit”; “a lot”) they can manage a number of aspects of teaching in multicultural contexts. Results show that, on average across the OECD:
-
Teachers’ self-efficacy in multicultural settings is highest with respect to reducing ethnic stereotyping among students, with
73% of teachers feeling that they can do this “quite a bit” or “a lot” (Figure I.3.11, Table I.3.38).
-
Ensuring that students with and without a migrant background work together comes next, with 69% of teachers reporting high levels of self-efficacy in this area.
-
68% of teachers report high levels of self-efficacy in raising awareness of cultural differences amongst students.
-
67% report high levels of self-efficacy in coping with the challenges of a multicultural classroom.
-
It is noteworthy that the proportion of teachers reporting high levels of self-efficacy drops to 59% when it comes to adapting their teaching to the cultural diversity of students, i.e. much lower than for aspects related to promoting positive relationships and interactions between students from different backgrounds (Figure I.3.11, Table I.3.38). This pattern mirrors the finding from Chapter 5 that teachers’ reported need for professional development is higher for teaching in a multicultural setting than for communicating with people from different cultures or countries (Table I.5.21 in Chapter 5).
← 1. The sample is restricted to teachers reporting that they have already taught a class with students from different cultures.
Values are ranked in descending order of the percentage of teachers reporting that they feel they can do the following “quite a bit” or “a lot” in teaching a culturally diverse class.
Source: OECD, TALIS 2018 Database, Table I.3.38.
The examination of country-specific patterns of self-efficacy in multicultural settings reveals interesting regional and cultural patterns. With respect to adapting teaching to the cultural diversity of students, at least 90% of teachers report high self-efficacy in Colombia, Portugal and the United Arab Emirates, but this is the case for less than half of teachers in Estonia, Finland, Japan, Korea, the Netherlands, Norway and Slovenia. When examining all aspects of self-efficacy in multicultural settings, teachers tend to display high levels of multicultural self-efficacy in Latin American and Middle Eastern countries and in Portugal, but lower levels of self-efficacy in multicultural settings in Asian and Nordic countries (Table I.3.38). One has to keep in mind, however, that TALIS captures teachers’ perceptions that are subjective and may be subject to cultural bias, particularly for self-evaluative questions such as self-efficacy (He and Kubacka, 2015[76]). Therefore, comparisons across countries and economies need to be interpreted with caution.23
On average across OECD countries and economies, teachers tend to feel more confident in their ability to teach a class with students from different cultures when their class actually includes higher shares of immigrant students and students whose first language is different from the language(s) of instruction (more than 10% of these students versus 0% to 10%). Teachers’ ability to teach multicultural classes is positively related with one or both of these measures of classroom composition in about two-thirds of the countries and economies participating in TALIS (Table I.3.41). There is a range of possible explanations for this finding. Assuming that classes do not become culturally diverse overnight, this finding may suggest a pattern of learning by doing, whereby past experience in teaching in a multicultural setting is a key lever of teachers’ self-efficacy in teaching in multicultural environments. Along the same lines, another possible reason is that schools with culturally diverse populations receive or develop targeted in-house professional development, which has a direct impact on feelings of efficacy of their teachers. Selection issues may also be at play, whereby teachers with more multicultural self-efficacy are more likely to choose to teach at multicultural schools, and multicultural schools are more likely to hire teachers with higher multicultural self-efficacy, or assign teachers with high multicultural self-efficacy to the more diverse classrooms within schools.
There are hardly any countries where the share of students with refugee status in a class is significantly related to teachers’ self-efficacy in teaching in multicultural settings. However, in four European countries, the Czech Republic, Latvia, Norway and Portugal, teachers tend to report feeling less able to teach a multicultural class when they have at least one refugee student in their classroom (Table I.3.41). This negative relationship could be explained by the specificities of teaching refugees, students who may have experienced a trauma and arrived in the host country with little preparation in the language of instruction (Graham, Minhas and Paxton, 2016[59]; Hart, 2009[60]). The massive and sudden inflow that occurred in some countries (especially Sweden) may have also taken teachers and schools by surprise (OECD, 2018[52]), with little time to adjust, leaving them feeling unprepared. The teachers who are actually coping with these infrequent situations may, in fact, be quite realistic about the challenges they entail.
Enhancing school climate and learning environments
An important issue for policy makers, principals, teachers and parents alike is to understand the dynamics at play in school and classroom climates, as research shows that a positive school climate is a powerful direct or indirect influence on student learning and social well-being (Battistich et al., 1997[77]; Bryk and Schneider, 2002[78]; Cohen et al., 2009[79]; Engel, Rutkowski and Rutkowski, 2009[80]; Hoy, Tarter and Hoy, 2006[81]; Martin et al., 2013[82]; Nilsen and Gustafsson, 2014[83]), as well as on teachers’ sense of efficacy, confidence, and commitment to teaching (Carroll et al., 2005[84]; Hoy and Woolfolk, 1993[85]; Weiss, 1999[86]). School climate is a collective indicator of the culture of schools that encompasses physical, social and academic dimensions (Epstein and Mcpartland, 1976[87]). School safety can be conceptualised as pertaining to the physical and social dimensions of school climate. At a more micro-level (i.e. the class level), the relationships students forge with their teachers, the support they get from them, as well as the disciplinary climate in the classroom, are also crucial aspects for teacher and student well-being and student learning. It is particularly relevant to examine classroom discipline in light of its relation to teaching time and, by implication, to students’ opportunity to learn (Le Donné, Fraser and Bousquet, 2016[42]; Vollmer, 2000[88]).
As earlier cycles of TALIS had asked teachers and principals about various aspects of school and classroom climates, TALIS 2018 provides a unique opportunity to investigate changes over time in this area and how the various dimensions of school safety, student-teacher relations and classroom discipline have changed since 2008.
Safety of schools’ learning environments
TALIS asks school principals about the frequency of a number of incidents related to school safety, more specifically the frequency with which they occur in their school (“never”; “less than monthly”; “monthly”; “weekly”; or “daily”). While it is important to keep in mind that these reports reflect principals’ perceptions and awareness of incidents as much as their actual prevalence, they nevertheless shed light on the safety of schools. Fortunately, on average across the OECD, schools in 2018 are, for the most part, immune from weekly or daily school-safety incidents and, thus, provide students with safe learning environments (Figure I.3.12, Table I.3.42). Some issues of traditional concern to parents do, in fact, occur on a weekly basis in a small minority of schools (under 3%). This is the case for the use/possession of drugs or alcohol (an issue occurring at least weekly in only 1% of schools on average in the OECD), physical injury caused by violence among students (2%), the posting of hurtful information about students on the Internet (2.5%) or vandalism and theft (3%). Incidents related to intimidation or verbal abuse of teachers/staff or unwanted electronic contact among students are slightly more frequent (occurring at least weekly in 3% to 4% of schools) (Figure I.3.12, Table I.3.42).
However, one issue stands out in the reports of school principals on school safety: reports of regular incidents related to intimidation or bullying among students are significantly higher than for the other school safety incidents, occurring at least weekly in 14% of schools on average across the OECD. This is an issue of concern for policy makers, teachers, principals and parents, given the enduring impact of intimidation and bullying on the well-being, confidence and achievement of students who are victims of it, as well as its potentially dramatic consequences (Hoy, Hannum and Tschannen-Moran, 1998[89]). According to principals’ reports, this problem is most prevalent in Belgium (and the Flemish Community),24 Malta, New Zealand and South Africa (occurring at least weekly in 30% to 40% of schools), as well as in Brazil, Bulgaria, England (United Kingdom), Finland, France, Israel, Sweden and the United States (occurring at least weekly in 20% to 30% of schools). This phenomenon might also be a significant issue in Australia25 (Table I.3.42). By contrast, this issue is, according to principals’ reports, extremely rare in Japan, Kazakhstan, Korea and Shanghai (China) (Table I.3.42).
Likewise, it is worrisome that 3% of schools face issues of intimidation or verbal abuse of teachers or staff at least weekly. This can also have enduring consequences for their well-being, stress levels, confidence and, eventually, for their retention in the profession (Guo and Higgins-D’Alessandro, 2011[90]). Brazil and the Flemish Community of Belgium are the education systems where this issue seems most frequent, as it occurs at least weekly in over 10% of schools. Intimidation or verbal abuse of teachers or staff also happens at least weekly in 5% to 10% of schools in Belgium, Colombia, Denmark, Estonia, New Zealand, Saudi Arabia, South Africa, Sweden and the United States (Table I.3.42).
Country-specific patterns shed light on the specific challenges faced by different countries and economies in relation to school safety. The education systems where school safety incidents are most frequent and widespread, according to principals, are Brazil, England (United Kingdom), the Flemish Community of Belgium and South Africa, where at least 10% of principals report school safety incidents at least weekly on at least three of the seven dimensions of school safety examined in TALIS (Table I.3.42).
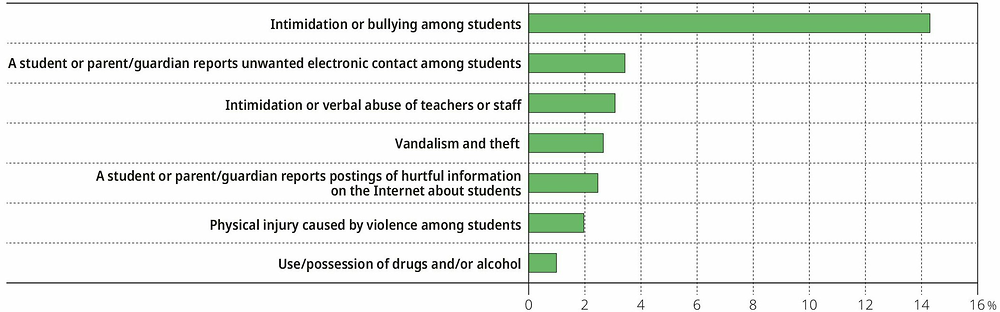
Values are ranked in descending order of the percentage of lower secondary principals reporting that the following incidents occurred at least weekly in their school.
Source: OECD, TALIS 2018 Database, Table I.3.42.
TALIS makes it possible to scrutinise the change in school safety over the past five years. To the extent that intimidation or bullying among students is the most frequent school safety issue reported by principals in 2018, it is interesting to examine how it has changed compared to 2013. It is noticeable in this respect that principals’ reports suggest that the frequency of intimidation or bullying has declined over the past five years in many countries and economies with available data (Figure I.3.13, Table I.3.45). However, one limitation is that, in 2018, a new question asks principals about the frequency of a student or parent/guardian reporting the posting of hurtful information on the Internet about students – akin to cyberbullying – whereas those types of incidents would likely have been included under the bullying item in 2013. Therefore, a change in bullying over time needs to be interpreted cautiously. A more accurate picture of change patterns can be obtained by taking into account not only incidents of “intimidation or bullying among students”, but also incidents of “a student or parent/ guardian reports postings of hurtful information on the Internet about students” (in 2018). Such an approach, contrasting daily or weekly incidents of “intimidation or verbal abuse among students (or other forms of non-physical bullying)” in 2013 with daily or weekly incidents of both intimidation or bullying and reports of posting hurtful information on the Internet (in 2018) reveals that eight participating countries and economies have experienced a significant reduction in the frequency of this phenomenon, as reported by principals.26 This improvement is particularly marked in Alberta (Canada), Chile, Croatia, Estonia and Latvia. Box I.3.8 provides insights on some of the initiatives taken by these countries to address bullying issues. By contrast, England (United Kingdom), the Flemish Community of Belgium, Israel, New Zealand and the Slovak Republic have faced a reverse pattern on this issue, which calls for close monitoring and specific action. There is little significant change in other areas of school safety, with the exception of intimidation or verbal abuse of teachers or staff, for which frequency has increased in Denmark but declined in Alberta (Canada) and Chile, and physical injury caused by violence among students, for which frequency has increased in Finland, Israel and New Zealand (Table I.3.45).
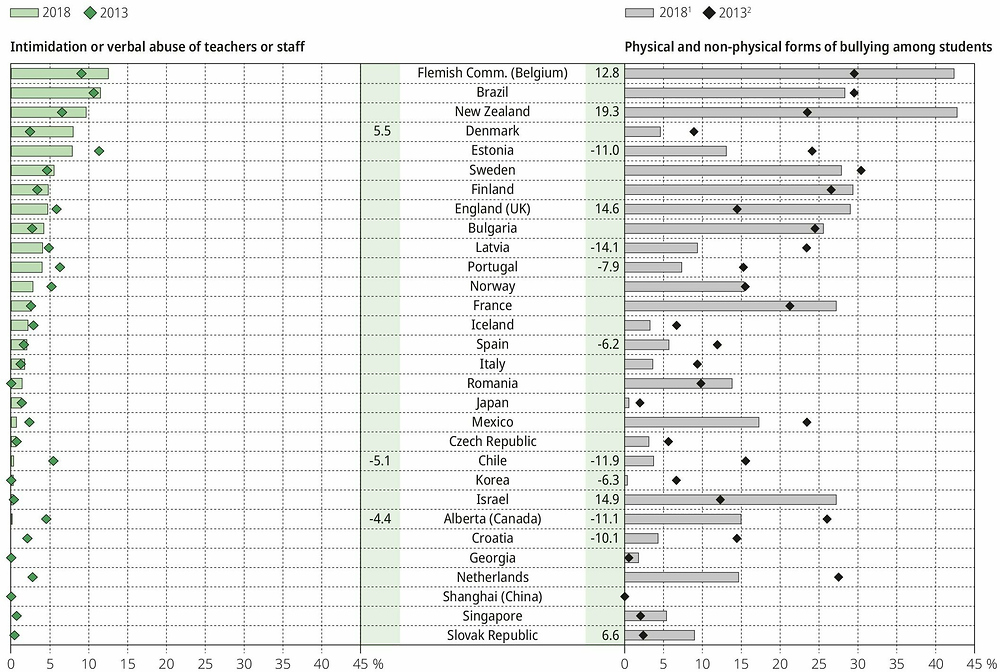
1. Data for TALIS 2018 refer to “Intimidation or bullying among students (or other forms of verbal abuse)” and/or “A student or parent/guardian reports postings of hurtful information on the Internet about students”.
2. Data for TALIS 2013 refer to “Intimidation or verbal abuse among students (or other forms of non-physical bullying)”.
Notes: Only countries and economies with available data for 2013 and 2018 are shown.
Statistically significant changes between 2013 and 2018 (TALIS 2018 – TALIS 2013) are found next to the category and the country/economy name (see Annex B).
Countries and economies are ranked in descending order of the percentage of lower secondary principals reporting that intimidation or verbal abuse of teachers or staff occurred at least weekly in their school in 2018.
Source: OECD, TALIS 2018 Database, Table I.3.45.
Estonia
Strategic action to prevent bullying and respond to bullying incidents in Estonia is a joint effort of the government ministries of welfare and health, academic institutions and non-profit foundations. As a result, there is a diverse set of initiatives on multiple fronts and with a shared goal of combatting bullying in all forms. These initiatives include bullying prevention and awareness campaigns at the school level and leading a public discourse in media to involve community stakeholders. There are special measures to combat cyberbullying, such as “web-constables” who are police officers working on line giving advice to young users on the Internet. What stands out in the Estonian approach is also the priority given to anti-bullying programmes at all levels of education – including both kindergartens and schools.
Chile
In Chile, the Education Superintendence (Superintendencia de Educación) is responsible for upholding the quality of school climate based on the “Law of School Violence”, by monitoring school indicators developed by the Quality of Education Agency. These indicators include perceptions and attitudes that students, teachers and parents have regarding the presence of a respectful and safe environment. The Superintendence oversees the “School Internal Regulation”, which mandates schools to define bullying prevention policies as well as protocols of action when bullying conducts are identified. According to the Education Superintendence, the body allows citizens to have a mechanism to report bullying. This increases the citizens’ control of a school’s implementation of all protocols (that by law the school must have) in the case of bullying or any other action that affects the school environment and coexistence. About 68% of the complaints that the Education Superintendence receives are related to school environment and coexistence.
Alberta (Canada)
In Alberta (Canada), teachers have access to a wealth of resources provided by the Ministry of Education in order to identify behavioural signs of bullying in the school, covering physical, social and cyberbullying. These resources also support teachers to develop a response plan for bullying-related situations and to involve parents and caregivers in these response plans. According to these resources, teachers should observe school incidents to track bullying behaviour, develop strategies for promoting positive behaviour and create a general awareness in the school regarding the negative impact of bullying and what students can do if they witness bullying among their peers.
Sources: Estonian Union for Child Welfare (2015[91]), Kiusamisest vabaks! (Free of Bullying), http://kiusamisestvabaks.ee/about-us, (accessed 12 April 2019); information provided by the Ministry of Education, Estonia, 11 April 2019; Agencia de Calidad de la Educación, Gobierno de Chile (n.d.[92]) Desarrollo Personal y Social: Otros Indicadores de Calidad Educativa [Personal and Social Development: Other Indicators of Educational Quality], http://archivos.agenciaeducacion.cl/Desarrollo_personal_social_OIC_25_11.pdf, information provided by the Ministry of Education, Chile, 9 April 2019; Government of Alberta (2019[93]), Bullying prevention for educators: Learn how to recognize, prevent and respond to signs of bullying in school, www.alberta.ca/bullying-prevention-for-educators.aspx (accessed 8 April 2019).
Teachers’ relationships with students
TALIS sheds light on relationships in the school by asking teachers a series of questions on teacher-student relations, which provide indications on whether teachers and students get along well, as well as on the school climate as it pertains to supporting student well-being. These data suggest that relations between teachers and their students are extremely positive. On average across the OECD, 96% of teachers agree or strongly agree that most teachers believe that the students’ well-being is important, and 96% also agree or strongly agree that teachers and students usually get on well with each other (Table I.3.46). High shares of teachers also concur with the statements that most teachers are interested in what students have to say (93%) and that, if a student needs extra assistance, the school provides it (92%).
When examining country-specific patterns, it is striking that over 90% of teachers agree that teachers and students get along well in all participating countries and economies, except South Africa, which is just under 85%. Teachers valuing students’ well-being is also a widely shared belief across countries and economies participating in TALIS, since only Kazakhstan and the Slovak Republic have levels of agreement below 90% for the statement that most teachers believe that the students’ well-being is important. By contrast, there is less consensus on the statements that most teachers are interested in what students have to say and that if a student needs extra assistance, the school provides it (Table I.3.46).
TALIS also asks teachers the extent to which teachers in the school can rely on each other. This provides additional information on the degree of cohesion and reliance, as another important element of the school climate (Finnan, Schnepel and Anderson, 2003[94]; Ghaith, 2003[95]). Teachers’ agreement on this statement (87% on average across the OECD) is noticeably below the wide consensus on teacher-student relations, as 13% of teachers perceive that cohesion with their colleagues is insufficient. This pattern is particularly marked in Mexico (only 66% agreement) but also, to a lower extent (79% to 83%), in Colombia, Croatia, Hungary, Japan, Portugal, South Africa and Turkey (Table I.3.46).
The analysis of teacher-student relations over time confirms the findings on school safety that the school climate has improved overall in a majority of TALIS countries and economies since the first TALIS survey in 2008:
-
On the belief that teachers and students usually get on well with each other, Israel is the only country that has seen a moderate decrease in the proportion of teachers concurring with this statement since 2013 (2 percentage points). All other countries and economies either did not experience much change, or saw an improvement in teacher-student relations, with the most significant progress on this dimension of school climate in Estonia, Lithuania, Mexico and the Slovak Republic since 2008, and Italy since 2013, with changes greater than 5 percentage points.
-
Teachers’ belief in the importance of student well-being has also progressed in the vast majority of countries, mostly in Korea and Turkey, since 2008. But Hungary and the Slovak Republic have experienced a reverse pattern, with less agreement among teachers on this statement in 2018 than in 2008.
-
The other two dimensions of teacher-student relations reveal more nuanced patterns, with improvements in a number of countries and economies, but declines in others (Table I.3.49).
Disciplinary climate in today’s landscape
TALIS tackles the issue of discipline by asking teachers their level of agreement (“strongly disagree”; “disagree”; “agree”; or “strongly agree”) with four statements about the disciplinary climate in their target class. In 2018, disciplinary issues in the target class are reported by 26% to 29% of teachers, on average across the OECD. More specifically, 29% of teachers agree or strongly agree that they “lose quite a lot of time because of students interrupting the lesson”, 28% that they “have to wait quite a long time when the lesson begins for students to quieten down”, and 26% that “there is much disruptive noise in the classroom”. Mirroring these disciplinary issues, only 72% of teachers agree that students in their target class “take care to create a pleasant learning atmosphere” (Table I.3.50).
Country-specific patterns on these various aspects reveal that some education systems are more affected by disciplinary issues than others, with either disruptive behaviours reported by 40% of teachers or more, or a pleasant learning atmosphere reported by less than 60% of teachers. This is the case for Brazil on all four dimensions of the school disciplinary climate, in Spain for three dimensions of the disciplinary climate, and in Belgium, Chile, Iceland, Portugal and South Africa for two dimensions (Table I.3.50).
Classroom disciplinary climate, as perceived by teachers, varies with classroom composition. Logically, on average across the OECD and in all countries and economies participating in TALIS (except Viet Nam), the higher the concentration of students with behavioural problems in the classroom, the more teachers report a lack of discipline (Table I.3.53). This still holds after controlling for other classroom composition indicators and for teachers’ characteristics – gender, employment status and years of experience (Table I.3.54). Conversely, the need for more discipline is significantly lower in classrooms with a higher share of academically gifted students in almost all participating countries, except Japan, Portugal and Romania, both before and after controlling for teacher characteristics.
The other aspects of classroom diversity are not clearly related to classroom disciplinary climate, from a cross-country perspective. Only a few countries show a significant relationship between some other indicator of classroom composition and disciplinary climate. Indeed, the share of students whose first language is different from the language of instruction shows no significant association with the disciplinary climate in 37 countries. There are a few outlier systems: the share of students whose first language is different from the language of instruction shows a small negative association with the disciplinary climate in eight countries and economies (Estonia, the Flemish Community of Belgium, France, Malta, Norway, the Russian Federation, Sweden and the United Arab Emirates), both before and after controlling for teacher characteristics, in addition to other classroom composition indicators (Tables I.3.53 and I.3.54). However, the effect is very small and may still be overestimated, as it may capture the effect of other aspects of teachers’ profiles, beyond those controlled for in the analyses – teachers’ gender, employment status and experience.27 By contrast, four countries show a positive relationship between the share of students whose first language is different from the language of instruction and disciplinary climate, after controlling for classroom and teacher characteristics: Italy, Latvia, New Zealand and South Africa (Table I.3.54).
Changes in the classroom disciplinary climate reveal the progress achieved between 2013 and 2018 by about one-third of the participating countries and economies with available data, but also weakening of the disciplinary climate of another group of countries and economies. The loss of teaching time due to students taking time to quieten down at the beginning of the lessons is less of an issue for teachers in 2018 than it was in 2013 (Figure I.3.14, Table I.3.55). Since 2013, the share of teachers reporting this issue as a problem in their target class has decreased most in Norway (-20 percentage points), Estonia (-6) and Israel (-5). By contrast, this aspect of the disciplinary climate has worsened since 2013 in Bulgaria, the Flemish Community of Belgium, Korea, New Zealand, Portugal and Romania. Teaching time is also lost due to students interrupting the lesson once it has started. This aspect of the classroom disciplinary climate closely mirrors the changes over time with respect to time lost at the beginning of the class (Table I.3.55).
Another common disciplinary issue at the classroom level is disruptive noise in the classroom, which may prevent students and teachers from concentrating on the lesson. Changes over time for this aspect of the classroom disciplinary climate display mixed patterns, with roughly equal numbers of countries experiencing improvement or decline in this area (Figure I.3.14, Table I.3.55). In addition to understanding change in the prevalence of disruptive noise as a disciplinary issue, it should be kept in mind that an increase in the prevalence of disruptive noise could also be the result of a change in teaching practices – such as increased group work or classroom discussions between students – leading to changes in teachers’ perceptions of disturbances.
Country-specific changes in the different classroom disciplinary climate dimensions underline consistent patterns for some countries. According to teachers’ reports, the classroom disciplinary climate has worsened for at least three of the classroom disciplinary climate dimensions in Bulgaria, the Flemish Community of Belgium and New Zealand since 2013, and in Austria, Brazil, Bulgaria and Slovenia since 2008. By contrast, the classroom disciplinary climate has improved on at least three dimensions in the Czech Republic, Estonia and Singapore since 2013, as well as in Denmark and Norway28 since 2008 (Table I.3.55).
In interpreting these change patterns, however, it is important to keep in mind that they are based on teachers’ perceptions of the classroom disciplinary climate and, as such, may reflect a range of factors as much as actual changes in students’ behaviours. Indeed, different mechanisms may be at play, such as changes in instructional practices, specific emphasis of professional development activities on classroom management/climate issues in recent years, or generation effects in cases where the age structure of the teaching workforce has evolved and different cohorts of teachers react differently to minor lesson interruptions (e.g. considering whether they are problematic and worth reporting).
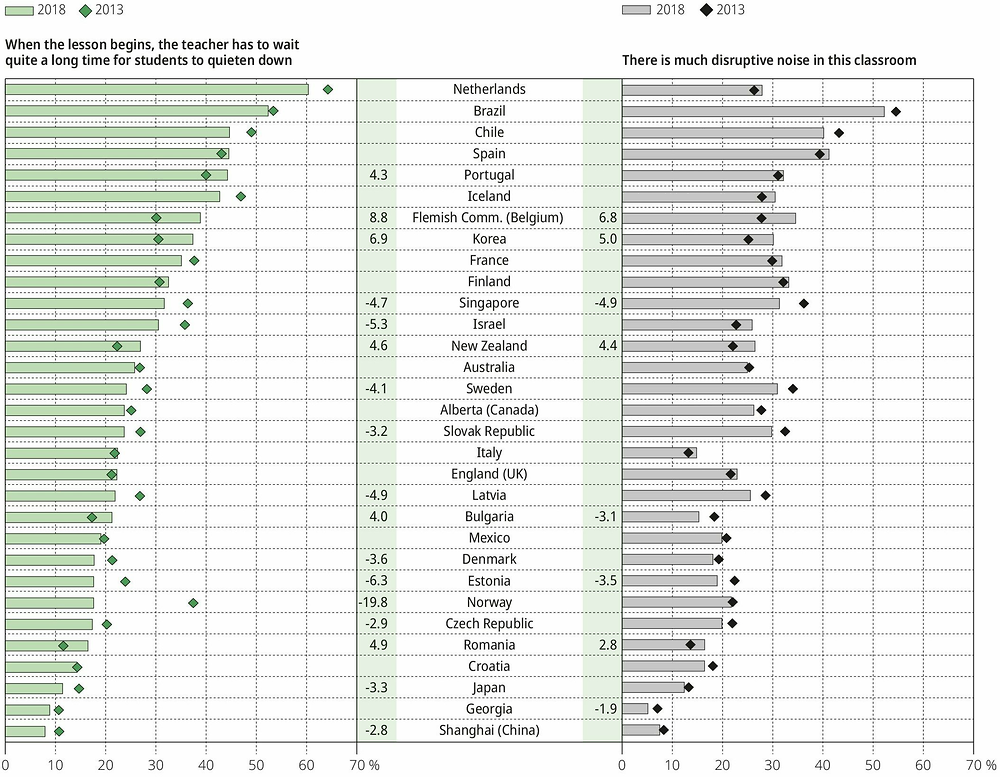
Notes: Only countries and economies with available data for 2013 and 2018 are shown.
Statistically significant changes between 2013 and 2018 (TALIS 2018 – TALIS 2013) are found next to the category and the country/economy name (see Annex B).
Countries and economies are ranked in descending order of the percentage of lower secondary teachers who “agree” or “strongly agree” that, when the lesson begins, the teacher has to wait quite a long time for students to quieten down.
Source: OECD, TALIS 2018 Database, Table I.3.55.
School safety
Across countries and economies participating in TALIS, schools are a safe place. Among the 13 countries and economies with available data for ISCED 1 and 2 and the 11 countries with available data for ISCED 2 and 3, incidents such as vandalism or use of drugs typically occur on a daily or weekly basis in less than 3% of schools, and the frequency tends to be similar across primary, lower and upper secondary schools.
England (United Kingdom) stands out regarding the gap in incidents of intimidation or bullying among students, as they occur at least weekly in far fewer primary schools than lower secondary schools. Likewise, primary schools in England (United Kingdom), the Flemish Community of Belgium and France experience incidents related to the posting of hurtful information on the Internet about students or unwanted electronic contact among students far less frequently than lower secondary schools (Table I.3.43).
Student-teacher relationships
Across OECD countries, 96% of lower secondary teachers report a good relationship with their students. Primary schools exhibit similar shares of teachers reporting positive student-teacher relations even more often than lower secondary schools in most of the 13 countries and economies with available data for ISCED 1 and 2 (Table I.3.47).
Fewer upper secondary teachers report good relations with their students than their lower secondary peers. Depending on the specific aspect of student-teacher relationships considered, 2 to 7 out of the 11 countries and economies with available data for ISCED 2 and 3 display slightly lower shares of teachers in upper secondary education reporting good relations with their students, with the largest difference in Brazil (more than 5 percentage points under the category “if a student needs extra assistance, the school provides it”). In contrast, concerning the provision of extra assistance to a student that needs it, Denmark, Sweden and the United Arab Emirates display a better outlook in upper secondary education than in lower secondary education (Table I.3.48).
Disciplinary climate
Across OECD countries and economies participating in TALIS, more than two-thirds of lower secondary teachers report a high share of students in the class taking care to create a pleasant learning atmosphere (Table I.3.50). In 9 out of 13 countries and economies with available data for ISCED 1 and 2, teachers’ reports suggest that primary students tend to take more care to create a pleasing learning atmosphere than their older peers at the lower secondary level, with the largest difference in the Flemish Community of Belgium (12 percentage points) and in Spain (14 percentage points) (Table I.3.51).
While lower secondary students tend to take less care to create a positive learning environment than their younger peers, the level of classroom discipline tends to increase between the two levels of education in some of the 13 countries and economies with available data for both levels. For instance, in 5 out of 13 countries, a lower share of teachers report that there is a considerable amount of disruptive noise in the classroom (Table I.3.51).
In upper secondary education, the vast majority of the 11 countries with available data for ISCED 2 and 3 display a more positive outlook on the disciplinary climate than in lower secondary education (Table I.3.52). For instance, in 9 out of 11 countries, a lower share of teachers report that the teacher loses quite a lot of time because of students interrupting the lesson. Likewise, in most countries, more upper secondary teachers than lower secondary teachers report that students in the class take care to create a pleasant learning atmosphere, with the largest difference in Portugal (12 percentage points).
School climate, teaching practices and teachers’ self-efficacy
Beyond the reports of school principals and teachers on the school and classroom climate and related changes over time, it is also important to examine the extent to which the school and classroom climate relates to teaching practices used by teachers and their perceived efficacy (Kraft, Marinell and Shen-Wei Yee, 2016[96]; Maxwell et al., 2017[97]; Thomas and Bass, 1992[98]). These relationships can explain whether and to what extent the link between school climate and student achievement is mediated by teachers’ practices and perceptions.
These issues are covered in more depth in Chapter 2, as part of a discussion of teaching quality, classroom factors and teacher characteristics. However, regression analyses show that teachers who report a greater lack of discipline in their classroom tend to feel less confident in their teaching ability (Table I.3.56) and to spend less classroom time on actual teaching and learning (Table I.3.58). These relationships hold for all countries and economies participating in TALIS with available data, both before and after controlling for teacher characteristics (Tables I.3.57 and I.3.59). Teachers with less disciplined classes also tend to engage their students less frequently in practices pertaining to cognitive activation,29 such as presenting tasks for which there is no obvious solution, giving tasks that require students to think critically, having students work in small groups to come up with a joint solution to a problem or task, and asking them to decide on their own procedures for solving complex tasks (Table I.3.60). This holds true for all countries and economies participating in TALIS, except Alberta (Canada), CABA (Argentina), France, Iceland, Japan and Viet Nam (Table I.3.60).30
Challenges and priorities, according to teachers and school leaders
As shown at the beginning of this chapter, the landscape for teaching and learning has changed significantly over the past decade, in ways that can be challenging for teachers and principals in their efforts to deliver quality instruction. At the same time, since the turn of the 21st century, there has been growing interest in the academic and policy spheres in teacher professionalism as an approach to educational reform (Harris-Van Keuren, Silova and McAllister, 2015[99]; OECD, 2016[100]). One of the key aspects of the professionalisation of the teaching workforce is the role of teachers and their representative organisations in the areas of educational policy making and resource allocation (Darling-Hammond and Lieberman, 2012[101]; Lai and Lo, 2007[102]), although this aspect is relatively little explored beyond the school level. As the voice of teachers (and principals), TALIS provides an opportunity to sound out teachers and school leaders on the challenges they face and the priorities they feel policy makers should address, acting as an upward-feedback mechanism for the education system as a whole. More specifically, TALIS 2018 explores the views of these frontline actors on their educational policy priorities, particularly with regard to resource allocation within education systems (OECD, 2017[103]).
School leaders’ views on school resources issues that hinder quality instruction
A first approach is to ask school principals about the school resources issues that they feel hinder their school’s capacity to provide quality instruction. TALIS has asked them this question since 2008, but the coverage of issues broadened in 2013, so that indicators of change over time are available for a larger number of issues from then. In particular, on a number of resources issues, TALIS asks principals to what extent they hinder quality instruction (“not at all”; “to some extent”; “quite a bit”; or “a lot”).
In 2018 on average across the OECD, the three most common resources issues in schools (reported by one-third of principals as hindering the school’s capacity to provide quality instruction “quite a bit” or “a lot”) are: “shortage of support personnel” (33%); “shortage of teachers with competence in teaching students with special needs” (32%); and “shortage or inadequacy of time for instructional leadership” (32%). The next most common issues (reported by one-quarter of principals are: “shortage or inadequacy of physical infrastructure” (26%); “shortage or inadequacy of time with students” (25%); and “shortage or inadequacy of instructional space” and “shortage or inadequacy of digital technology for instruction” (both 25%). About one-fifth of principals reported that the issues hindering quality instruction are: “shortage of qualified teachers” (21%) and “shortage of teachers with competence in teaching students in a multicultural or multilingual setting” (20%) (Table I.3.63).
Resources issues differ widely across countries and economies participating in TALIS. Overall, principals in Brazil, Colombia and Viet Nam expressed the highest level of shortages: at least 8 out of the 15 proposed issues were rated as key hindrances by 50% of school principals or more, most likely reflecting severe shortages and financial constraints in lower secondary education in those systems (Table I.3.63). But on resource shortages identified by principals, there is no systematic clustering of countries and economies along the lines of education expenditure or GDP.31
“Shortage of support personnel”, the top priority identified by principals, was mentioned by less than 10% of school principals in Bulgaria, Iceland, Lithuania, the Netherlands, Norway, the Russian Federation, Shanghai (China), Singapore, Slovenia and Sweden, despite very different levels of education expenditure across these countries and economies (OECD, 2018[15]). But more than 50% of principals reported this resource shortage in Brazil, Colombia, Italy, Portugal, Saudi Arabia, South Africa and Viet Nam (Table I.3.63).
“Shortage of teachers with competence in teaching students with special needs”, the second-highest resource shortage on average across the OECD, was cited by over 70% of principals in France, and by 50% to 70% of principals in Belgium,32 Brazil, Colombia, Saudi Arabia, South Africa and Viet Nam, but by less than 15% in Alberta (Canada), Austria, Finland, Georgia, Iceland and the Russian Federation.
Large differences across countries are also found with respect to the “shortage or inadequacy of time for instructional leadership”. It was cited by over 50% of principals in Belgium, Colombia, Italy, Portugal and Viet Nam, but less than 15% of principals in Bulgaria, England (United Kingdom), Estonia, Georgia, Mexico and Singapore (Table I.3.63).
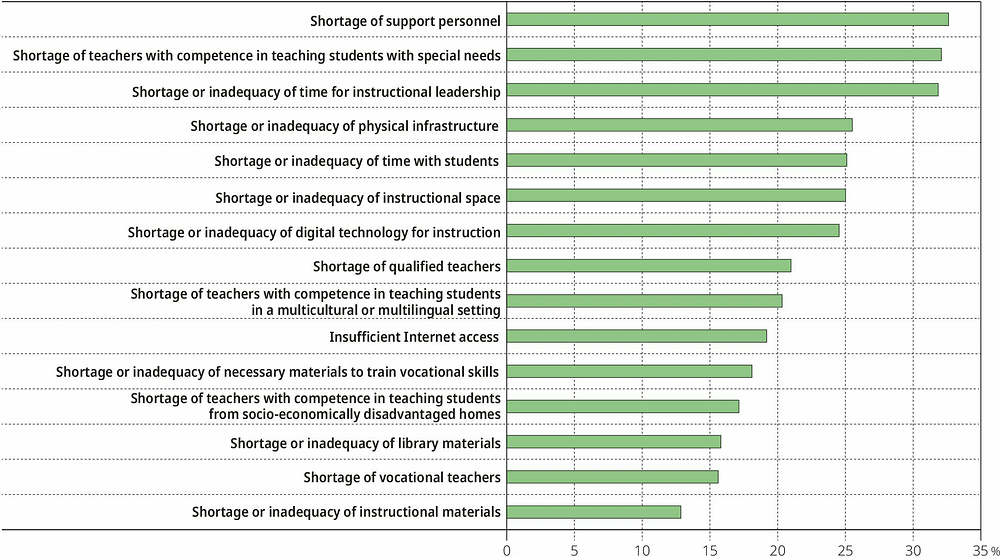
Values are ranked in descending order of the prevalence of shortages of school resources.
Source: OECD, TALIS 2018 Database, Table I.3.63.
Aside from Brazil, Colombia and Viet Nam, which face widespread resources shortages in most dimensions examined by TALIS, some other severe country-specific shortages (cited by about 50% of principals or more) include:
-
for material resources issues: shortages or inadequacy of physical infrastructure (in Italy, Portugal, Saudi Arabia and South Africa), instructional space (in Israel), and digital technology for instruction (in Portugal, Romania, Saudi Arabia and South Africa), as well as insufficient Internet access in Mexico
-
for human resources issues: shortages of teachers with competence in teaching students with special needs (in Belgium, France, Saudi Arabia, South Africa and Viet Nam), in teaching students in a multicultural or multilingual setting (in Italy), and in teaching both students with special needs and students from socio-economically disadvantaged homes (in France) (Table I.3.63).
Across OECD countries and economies participating in TALIS, the three top resource-shortage issues reported by lower secondary principals are shortage of support personnel (33%), shortage of teachers with competence in teaching students with special needs (32%) and shortage or inadequacy of time for instructional leadership (32%) (Table I.3.63). Principals at the primary level tend to report the same top three resource issues in most of the 13 countries and economies with available data for ISCED 1 and 2 (Table I.3.64).
In upper secondary education, in the 11 countries and economies with available data for ISCED 2 and 3, the reported resource issues tend to be the same as at the lower secondary level overall. In a few countries, including Denmark, Portugal and Viet Nam, the reported shortage of support personnel and shortage or inadequacy of physical infrastructure is lower in upper secondary schools than in lower secondary schools by more than 10 percentage points. The latter resources issue is also less often mentioned in Sweden (Table I.3.65).
Teachers’ views on priority areas for intervention and additional spending in education
As a complement to principals’ reports on resources issues that hinder their schools’ capacity to provide quality instruction, TALIS 2018 also asks teachers, for the first time, what they think should be the priority areas for intervention and additional spending in education. This is an indirect way to identify the major resources issues. As frontline actors of education systems, teachers are particularly well-positioned to report on resources issues that directly affect their daily work. It is, therefore, important for policy makers to rely on the professional voice of teachers to inform policy on resources needs within the education sector, and to better understand not only what teachers believe should be priority areas for intervention and additional spending, but also what factors shape these beliefs.
TALIS 2018 makes it possible, for the first time, to explore resources issues from the perspective of teachers. It asks them to rate the importance of a number of priorities if the education budget were increased by 5%. For each priority they are asked if it is “of low importance”, “of moderate importance” or “of high importance”. To avoid the dilemma of forcing teachers to choose among competing issues, they had the option of rating all issues as of “high importance”. Nevertheless, it is possible to get a sense of the most prominent resources issues by examining the proportion of teachers in each country that identified each issue as an area “of high importance”, as well as the top three issues they most often reported as high priorities.
In 2018, on average across the OECD, the number one spending priority reported by teachers was “reducing class sizes by recruiting more staff” (rated of high importance by 65% of teachers), followed by “improving teacher salaries” (64%), “offering high-quality professional development for teachers” (55%), and “reducing teachers’ administration load by recruiting more support staff” (55%). All of these four issues are rated of high importance by over half of the teaching workforce on average in the OECD. By contrast, “improving school buildings and facilities”, “supporting students with special needs”, “investing in ICT”, “supporting students from disadvantaged or migrant backgrounds” and “investing in instructional materials” are rated of high importance less often. However, these issues are still considered of high importance by 30% to 50% of teachers across the OECD (Table I.3.66).
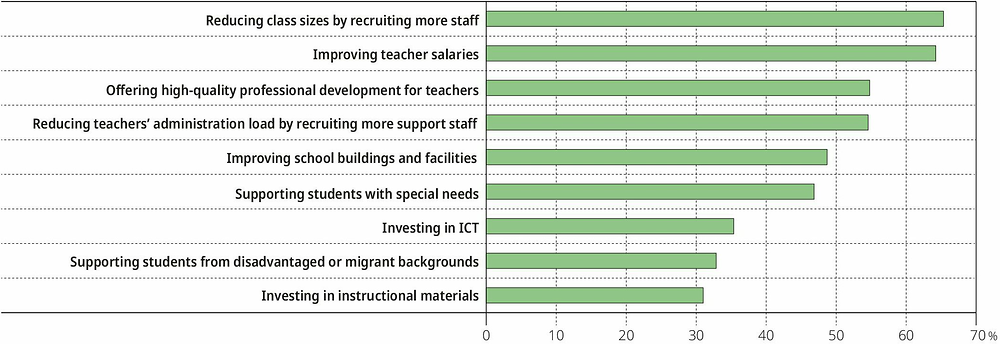
← 1. Respondents were not asked to prioritise; they had the possibility to attribute “high importance” to all spending priorities.
Note: ICT: Information and communication technology.
Values are ranked in descending order of the percentage of lower secondary teachers who reported the following spending priorities to be of high importance.
Source: OECD, TALIS 2018 Database, Table I.3.66.
Another way to look at broad patterns is to examine, for each issue, the number of countries and economies for which it was among the top three priorities rated by teachers. With this approach, the key priority areas remain the same, but the order changes. “Improving teacher salaries” becomes the issue most often rated among the top three priorities (in the education systems of 39 participating countries and economies), followed by “reducing class sizes” (29 education systems), “reducing teachers’ administration load” (24 education systems), “offering high-quality professional development for teachers” (23 education systems), “improving school buildings and facilities” (15 education systems) and “supporting students with special needs” (10 education systems) (Table I.3.66).
The patterns of country-specific spending priorities shed light on issues that, according to teachers, require specific attention from policy makers. Indeed, while the number one spending priority33 in the bulk of participating countries and economies, according to teachers, is “improving teacher salaries” (in 21 countries) and “reducing class sizes by recruiting more staff” (in 17 countries), teachers in some education systems have selected other issues as their number one priority. Country-specific issues of high importance to the profession include: “offering high-quality professional development for teachers” in Brazil, Chile, Colombia, Mexico and Slovenia;34 “improving school buildings and facilities” in Italy, Saudi Arabia and Turkey; and “reducing teachers’ administration load by recruiting more support staff” in Australia (Table I.3.66). In Italy, teachers’ ratings on the importance of “improving school buildings and facilities” are consistent with principals’ emphasis on the “shortage or inadequacy of physical infrastructure”. This could be related to the sequence of earthquakes in Central Italy in 2016-17, the school year preceding the survey. It damaged a number of schools and highlighted the vulnerability of existing school buildings (Di Ludovico et al., 2018[104]).
Across OECD countries and economies participating in TALIS, the two top spending priorities reported by lower secondary teachers are “reducing class sizes by recruiting more staff” (65%) and “improving teacher salaries” (64%) (Table I.3.66). While these issues are also reported as highly important by primary teachers in the 13 countries and economies with available data for ISCED 1 and 2, “supporting students with special needs” was rated of high importance more often by primary teachers than by their lower secondary peers (Table I.3.67). In 5 out of 13 countries, this issue is one of the two top spending priorities for primary teachers, with the largest difference of 15 or more percentage points in Denmark, the Flemish Community of Belgium and Japan.
In upper secondary education, the key priority areas tend to be the same as reported at the lower secondary level in the 11 countries and economies with available data for ISCED 2 and 3 (Tables I.3.66 and I.3.68). However, in 6 out of 11 countries, the priorities “investing in ICT”, “improving school buildings and facilities” and “supporting students with special needs “are rated less often as highly important by upper secondary teachers. The largest difference is found in Denmark regarding “supporting students with special needs” (-23 percentage points). Due to the slightly lower ratings of some priorities, “offering high-quality professional development for teachers” can be identified as one of the two top spending priorities in upper secondary education in 6 out of 11 countries.
The spending priority on “improving teacher salaries” deserves scrutiny. Indeed, this priority was rated highly by teachers in a majority of participating countries and economies. But this is not the case everywhere. In Australia, Austria, Belgium (and the Flemish Community), Denmark, Slovenia and Spain, “improving teacher salaries” was rated of high importance by less than half of the teachers overall,35 and it does not figure in their top three priority areas for additional spending.
The availability of internationally comparable data on teachers’ salaries relative to those of other tertiary-educated workers is not sufficiently widespread to allow more systematic examination of this issue. Instead, to compare the purchasing power of teachers’ statutory earning across countries, data on teachers’ statutory starting salaries are used, expressed in terms of purchasing power parity (PPP) (OECD, 2018[15]). Examining teachers’ salary levels in different countries and economies and the proportion of teachers who rated improving teacher salaries as a priority of high importance helps to better understand why teachers prioritise salary increases. The share of teachers who rate salary increases as highly important tends to be inversely proportional to the level of statutory starting salaries in their country (the linear correlation coefficient amounts to 0.75) (Figure I.3.17). In other words, the lower the level of statutory teaching salaries in a country (in PPP), the more teachers consider teachers’ salaries a priority of high importance. The same relationship holds when looking at levels of salaries after 15 years of experience or at the top of the salary scale (Tables I.3.66 and I.3.71). This pattern and the strength of the relationship again suggests that teachers may consider a range of factors when rating priority areas for additional spending, including the purchasing power and standard of living that salary levels grant, and how these compare internationally. Teachers seem more likely to prioritise salary increases when their standard of living is lower by international standards.
The examination of teachers’ propensity to prioritise salary increases across different school locations confirms that standards of living and purchasing power are likely to be important factors in a teacher’s likelihood to report salary increases as an important spending priority. Indeed, in a third of the countries and economies with available data, teachers working in cities (where housing prices and the cost of living are typically higher than in rural areas) display a higher propensity to report salary increases as “highly important” than their peers working in rural areas.36 This issue of regional disparities in teachers’ standards of living is particularly acute in education systems where teachers’ salary levels are set centrally, according to a system-level scale that does not take into account regional disparities in living expenses (Table I.3.69). Issues of teachers’ contractual conditions and compensation will be examined in more depth in Teachers and School Leaders as Valued Professionals, Volume II of the TALIS 2018 international report, to be published in 2020.
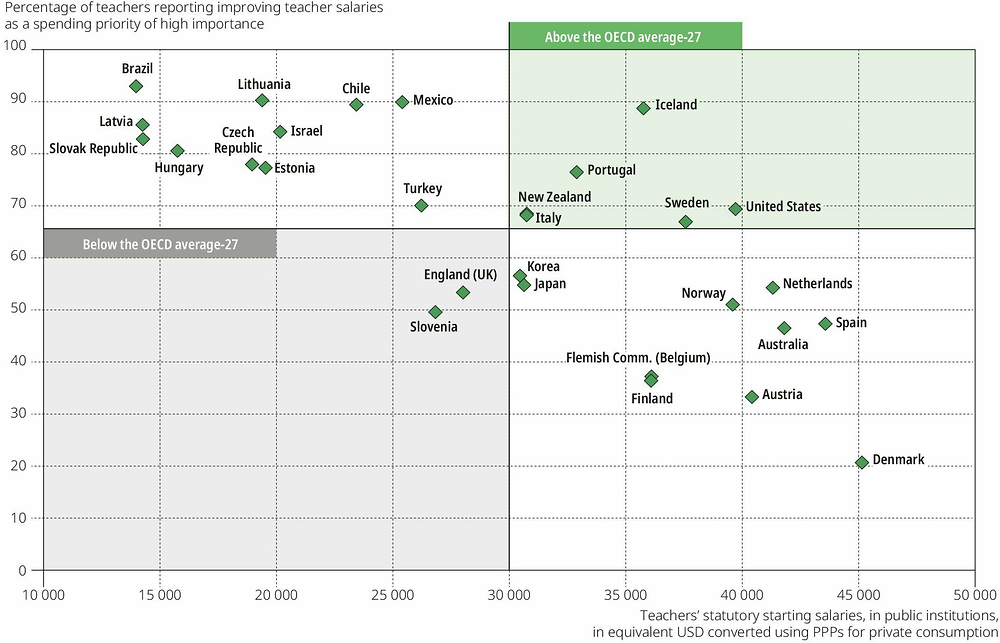
Notes: Only countries and economies with available data for the percentage of teachers who reported improving teacher salaries as of high importance in relation to spending priorities and for teachers’ statutory starting salaries are shown.
The OECD average-27 includes all TALIS 2018 OECD countries, except for Alberta (Canada), Belgium, Colombia and France.
Source: OECD, TALIS 2018 Database, Tables I.3.66 and I.3.71.
School context could be another driver of teachers’ propensity to prioritise “improving teacher salaries” in some countries and economies. In Belgium, Denmark and the United Arab Emirates, for instance, teachers working in schools with larger concentrations of students with special needs report improving salaries as a priority less often than their peers working in schools with fewer such students. Likewise, teachers working in schools with larger concentrations of students from socio-economically disadvantaged homes in Hungary, Sweden and the United Arab Emirates are less likely to report improving salaries as a high priority than their peers working in more advantaged schools,37 while the opposite pattern is observed in Australia and the United States (Table I.3.69).
Motivational aspects could be another driver of teachers’ tendency to prioritise” improving teacher salaries”, whereby teachers whose motivation to join the profession was based on stronger social-utility incentives may be less likely to prioritise improving salaries than those whose motivation to join the profession was more driven by personal utility factors (Watt et al., 2012[105]; Watt and Richardson, 2008[106]). Logistic regression analyses were conducted to examine how motivations to join the profession are related to teachers’ propensity to report improving salaries as a high priority. They show that teachers who report that the teaching schedule was an important motivation to join the profession are also more likely to report improvement in teacher salaries as a high spending priority in almost half of the countries and economies participating in TALIS. Teachers who found it important that teaching offered a steady career path are also more likely to consider salary increases as important in 12 countries and economies participating in TALIS. These findings tend to support the notion that teachers who valued the economic characteristics and the working conditions of the job when they became teachers are also logically more prone to seek teacher salary increases (Table I.3.72).
Teachers’ tendency to report “reducing class sizes by recruiting more staff” as a spending priority of high importance also deserves close examination, as this is the issue most commonly reported as a priority. First of all, it is noteworthy that, while reducing class sizes is reported as teachers’ number one priority in 17 participating countries and economies and one of the three top priorities in 29 education systems, this aspect of school resources – while rated highly by teachers in general – is not among the top three issues reported as of high importance by teachers in Brazil, CABA (Argentina), Chile, Colombia, Croatia, Estonia, Georgia, Hungary, Kazakhstan, Latvia, Mexico, Romania, Saudi Arabia, the Slovak Republic, Turkey, the United Arab Emirates and Viet Nam (Table I.3.66).
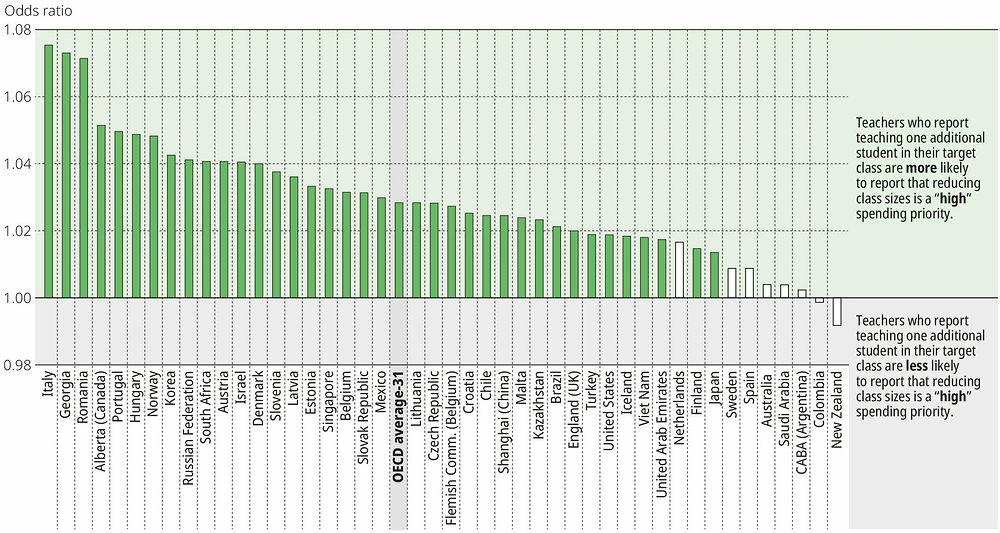
← 1. Results of binary logistic regression based on responses of lower secondary teachers. As the predictor is a continuous variable, the relationship refers to the marginal effect of one additional student in the target class on the likelihood of reducing class sizes reported as a highly-important spending priority.
← 2. An odds ratio indicates the degree to which an explanatory variable is associated with a categorical outcome variable. An odds ratio below one denotes a negative association; an odds ratio above one indicates a positive association; and an odds ratio of one means that there is no association.
← 3. The dependent variable is a dummy variable: the reference category refers to reducing class sizes reported as a low or moderate spending priority.
← 4. The predictor refers to the number of students in the target class.
← 5. Controlling for the following teacher characteristics: gender, working full-time and years of experience as a teacher; and for the following classroom characterisitcs: share of students whose first language is different from the language of instruction, share of students with special needs, share of students with behavioural problems, share of students from socio-economically disadvantaged homes, share of academically gifted students, share of students who are refugees.
Note: Statistically significant coefficients are marked in a darker tone (see Annex B).
Countries and economies are ranked in descending order of the likelihood of reducing class sizes reported as a “high” spending priority related to class size.
Source: OECD, TALIS 2018 Database, Table I.3.73.
Teachers’ inclination to consider reducing class sizes as a high spending priority may well be related to their personal teaching conditions, in particular to the size of the classes they teach. Regression analyses show that, as can be expected, teachers who teach larger classes38 are more likely to report reducing class sizes as a spending priority of high importance (Figure I.3.18 and Table I.3.73). This positive relationship holds true on average across the OECD and also for about three-quarters of all countries and economies participating in TALIS, after controlling for classroom composition and teacher characteristics.39 Exceptions to this are Australia, CABA (Argentina), Colombia, the Netherlands, New Zealand, Saudi Arabia, Spain and Sweden. Some of these countries and economies implement policies aiming at channelling more teachers to disadvantaged schools (Bénabou, Kramarz and Prost, 2009[107]; Clotfelter et al., 2008[108]; Dieterle, 2015[109]; Jepsen and Rivkin, 2009[110]; Karsten, 2006[111]; OECD, 2005[25]; OECD, 2018[112]) so, it may be that their teachers have opted to signal other areas on which to spend any additional budget allocated to the education sector.
References
[92] Agencia de Calidad de la Educación, G. (n.d.), Desarrollo Personal y Social: Otros Indicadores de Calidad Educativa [Personal and Social Development: Other Indicators of Educational Quality], Agencia de Calidad de la Educación, Gobierno de Chile, http://archivos. agenciaeducacion.cl/Desarrollo_personal_social_OIC_25_11.pdf (accessed on 9 April 2019).
[62] Alsubaie, M. (2015), “Examples of current issues in the multicultural classroom”, Journal of Education and Practice, Vol. 6/10, pp. 86-89, https://www.iiste.org/Journals/index.php/JEP/article/view/21441.
[28] American Academy of Arts & Sciences (2017), “I-10b: Gender Distribution of Teachers in Public Primary and Secondary Schools, by Main Teaching Assignment, 2015-2016”, Humanities Indicators, www.humanitiesindicators.org/content/indicatordoc.aspx?i=168 (accessed on 21 March 2019).
[30] Antecol, H., O. Eren and S. Ozbeklik (2012), “The Effect of Teacher Gender on Student Achievement in Primary School: Evidence from a Randomized Experiment”, IZA Discussion Paper Series, No. 6453, Forschungsinstitut zur Zukunft der Arbeit Institute for the Study of Labor, http://ftp.iza.org/dp6453.pdf.
[48] Banting, K. and W. Kymlicka (2004), “Do Multiculturalism Policies Erode the Welfare State?”, Working Paper, No. 33, School of Policy Studies - Queen’s University, Kingston, Ontario, https://qspace.library.queensu.ca/bitstream/handle/1974/14872/Banting_et_al_2004_Do_ Multiculturalism_Policies.pdf;jsessionid=31D95A23966274256A801CEC355C4859?sequence=1.
[6] Barber, M. and M. Mourshed (2009), Shaping the Future: How Good Education Systems Can Become Great in the Decade Ahead, Report on the International Education Roundtable, 7 July 2009, Singapore, McKinsey & Company, London.
[77] Battistich, V. et al. (1997), “Caring school communities”, Educational Psychologist, Vol. 32/3, pp. 137-151, https://doi.org/10.1207/ s15326985ep3203_1.
[21] Beam, A., R. Claxton and S. Smith (2016), “Challenges for novice school leaders: Facing today’s issues in school administration”, Faculty Publications and Presentations, 233, http://digitalcommons.liberty.edu/educ_fac_pubs/233/.
[32] Beilock, S. et al. (2010), “Female teachers’ math anxiety affects girls’ math achievement”, Proceedings of the National Academy of Sciences of the United States of America (PNAS), Vol. 107/5, pp. 1860-1863, https://doi.org/10.1073/pnas.0910967107.
[107] Bénabou, R., F. Kramarz and C. Prost (2009), “The French zones d’éducation prioritaire: Much ado about nothing?”, Economics of Education Review, Vol. 28/3, pp. 345-356, https://doi.org/10.1016/j.econedurev.2008.04.005.
[49] Borman, G. and M. Dowling (2010), “Schools and inequality: A multilevel analysis of Coleman’s equality of educational opportunity data”, Teachers College Record, Vol. 112/5, pp. 1201-1246, www.tcrecord.org/library/abstract.asp?contentid=15664.
[63] Bowen, E. and F. Salsman (1979), “Integrating multiculturalism into a teacher-training program”, The Journal of Negro Education, Vol. 48/3, pp. 390-395, https://doi.org/10.2307/2295055.
[19] Branch, G., E. Hanuschek and S. Rivkin (2013), “School leaders matter”, Education Next, Vol. 13/1, www.educationnext.org/school-leaders-matter.
[78] Bryk, A. and B. Schneider (2002), Trust in Schools: A Core Resource for Improvement, Russell Sage Foundation, New York, NY.
[58] Chua, S. (2010), “Singapore’s language policy and its globalised concept of Bi (tri) lingualism”, Current Issues in Language Planning, Vol. 11/4, pp. 413-429, https://doi.org/10.1080/14664208.2010.546055.
[108] Clotfelter, C. et al. (2008), “Would higher salaries keep teachers in high-poverty schools? Evidence from a policy intervention in North Carolina”, Journal of Public Economics, Vol. 92/5-6, pp. 1352-1370, https://doi.org/10.1016/J.JPUBECO.2007.07.003.
[79] Cohen, J. et al. (2009), “School climate: Research, policy, practice, and teacher education”, Teachers College Record, Vol. 111/1, pp. 180-213.
[53] Cooc, N. (2018), “Who Needs Special Education Professional Development?: International Trends from TALIS 2013”, OECD Education Working Papers, No. 181, OECD Publishing, Paris, https://dx.doi.org/10.1787/042c26c4-en.
[101] Darling-Hammond, L. and A. Lieberman (eds.) (2012), Teacher Education around the World: Changing Policies and Practices, Routledge, Abingdon.
[75] de Abreu, G. (2006), “Cultural identities in the multiethnic mathematical classroom”, in Bosch, M. (ed.), Proceedings of the Fourth Congress of the European Society for Research in Mathematics Education, 17-21 February 2005, Sant Feliu de Guíxols, Spain, FUNDEMI IQS, Barcelona, www.mathematik.uni-dortmund.de/∼erme/CERME4/.
[33] Dee, T. (2005), “A teacher like me: Does race, ethnicity, or gender matter?”, American Economic Review, Vol. 95/2, pp. 158-165, https://doi.org/10.1257/000282805774670446.
[104] Di Ludovico, M. et al. (2018), “Remarks on damage and response of school buildings after the Central Italy earthquake sequence”, Bulletin of Earthquake Engineering, pp. 1-22, https://doi.org/10.1007/s10518-018-0332-x.
[109] Dieterle, S. (2015), “Class-size reduction policies and the quality of entering teachers”, Labour Economics, Vol. 36, pp. 35-47, https://doi.org/10.1016/J.LABECO.2015.07.005.
[29] Drudy, S. (2008), “Gender balance/gender bias: The teaching profession and the impact of feminisation”, Gender and Education, Vol. 20/4, pp. 309-323, https://doi.org/10.1080/09540250802190156.
[40] Echazarra, A. et al. (2016), “How teachers teach and students learn: Successful strategies for school”, OECD Education Working Papers, No. 130, OECD Publishing, Paris, https://dx.doi.org/10.1787/5jm29kpt0xxx-en.
[71] Ely, R. and D. Thomas (2001), “Cultural diversity at work: The effects of diversity perspectives on work group processes and outcomes”, Administrative Science Quarterly, Vol. 46/2, pp. 229-273, https://doi.org/10.2307/2667087.
[80] Engel, L., D. Rutkowski and L. Rutkowski (2009), “The harsher side of globalisation: Violent conflict and academic achievement”, Globalisation, Societies and Education, Vol. 7/4, pp. 433-456, https://doi.org/10.1080/14767720903412242.
[87] Epstein, J. and J. McPartland (1976), “The concept and measurement of the quality of school life”, American Educational Research Journal, Vol. 13/1, pp. 15-30, https://doi.org/10.3102/00028312013001015.
[91] Estonian Union for Child Welfare (2015), Kiusamisest vabaks! (Free of Bullying), http://kiusamisestvabaks.ee/ (accessed on 12 April 2019).
[74] European Commission/EACEA/Eurydice (2019), “Integrating Students from Migrant Backgrounds into Schools in Europe: National Policies and Measures”, Eurydice Report, Publications Office of the European Union, Luxembourg, https://doi.org/10.2797/222073.
[36] Federal Ministry for Digital and Economic Affairs, Austria (2019), Bundesrecht konsolidiert: Gesamte Rechtsvorschrift für Bundes-Gleichbehandlungsgesetz, Fassung vom 22.03.2019 [Consolidated Federal Law: Complete Legal Provision for Federal Equal Treatment Act, version from 22.03.2019], www.ris.bka.gv.at/GeltendeFassung.wxe?Abfrage=Bundesnormen&Gesetzesnummer=10008858 (accessed on 22 March 2019).
[94] Finnan, C., K. Schnepel and L. Anderson (2003), “Powerful learning environments: The critical link between school and classroom cultures”, Journal of Education for Students Places At Risk, Vol. 8/4, pp. 391-418, https://doi.org/10.1207/S15327671ESPR0804_2.
[50] Firmino, J. et al. (2018), “Class Composition and Student Achievement: Evidence from Portugal”, FEUNL Working Paper Series, No. 624, Universidade Nova de Lisboa - Faculdade de Economia, Lisbon, https://doi.org/10.2139/ssrn.3146904.
[84] Fulton, K., I. Yoon and C. Lee (2005), Induction Into Learning Communities, National Commission on Teaching and America’s Future, Washington, DC, https://files.eric.ed.gov/fulltext/ED494581.pdf.
[45] Gay, G. (2014), “Teachers’ beliefs about cultural diversity: Problems and possibilities”, in Fives, H. and M. Gregoire Gill (eds.), International Handbook of Research on Teachers’ Beliefs, Routledge, New York, https://doi.org/10.4324/9780203108437.
[95] Ghaith, G. (2003), “The relationship between forms of instruction, achievement and perceptions of classroom climate”, Educational Research, Vol. 45/1, pp. 83-93, https://doi.org/10.1080/0013188032000086145.
[93] Government of Alberta (2019), Bullying prevention for educators: Learn how to recognize, prevent and respond to signs of bullying in school, www.alberta.ca/bullying-prevention-for-educators.aspx (accessed on 8 April 2019).
[59] Graham, H., R. Minhas and G. Paxton (2016), “Learning problems in children of refugee background: A systematic review”, Pediatrics, Vol. 137/6, https://doi.org/10.1542/peds.2015-3994.
[90] Guo, P. and A. Higgins-D’Alessandro (2011), The place of teachers’ views of teaching in promoting positive school culture and student prosocial and academic outcomes, Paper presented at the Association for Moral Education annual conference, Nanjing, China.
[11] Hallinger, P. and R. Heck (2010), “Leadership for learning: Does collaborative leadership make a difference in school improvement?”, Educational Management Administration & Leadership, Vol. 38/6, pp. 654-678, https://doi.org/10.1177/1741143210379060.
[99] Harris-Van Keuren, C., I. Silova and S. McAllister (2015), Implementing EFA strategy no. 9: The evolution of the status of the teaching profession (2000-2015) and the impact on the quality of education in developing countries: three case studies, Background Paper for the Global Monitoring Report 2015, ED/EFA/MRT/2015/PI/08, UNESCO, Paris, https://unesdoc.unesco.org/ark:/48223/pf0000232402.
[60] Hart, R. (2009), “Child refugees, trauma and education: interactionist considerations on social and emotional needs and development”, Educational Psychology in Practice, Vol. 25/4, pp. 351-368, https://doi.org/10.1080/02667360903315172.
[9] Hattie, J. (2009), Visible Learning: A Synthesis of over 800 Meta-Analyses Relating to Achievement, Routledge, London.
[76] He, J. and K. Kubacka (2015), “Data comparability in the teaching and learning international survey (TALIS) 2008 and 2013”, OECD Education Working Papers, No. 124, OECD Publishing, Paris, https://dx.doi.org/10.1787/5jrp6fwtmhf2-en.
[31] Holmlund, H. and K. Sund (2006), “Is the gender gap in school performance affected by the sex of the teacher?”, Labour Economics, Vol. 15, pp. 37-53, https://doi.org/10.1016/j.labeco.2006.12.002.
[12] Horng, E. and S. Loeb (2010), “New thinking about instructional leadership”, Phi Delta Kappan, Vol. 92/3, pp. 66-69, https://doi.org/10.1177/003172171009200319.
[89] Hoy, W., J. Hannum and M. Tschannen-Moran (1998), “Organizational climate and student achievement: A parsimonious and longitudinal view”, Journal of School Leadership, Vol. 8/4, pp. 336-359, https://doi.org/10.1177/105268469800800401.
[81] Hoy, W., C. Tarter and A. Hoy (2006), “Academic optimism of schools: A force for student achievement”, American Educational Research Journal, Vol. 43/3, pp. 425-446, https://doi.org/10.3102/00028312043003425.
[85] Hoy, W. and A. Woolfolk (1993), “Teachers’ sense of efficacy and the organizational health of schools”, The Elementary School Journal, Vol. 93/4, pp. 355-372, https://doi.org/10.1086/461729.
[64] Jackson, T. and G. Boutte (2018), “Exploring culturally relevant/responsive pedagogy as praxis in teacher education”, The New Educator, Vol. 14/2, pp. 87-90, https://doi.org/10.1080/1547688X.2018.1426320.
[66] Janus, A. (2010), “The influence of social desirability pressures on expressed immigration attitudes”, Social Science Quarterly, Vol. 91/4, pp. 928-946, https://doi.org/10.1111/j.1540-6237.2010.00742.x.
[110] Jepsen, C. and S. Rivkin (2009), “Class size reduction and student achievement”, Journal of Human Resources, Vol. 44/1, pp. 223-250, https://doi.org/10.3368/jhr.44.1.223.
[35] Jones, S. and K. Dindia (2004), “A meta-analytic perspective on sex equity in the classroom”, Review of Educational Research, Vol. 74/4, pp. 443-471, https://doi.org/10.3102/00346543074004443.
[111] Karsten, S. (2006), “Policies for disadvantaged children under scrutiny: The Dutch policy compared with policies in France, England, Flanders and the USA”, Comparative Education, Vol. 42/2, pp. 261-282, https://doi.org/10.1080/03050060600628694.
[46] Kielly, M. et al. (2014), “Teachers’ beliefs about students with special needs and inclusion”, in Fives, H. and M. Gregoire Gill (eds.), International Handbook of Research on Teachers’ Beliefs, Routledge, New York, https://doi.org/10.4324/9780203108437.
[96] Kraft, M., W. Marinell and D. Shen-Wei Yee (2016), “School organizational contexts, teacher turnover, and student achievement”, American Educational Research Journal, Vol. 53/5, pp. 1411-1449, https://doi.org/10.3102/0002831216667478.
[3] Kuhn, P. and C. Weinberger (2005), “Leadership skills and wages”, Journal of Labor Economics, Vol. 23/3, pp. 395-436, http://dx.doi. org/10.1086/430282.
[10] Kyriakides, L., C. Christoforou and C. Charalambous (2013), “What matters for student learning outcomes: A meta-analysis of studies exploring factors of effective teaching”, Teaching and Teacher Education, Vol. 36, pp. 143-152, https://doi.org/10.1016/j.tate.2013.07.010.
[102] Lai, M. and L. Lo (2007), “Teacher professionalism in educational reform: The experiences of Hong Kong and Shanghai”, Compare: A Journal of Comparative and International Education, Vol. 37/1, pp. 53-68, https://doi.org/10.1080/03057920601061786.
[42] Le Donné, N., P. Fraser and G. Bousquet (2016), “Teaching Strategies for Instructional Quality: Insights from the TALIS-PISA Link Data”, OECD Education Working Papers, No. 148, OECD Publishing, Paris, https://dx.doi.org/10.1787/5jln1hlsr0lr-en.
[34] Lim, J. and J. Meer (2017), “The impact of teacher-student gender matches: Random assignment evidence from South Korea”, Journal of Human Resources, Vol. 52/4, pp. 979-997, https://doi.org/10.3368/jhr.52.4.1215-7585r1.
[23] Lim, S. (2013), “Lehrerausbildung in Deutschland”, in Lehrerausbildung und Abstimmungsprobleme des Lehrermarkts, Springer Fachmedien Wiesbaden, Wiesbaden, https://doi.org/10.1007/978-3-658-00342-5_1.
[47] Lucas, T., A. Villegas and A. Martin (2014), “Teachers’ beliefs about English language learners”, in Fives, H. and M. Gregoire Gill (eds.), International Handbook of Research on Teachers’ Beliefs, Routledge, New York, https://doi.org/10.4324/9780203108437.
[82] Martin, M. et al. (2013), “Effective schools in reading, mathematics, and science at the fourth grade”, in Martin, M. and I. Mullis (eds.), TIMSS and PIRLS 2011: Relationships Among Reading, Mathematics, and Science Achievement at the Fourth Grade - Implications for Early Learning, TIMSS & PIRLS International Study Center, Lynch School of Education, Boston College and International Association for the Evaluation of Educational Achievement (IEA), Chestnut Hill, MA, https://timssandpirls.bc.edu/timsspirls2011/downloads/TP11_Chapter_3.pdf.
[97] Maxwell, S. et al. (2017), “The impact of school climate and school identification on academic achievement: Multilevel modeling with student and teacher data”, Frontiers in Psychology, Vol. 8, https://doi.org/10.3389/fpsyg.2017.02069.
[83] Nilsen, T. and J. Gustafsson (2014), “School emphasis on academic success: Exploring changes in science performance in Norway between 2007 and 2011 employing two-level SEM”, Educational Research and Evaluation, Vol. 20/4, pp. 308-327, https://doi.org/10.1080 /13803611.2014.941371.
[24] Nusche, D. et al. (2016), OECD Reviews of School Resources: Denmark 2016, OECD Reviews of School Resources, OECD Publishing, Paris, https://dx.doi.org/10.1787/9789264262430-en.
[2] OECD (2019), Trends Shaping Education 2019, OECD Publishing, Paris, https://dx.doi.org/10.1787/trends_edu-2019-en.
[15] OECD (2018), Education at a Glance 2018: OECD Indicators, OECD Publishing, Paris, https://dx.doi.org/10.1787/eag-2018-en.
[70] OECD (2018), Education Policy Outlook: Kazakhstan, OECD, Paris, www.oecd.org/education/Education-Policy-Outlook-Country-Profile-Kazakhstan-2018.pdf.
[112] OECD (2018), Effective Teacher Policies: Insights from PISA, PISA, OECD Publishing, Paris, https://dx.doi.org/10.1787/9789264301603-en.
[69] OECD (2018), Equity in Education: Breaking Down Barriers to Social Mobility, PISA, OECD Publishing, Paris, https://dx.doi.org/10.1787/9789264073234-en.
[52] OECD (2018), International Migration Outlook 2018, OECD Publishing, Paris, https://dx.doi.org/10.1787/migr_outlook-2018-en.
[4] OECD (2018), The Future of Education and Skills: Education 2030, OECD, Paris, www.oecd.org/education/2030/E2030%20Position%20 Paper% 20 (05.04.2018).pdf.
[57] OECD (2018), The Resilience of Students with an Immigrant Background: Factors that Shape Well-being, OECD Reviews of Migrant Education, OECD Publishing, Paris, https://dx.doi.org/10.1787/9789264292093-en.
[22] OECD (2017), Pensions at a Glance 2017: OECD and G20 Indicators, OECD Publishing, Paris, https://dx.doi.org/10.1787/pension_glance-2017-en.
[103] OECD (2017), The Funding of School Education: Connecting Resources and Learning, OECD Reviews of School Resources, OECD Publishing, Paris, https://dx.doi.org/10.1787/9789264276147-en.
[44] OECD (2016), PISA 2015 Results (Volume II): Policies and Practices for Successful Schools, PISA, OECD Publishing, Paris, https://dx.doi.org/10.1787/9789264267510-en.
[16] OECD (2016), School Leadership for Learning: Insights from TALIS 2013, TALIS, OECD Publishing, Paris, https://dx.doi.org/10.1787/9789264258341-en.
[100] OECD (2016), Supporting Teacher Professionalism: Insights from TALIS 2013, TALIS, OECD Publishing, Paris, https://dx.doi.org/10.1787/9789264248601-en.
[1] OECD (2016), Trends Shaping Education 2016, OECD Publishing, Paris, https://dx.doi.org/10.1787/trends_edu-2016-en.
[38] OECD (2015), Immigrant Students at School: Easing the Journey towards Integration, OECD Reviews of Migrant Education, OECD Publishing, Paris, https://dx.doi.org/10.1787/9789264249509-en.
[20] OECD (2014), TALIS 2013 Results: An International Perspective on Teaching and Learning, TALIS, OECD Publishing, Paris, https://dx.doi.org/10.1787/9789264196261-en.
[37] OECD (2013), PISA 2012 Results: Excellence through Equity (Volume II): Giving Every Student the Chance to Succeed, PISA, OECD Publishing, Paris, https://dx.doi.org/10.1787/9789264201132-en.
[65] OECD (2012), Untapped Skills: Realising the Potential of Immigrant Students, PISA, OECD Publishing, Paris, https://doi.org/10.1787/9789264172470-en.
[14] OECD (2009), Creating Effective Teaching and Learning Environments: First Results from TALIS, OECD Publishing, Paris, https://dx.doi.org/10.1787/9789264072992-en.
[25] OECD (2005), Teachers Matter: Attracting, Developing and Retaining Effective Teachers, Education and Training Policy, OECD Publishing, Paris, https://dx.doi.org/10.1787/9789264018044-en.
[41] OECD (2004), Learning for Tomorrow’s World: First Results from PISA 2003, PISA, OECD Publishing, Paris, https://doi.org/10.1787/9789264006416-en.
[17] Orphanos, S. and M. Orr (2014), “Learning leadership matters”, Educational Management Administration & Leadership, Vol. 42/5, pp. 680-700, https://doi.org/10.1177/1741143213502187.
[54] Peters, S. (2007), “Education for all? A historical analysis of international inclusive education policy and individuals with disabilities”, Journal of Disability Policy Studies, Vol. 18/2, pp. 98-108, https://doi.org/10.1177/10442073070180020601.
[73] Plaut, V., K. Thomas and M. Goren (2009), “Is multiculturalism or color blindness better for minorities?”, Psychological Science, Vol. 20/4, pp. 444-446, https://doi.org/10.1111/j.1467-9280.2009.02318.x.
[18] Pont, B., D. Nusche and H. Moorman (2008), Improving School Leadership, Volume 1: Policy and Practice, OECD Publishing, Paris, https://dx.doi.org/10.1787/9789264044715-en.
[7] Reimers, F. and C. Chung (2016), Teaching and Learning for the Twenty-First Century: Educational Goals, Policies and Curricula from Six Nations, Harvard Education Press, Cambridge, MA.
[72] Schachner, M. et al. (2016), “Cultural diversity climate and psychological adjustment at school: Equality and inclusion versus cultural pluralism”, Child Development, Vol. 87/4, pp. 1175-1191, https://doi.org/10.1111/cdev.12536.
[13] Scheerens, J. and R. Bosker (1997), The Foundations of Educational Effectiveness, Pergamon, Oxford.
[67] Simmonds, S. (2017), “Teachers as curriculum leaders: Towards promoting gender equity as a democratic ideal”, Educational Research for Social Change, Vol. 6/2, pp. 16-28, https://doi.org/10.17159/2221-4070/2017/v6i2a2.
[39] Sirin, S. (2005), “Socioeconomic status and academic achievement: A meta-analytic review of research”, Review of Educational Research, Vol. 75/3, pp. 417-453, https://doi.org/10.3102/00346543075003417.
[43] Stanovich, P. and A. Jordan (1998), “Canadian teachers’ and principals’ beliefs about inclusive education as predictors of effective teaching in heterogeneous classrooms”, The Elementary School Journal, Vol. 98/3, pp. 221-238, https://doi.org/10.1086/461892.
[61] Taylor, S. and R. Sidhu (2012), “Supporting refugee students in schools: What constitutes inclusive education?”, International Journal of Inclusive Education, Vol. 16/1, pp. 39-56, https://doi.org/10.1080/13603110903560085.
[98] Thomas, D. and G. Bass (1992), “An analysis of the relationship between school climate and the implementation of middle school practices”, Research in Middle Level Education, Vol. 16/1, pp. 1-12, https://doi.org/10.1080/10825541.1992.11669998.
[68] UNESCO (2018), Global Education Monitoring Report Gender Review 2018: Meeting our Commitments to Gender Equality in Education, UNESCO, Paris, https://unesdoc.unesco.org/ark:/48223/pf0000261593.
[5] UNESCO (2016), Education 2030: Incheon Declaration and Framework for Action for the Implementation of Sustainable Development Goal 4, UNESCO, Paris, http://uis.unesco.org/sites/default/files/documents/education-2030-incheon-framework-for-action-implementation-of-sdg4-2016-en_2.pdf.
[8] UNESCO (2016), Preparing and Supporting Teachers in the Asia-Pacific to Meet the Challenges of Twenty-first Century Learning: Regional Synthesis Report, ERINet Asia-Pacific Regional Policy Series: 2015 ERINet Regional Study on Transversal Competencies in Education Policy and Practice (Phase III), UNESCO, Paris and Bangkok, https://unesdoc.unesco.org/ark:/48223/pf0000246852.
[27] UNESCO Institute for Statistics (2009), Global Education Digest 2009: Comparing Education Statistics Across the World, UNESCO Institute for Statistics, Montreal, https://unesdoc.unesco.org/ark:/48223/pf0000183249.
[26] UNESCO Institute for Statistics (2006), Teachers and Educational Quality: Monitoring Global Needs for 2015, UNESCO Institute for Statistics, Montreal, https://unesdoc.unesco.org/ark:/48223/pf0000145754.
[56] United Nations (2015), Transforming our World: The 2030 Agenda for Sustainable Development, United Nations, New York, NY, www.un.org/ga/search/view_doc.asp?symbol=A/RES/70/1&Lang=E.
[88] Vollmer, G. (2000), “Praise and stigma: Teachers’ constructions of the ‘typical ESL student’”, Journal of Intercultural Studies, Vol. 21/1, pp. 53-66, https://doi.org/10.1080/07256860050000795.
[106] Watt, H. and P. Richardson (2008), “Motivations, perceptions, and aspirations concerning teaching as a career for different types of beginning teachers”, Learning and Instruction, Vol. 18/5, pp. 408-428, https://doi.org/10.1016/j.learninstruc.2008.06.002.
[105] Watt, H. et al. (2012), “Motivations for choosing teaching as a career: An international comparison using the FIT-Choice scale”, Teaching and Teacher Education, Vol. 28/6, pp. 791-805, https://doi.org/10.1016/j.tate.2012.03.003.
[86] Weiss, E. (1999), “Perceived workplace conditions and first-year teachers’ morale, career choice commitment, and planned retention: A secondary analysis”, Teaching and Teacher Education, Vol. 15/8, pp. 861-879, https://doi.org/10.1016/S0742-051X (99) 00040-2.
[51] Willms, J. (2010), “School composition and contextual effects on student outcomes”, Teachers College Record, Vol. 112/4, pp. 1008-1037, www.tcrecord.org/Content.asp?ContentId=15658.
[55] Winzer, M. and K. Mazurek (2014), “The Convention on the Rights of Persons with Disabilities: Notes on genealogy and prospects”, Journal of International Special Needs Education, Vol. 17/1, pp. 3-12, https://doi.org/10.9782/2159-4341-17.1.3.
Notes
← 1. The OECD average corresponds to the arithmetic mean of the estimates of the OECD countries and economies that participate in TALIS, with adjudicated data.
← 2. In the United States, gender imbalances are less pronounced in science, computers, mathematics, technical and vocational fields.
← 3. Bulgaria, Croatia, the Czech Republic, Estonia, Georgia, Hungary, Kazakhstan, Lithuania, the Russian Federation, the Slovak Republic and Slovenia.
← 4. In Australia, the increased feminisation of the profession mainly took place between 2013 and 2018, rising from 59% in both 2008 and 2013 to 62% in 2018.
← 5. The equal feminisation line is the diagonal in the figure. It represents a theoretical situation of perfect equality in the proportion of women among teachers and their proportion among principals.
← 6. In Sweden, this increase is not the result of a deliberate policy, but the continuation of a long-term trend, as the proportion of female principals has been increasing for 30 years. The proportion of female teachers is high, and principals are, in general, recruited from the ranks of teachers.
← 7. In Austria, the rise in the share of female principals is related to the high proportion of female teachers and principals generally being recruited from the ranks of teachers, as well as an increase in the number of women aiming for jobs with more responsibilities. The government is also making efforts to support the representation of women in leadership positions through policies such as the Federal Equal Treatment Act.
← 8. In Norway, this increase is not the result of a deliberate policy, but rather the consequence of development over time, with increasingly more female teachers at all levels and now also in educational leadership positions.
← 9. What matters to students’ psychological and social well-being is not cultural differences per se, but rather the way they are perceived and responded to by others (e.g. negative attitudes towards minority groups), or the way students themselves deal with their cultural differences, irrespective of the friendliness of the surrounding climate.
← 10. Effective teaching was measured in this study through a classroom observations checklist instrument based on a framework for effective teaching that incorporated principles of social constructivism.
← 11. In the following analyses, a 30% threshold is used to compare schools and classrooms with more than 30% of students from socio-economically disadvantaged homes with schools with up to 30% of such students. Lower thresholds are used with regard to students with migrant backgrounds, students whose first language is different from the language(s) of instruction, students with special education needs (above 10% versus up to 10%) and students who are refugees (above 1% versus none) to account for smaller overall intake of these types of students.
← 12. The Convention on the Rights of Persons with Disabilities, the Salamanca Declaration, the Educational for All Movement and the Millennium Development Goals have established goals for improving access to education for children with disabilities. Most recently, education for persons with disabilities is specifically referenced in UN SDG Goal 4, Target 4.5: “By 2030, eliminate gender disparities in education and ensure equal access to all levels of education and vocational training for the vulnerable, including persons with disabilities, indigenous peoples and children in vulnerable situations” (UNESCO, 2016, p. 21[5]).
← 13. Questions about the share of immigrant students or students with an immigrant background in the school and in the classroom were added to the TALIS 2018 questionnaires relatively late in the design process and were, therefore, not field-trialled. Although analysis of the main survey data did not reveal any particular issue with these questions, they must be interpreted with caution.
← 14. For the purpose of these trends analyses, only statistically significant differences equal to or greater than 5 percentage points in the proportion of teachers teaching a classroom with a given composition are reported, in order to emphasise deep and rapid changes in the classroom composition. Other education systems often face trends that are similar but of a lower order of magnitude or not statistically significant.
← 15. Linguistic diversity can evolve due to an influx of foreign migrants or refugees and/or, increased regional mobility in multilingual societies, but also as a result of changes in education policies that have an impact on linguistic grouping of students in schools.
← 16. The referenced study suggested that almost one out of three (31%) Americans who were in favour of cutting off immigration hid their restrictionist sentiments when asked directly.
← 17. In the case of Alberta (Canada), caution is required when interpreting these data, given large standard errors relative to other countries.
← 18. Denmark, the Slovak Republic and Sweden are in the top 20 least unequal countries (as measured by the Gini index, below 30 for the three of them, in 2015), followed by Japan (Gini index: 32, in 2008) and Viet Nam (Gini index: 35, in 2016). Data available at https://data.worldbank. org/indicator/si.pov.gini.
← 19. As this information derives from principals’ reports, the number of observations per country is too low to undertake regression analyses on the factors associated with equity-related policies and practices in schools.
← 20. Source: OECD, TALIS 2018 Database.
← 21. In Finland, one explanation for this pattern is that involvement of organisations external to the school to support multicultural activities is less common than in many other countries, and there are not many organisations doing such work.
← 22. The relevant section of the TALIS questionnaire includes questions about “school policies and practices concerned with diversity, with an emphasis on cultural diversity”. It states that: “‘Diversity’ refers to the recognition of and appreciation for differences in the backgrounds of students and staff. In the case of cultural diversity it refers most notably to cultural or ethnic backgrounds.”
← 23. The scale of self-related efficacy in multicultural classrooms has only reached metric invariance, suggesting that comparisons across countries at item level need to be interpreted cautiously (TALIS 2018 Technical Report).
← 24. In both the French and Flemish communities of Belgium, the high reports from principals might reflect the national context, with media reports of hidden violence at school in recent years, and extensive training of principals and teachers as a result to identify bullying and act effectively upon it. It is possible that the anti-bullying policies put in place have heightened principals’ awareness of these issues.
← 25. In Australia, insufficient response rates by principals affect comparability of the data, and the figures need to be interpreted with caution.
← 26. The eight countries are: Alberta (Canada), Chile, Croatia, Estonia, Korea, Latvia, Portugal and Spain.
← 27. Indeed, the way students whose first language is different from the language of instruction are allocated to classes may be related to unobserved teachers’ characteristics.
← 28. In Norway, a possible explanation may be the emphasis of teachers’ professional development activities on classroom management and classroom climate over the last years.
← 29. See Chapter 2 for more information about this teaching strategy.
← 30. After controlling for teacher and classroom characteristics, CABA (Argentina) and France no longer belong to the list of country exceptions (Table I.3.62).
← 31. One possible explanation for this pattern could be that resource shortages are only reported when they are perceived to affect instruction. If principals in countries with fewer economic means have never had certain resources, it would be hard for them to say whether or not having those resources affects instruction, which may obfuscate the relationship between GDP/education expenditure and shortages.
← 32. In the French Community of Belgium, students who did not pass their primary certificate are formally identified with learning difficulties (although they do not suffer from any kind of disability) and are provided extra support and additional human and financial resources for their lower secondary school. Teachers and principals are likely to have associated these student profiles as special needs students in the TALIS survey, resulting in a large overestimation of this group.
← 33. This ranking of spending priorities reported in the chapter does not account for any statistical testing of significant differences between the ranks.
← 34. Chapter 5 shows that these countries also display high levels of participation in professional development.
← 35. Alberta (Canada) and Finland also have less than half of their teachers rating salary improvements as of high importance, but this issue is nevertheless in their top three priority areas for additional spending.
← 36. The difference is statistically significant and exceeds 5 percentage points in Belgium, Croatia, the Czech Republic, Estonia, Finland, Georgia, Hungary, Italy, Kazakhstan, Norway, the Slovak Republic and Turkey.
← 37. The difference in favour of teachers working in schools with large proportions of students from socio-economically disadvantaged homes exceeds 5 percentage points in Hungary and Sweden.
← 38. In the analyses, class size is measured by the number of students enrolled in a particular class (referred to as target class) that the teacher was asked to identify and describe.
← 39. There are very few countries with a significant relationship between classroom composition (measured by the concentration of students whose first language is different from the language(s) of instruction, special needs students, students with behavioural problems, students from disadvantaged homes, academically gifted students and students with a refugee status) and a teacher’s tendency to report reducing class size as a spending priority.