copy the linklink copied! Responsiveness of health systems to patient needs
Beyond providing access to medical services, health systems are increasingly focusing on improving patient experience when interacting with health care providers, especially since these have become part of their performance framework. Health systems are seeking to become more patient-centered, which involves involving patients in decisions regarding their treatment and promoting accountability and transparency from providers.
Given the importance of measuring, monitoring and using patient-reported data for improving health system performance, many countries collect patient-reported experience measures (PREMs), covering samples of patients who have experienced inpatient or outpatient care. The OECD started the Patient-Reported Indicators Surveys (PaRIS) initiative in 2018. Additionally, the Commonwealth Fund International Health Policy Survey collects data on patient experiences in 11 OECD countries. The 2017 round focused on older adults, aged 65 and above.
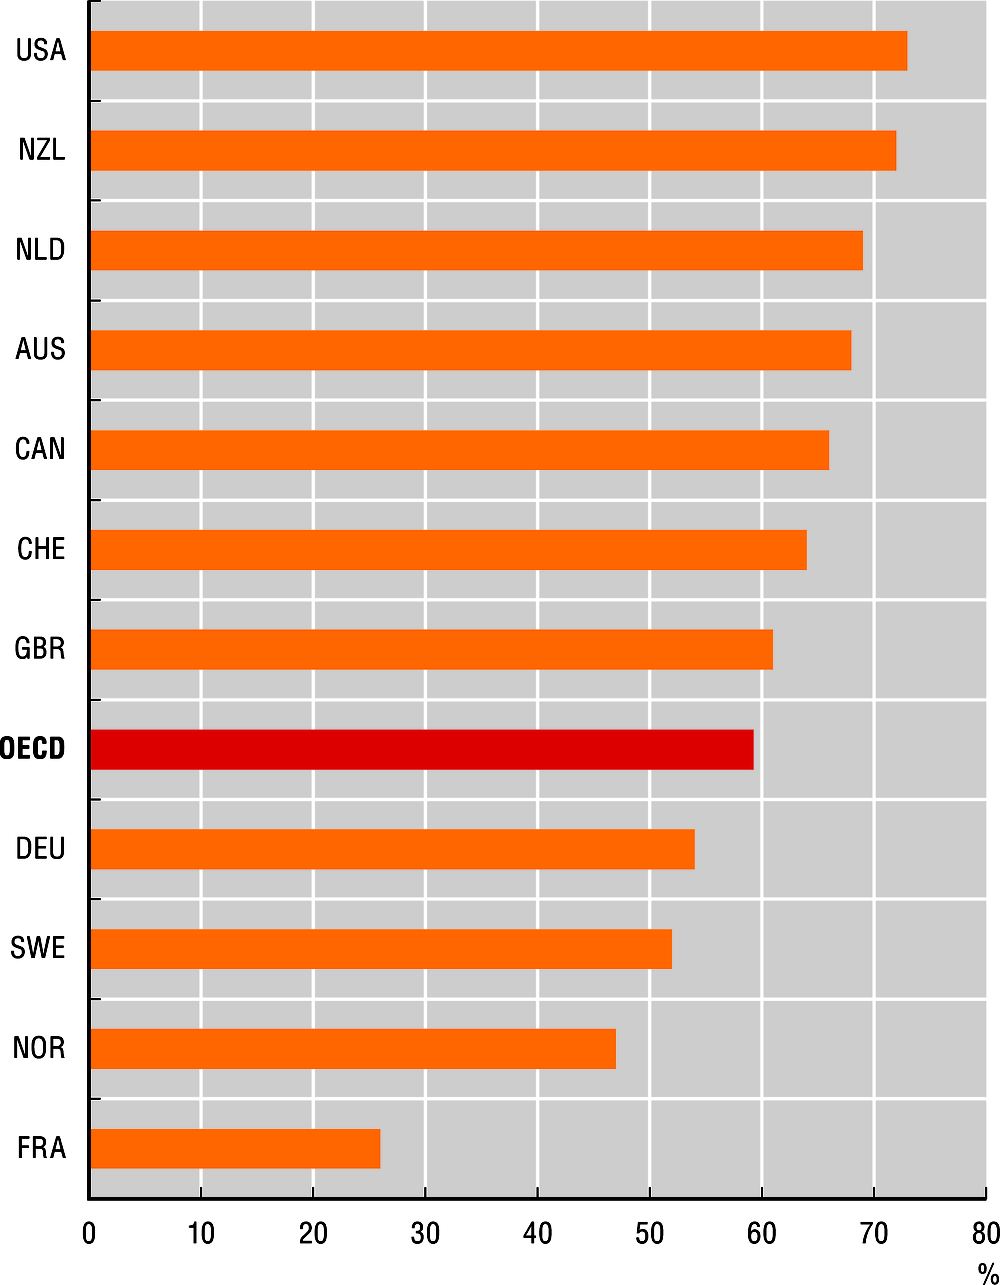
Communication between doctors and patients is one of the aspects considered in PREMs. Providing patients with relevant information of, and influence over their treatment is key to including them as co-producers of their own health, especially regarding self-care practices. According to the Commonwealth Fund Survey in 2017, on average, 59% of older patients in OECD countries reported that their regular doctor involves them in decisions regarding care and treatment. Some 73% of patients in the United States and 72% in New Zealand indicated being consulted by their regular doctor, while only 26% of French patients reported being involved in such decisions.
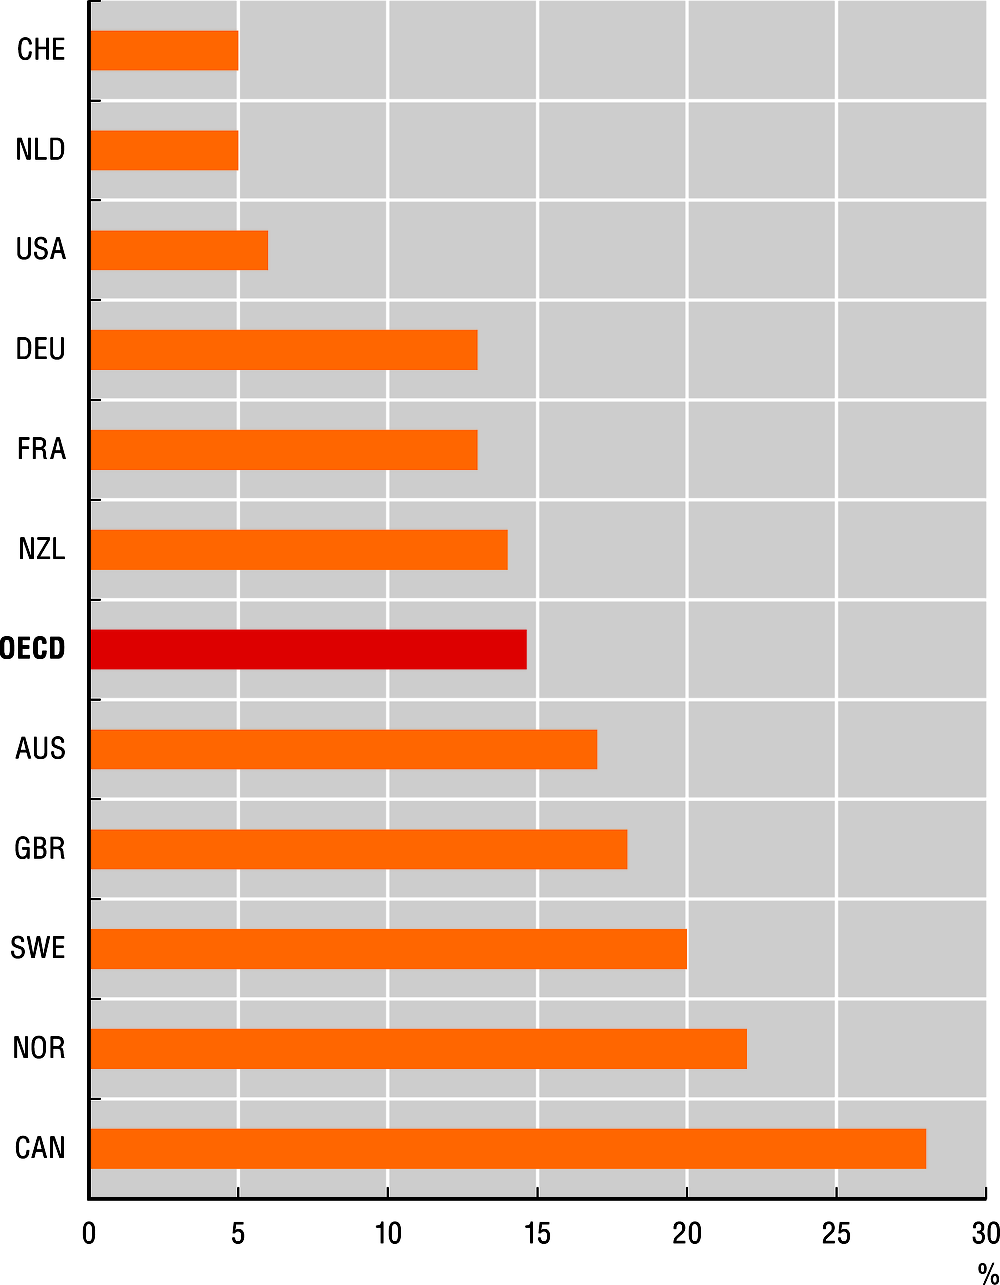
Long waiting lists can worsen patient symptoms (Siciliani, Borowitz and Moran, 2013) and have a negative impact on patient experience. According to the 2017 Commonwealth Fund Survey, on average 15% of older adults had to wait two months or longer for an appointment with a specialist after a referral by a general practitioner. In Switzerland and the Netherlands only 5% of respondents reported having such a long wait, while the proportion rose to 22% in Norway and 28% in Canada.
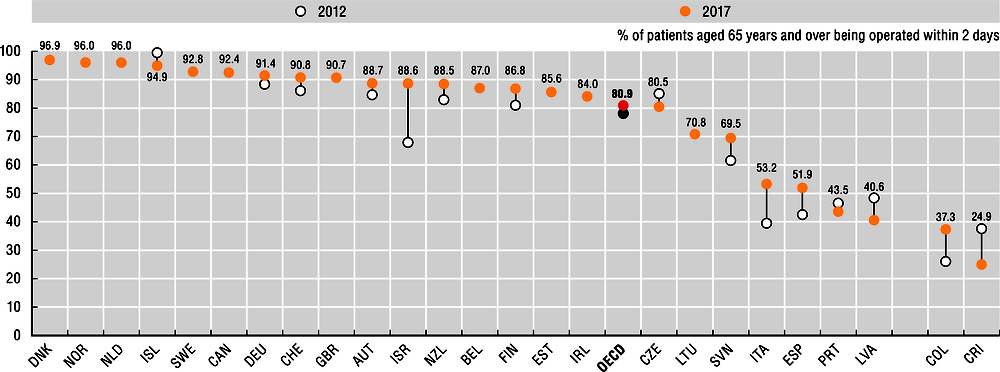
Surgical intervention is generally required to repair or replace the hip joint following a hip fracture. There is consensus that early surgical intervention maximises patient outcomes and minimises the risk of complications (OECD, forthcoming). On average, 81% of people who needed a hip replacement surgery were operated on within two days in 2017 (a 3 p.p. increase from 2012). Denmark, Norway and the Netherlands have the highest rate, with over 96% of patients being operated within two days. This was the case for less than half of the patients in Latvia and Portugal. Israel has shown the greatest improvement, from 68% to 89% since 2012.
Hip fracture surgery initiation after admission to hospital is defined as the proportion of patients aged 65 years and over admitted to hospital in a specified year with a diagnosis of upper femur fracture, who had surgery initiated within two calendar days of their admission to hospital.
Data for figures 11.14 and 11.15 come from the 2017 Commonwealth Fund International Health Policy Survey of Older Adults (aged 65 and above), which covers 11 OECD countries. For the 2017 round, interviews were conducted between March and June over the phone (except for Switzerland, where they were conducted online). Samples ranged from 500 to 7000 cases. Data were weighted to ensure representativeness. Further information is available at: www.commonwealthfund.org.
Further reading
Fujisawa, R. and N. Klazinga (2017), “Measuring patient experiences (PREMS): Progress made by the OECD and its member countries between 2006 and 2016”, OECD Health Working Papers, No. 102, OECD Publishing, Paris, https://doi.org/10.1787/893a07d2-en.
OECD (forthcoming), Health at a Glance 2019: OECD Indicators, OECD Publishing, Paris.
Siciliani, L., M. Borowitz and V. Moran (eds.) (2013), Waiting Time Policies in the Health Sector: What Works?, OECD Health Policy Studies, OECD Publishing, Paris, https://doi.org/10.1787/9789264179080-en.
Figure notes
11.14. The question, “How often does your regular doctor or medical staff you see involve you as much as you want in decisions about your treatment or care?” was asked to respondents who reported having one or several regular doctors.
11.15. The question, “After you were advised to see or decided to see a specialist, how many days, weeks or months did you have to wait for an appointment?” was asked only to respondents who indicated that they saw or needed to see a specialist in the past two years and made an appointment.
11.16. Data for the Czech Republic, Germany, the Netherlands and Portugal are for 2011 instead of 2012. Data for Iceland and the Netherlands are for 2016; for Finland, Italy, Switzerland and Costa Rica data are for 2015; and for Belgium and Norway data are for 2014 instead of 2017. On data for Israel, see https://doi.org/10.1787/888932315602.
Source: 2017 Commonwealth Fund International Health Policy Survey of Older Adults
Source: 2017 Commonwealth Fund International Health Policy Survey of Older Adults
Source: OECD (forthcoming), Health at a Glance 2019: OECD Indicators.
Metadata, Legal and Rights
https://doi.org/10.1787/8ccf5c38-en
© OECD 2019
The use of this work, whether digital or print, is governed by the Terms and Conditions to be found at http://www.oecd.org/termsandconditions.