
Size of public procurement
Governments procure large amounts of goods and services to help them implement policies and deliver public services. As has been demonstrated during the COVID-19 crisis, public procurement strategies, practices and systems directly affect the quality of life and wellbeing of citizens. It is important that countries aim for maximum efficiency, effectiveness and value for money in public procurement.
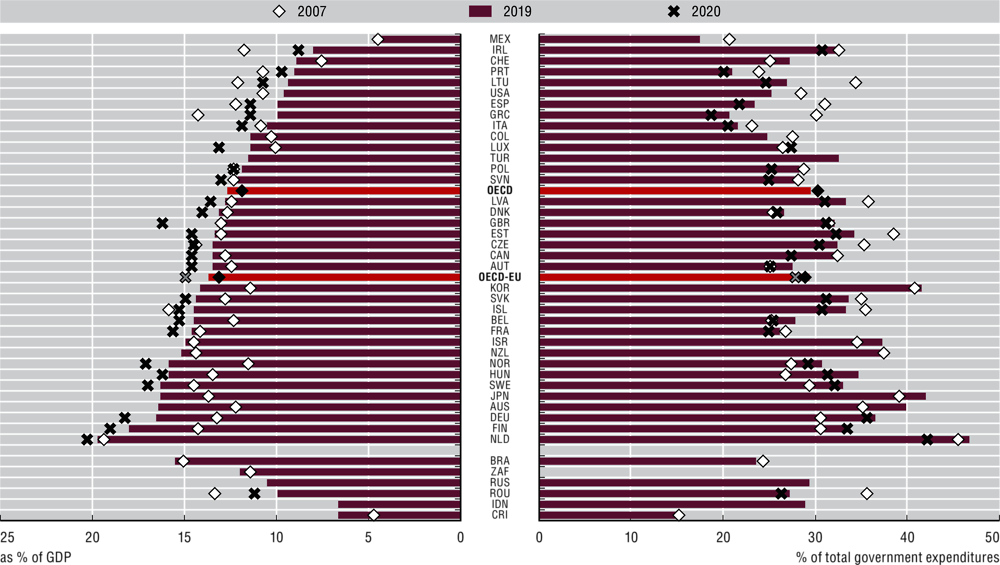
Public procurement expenditure as a percentage of GDP increased slightly across the OECD over the last decade, from 11.8% of GDP in 2008 to 12.6% of GDP in 2019. The COVID-19 pandemic led to a spike in public procurement relative to GDP in 2020. Among 22 OECD-EU countries for which data is available, public procurement increased from 13.7% of GDP in 2019 to 14.9% of GDP in 2020. Other countries also saw significant increases such as Norway (from 15.8% to 17.1%) and the United Kingdom (13.2% to 16.1%) (Figure 8.1). These increases are due both to governments purchasing goods and services to support their COVID-19 responses, and to GDP falling as a result of the crisis.
Public procurement as a share of total government expenditure decreased across all responding OECD countries by 1-2 percentage points in 2020 compared to 2019. This is because non-procurement government expenditure grew faster than procurement expenditure. Support packages provided by governments in response to the pandemic have drastically increased total government expenditure (53.6% of GDP in OECD-EU countries on average in 2020). The distribution between central and sub-national governments’ overall public procurement spending remains broadly unchanged with 64% of OECD-EU countries’ procurement spending taking place at the sub-national level (Online Figure G.33).
Public procurement is used across all government spending functions, from health to environmental protection, public order and economic affairs (comprising infrastructure, transport, communication, energy, and research and development). Health expenditure represented the largest share of public procurement spending, averaging 29.3% across OECD countries in 2019. In Italy, Japan and the Slovak Republic, almost 45% of public expenditure for procurement was in the health sector (Table 8.2). Notable exceptions to this include Lithuania and the United States, where economic affairs represented the largest share of government spending, and Switzerland, where general public services and social protection formed the largest share. The next largest areas of public procurement spending across OECD countries were economic affairs (16.7%), education (11.6%), defence (10.5%) and social protection (10.0%) with relatively little variability among countries (Online Figure G.32).
The size of general government procurement spending is estimated using data from the OECD National Accounts Statistics (database), based on the System of National Accounts (SNA). General government procurement is defined as the sum of intermediate consumption (goods and services purchased by governments for their own use, such as accounting or information technology services), gross fixed capital formation (acquisition of capital excluding sales of fixed assets, such as building new roads) and social transfers in kind via market producers (purchases by general government of goods and services produced by market producers and supplied to households). Public corporations were excluded in the estimation of procurement spending. Data on general government procurement spending are disaggregated according to the Classification of the Functions of Government (COFOG) in Table 8.2. Further information about the types of expenditure included in each category is available in Annex C.
Further reading
OECD (2015), Recommendation of the Council on Public Procurement, OECD, Paris, OECD/LEGAL/0411.
OECD (2019), Productivity in Public Procurement: A Case Study of Finland: Measuring the Efficiency and Effectiveness of Public Procurement, OECD, Paris, www.oecd.org/gov/public-procurement/publications/productivity-public-procurement.pdf.
Figure notes
Figure 8.1. Data for Chile are not available. Data for Turkey are not included in the OECD average because of missing time series. A large share of general government procurement in the Netherlands is spent on social transfers in kind via market producers (via scholastic grants and mandatory health insurance systems). Data for Japan and Brazil and Russia are for 2018 rather than 2019.
Table 8.2. Data for Australia, Canada, Colombia, Mexico, New Zealand and Turkey are not available. Data for Chile are not included in the OECD average due to missing time series. Data for Chile includes changes in inventories and acquisitions less disposals of valuables. Data for Chile, Japan and Korea are for 2018 rather than 2019.
G.32. (Change in the structure of general government procurement spending by function, 2012 to 2019) and G.33. (General government procurement spending by level of government, 2007, 2019 and 2020) are available online in Annex G.
Source: OECD National Accounts Statistics (database). Data for Australia are based on a combination of Government Finance Statistics and National Accounts data provided by the Australian Bureau of Statistics.