
Trust in public institutions
People’s trust in government is a common indicator of public administrations’ performance and a measure of how well democracies are functioning. During the COVID-19 pandemic, for example, trust was found to be strongly correlated with compliance with measures designed to flatten the infection curve in European countries (Bargain and Aminjonov, 2020).
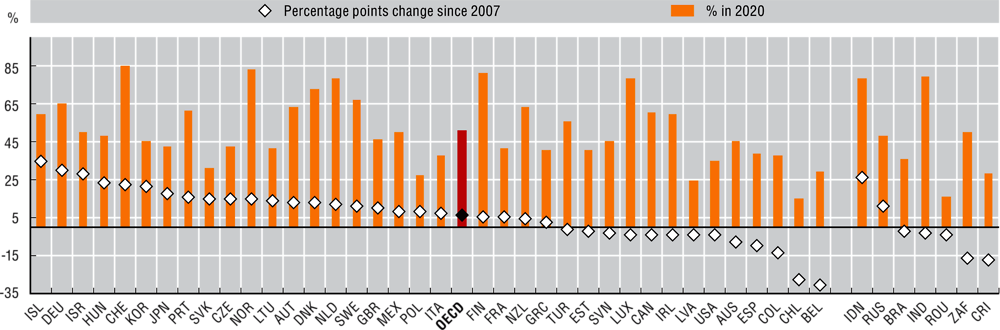
According to the Gallup World Poll (GWP), in 2020, 51% of people in OECD countries trusted their government, a 6.3 percentage point increase from 2007 and a 6 p.p. increase from 2019 (OECD, 2019).The greatest increases were in Iceland (35 p.p.) and Germany (30 p.p.) while trust fell most steeply in Belgium (31 p.p.) and Chile (28 p.p.) (Figure 13.1). There are also differences in some countries by age (see Online Figure G.39). The average increase in trust should be viewed with caution as most data were collected during the first wave of the COVID-19 pandemic and could reflect the so-called “rallying around the flag” effect. This effect predicts an increase in trust during sudden crises as people rally behind leaders and institutions, and temporarily pay less attention to other policy issues.
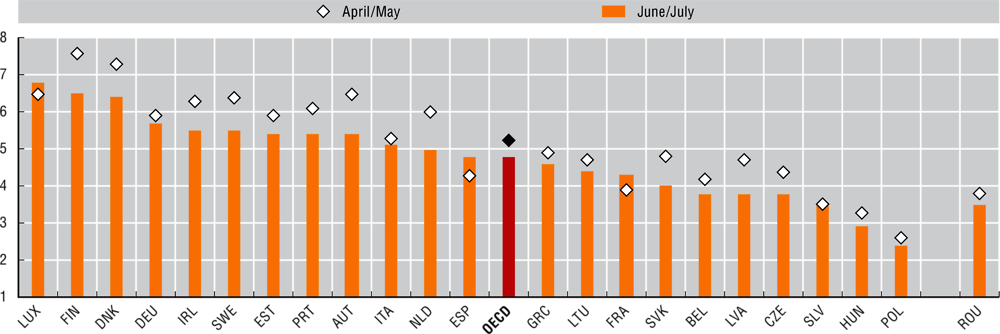
In 18 of 22 OECD countries surveyed, average trust levels fell between April/May and June/July 2020 indicating that any rallying effect was fading away. On a scale of 1-10, trust in government averaged 5.23 in April/May and 4.77 in June/July, although trust increased in Spain (by 0.5 points), France (0.4) and Luxembourg (0.3) and remained unchanged in Slovenia (Figure 13.2).
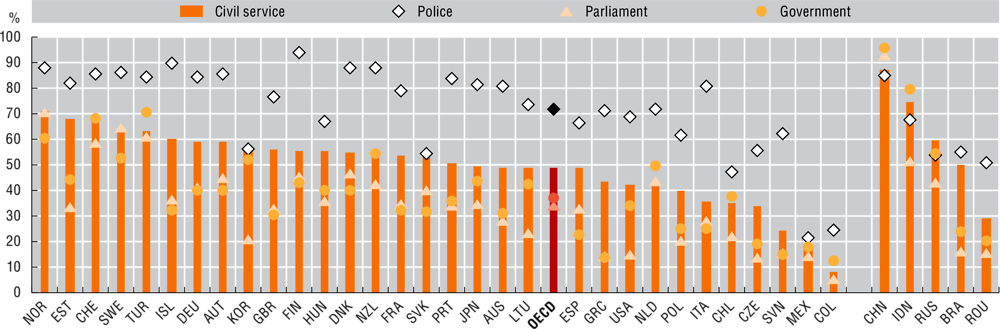
Metrics of trust in government provide signals of people’s relationship with their institutions and the state of public affairs in countries, but they remain highly aggregated and could be influenced by a wide array of factors and circumstances. The joint European Values Study (EVS) and World Values Survey (WVS), fielded in most OECD countries in 2018, includes questions about trust in several institutions including the core measures suggested by the OECD guidelines (OECD, 2017). On average, 72% of the population trust the police, 49% trust the civil service, 37% trust the government and about one-third trust their national parliaments. With trust levels of 60% or more for all institutions, Norway has consistently the highest levels while in Colombia and Mexico trust is relatively low across the board. The widest gaps between the civil service and the government are in Greece (30 p.p.), Iceland (29 p.p.), Spain and the United Kingdom (26 p.p. each) (Figure 13.3).
Trust is defined as a person’s belief that another person or institution will act consistently with their expectations of positive behaviour (OECD, 2017). The GWP uses a representative sample of about 1 000 citizens in most countries. Eurofound’s e-survey, Living, Working and COVID-19, was conducted in April, when most surveyed countries were in lockdown, and in July, when society was slowly re-opening. After adjustment, the sample is representative of the demographic profile of the country. Although large segments of the population have access to the Internet, those without were by default excluded from the sample. The EVS and the WVS are two large-scale, cross-national and longitudinal surveys. EVS covers European countries. WVS covers countries outside Europe. The usual sample size is 1 300. Countries with greater populations and diversity apply samples of 1 500 to 5 000 while for those with populations below 2 million the sample size is 1 000.
Further reading
Bargain, O. and U. Aminjonov (2020). “Trust and compliance to public health policies in times of COVID-19”, Bordeaux Economics Working Papers 2020-06.
OECD (2019), Government at a Glance 2019, OECD Publishing, Paris, https://doi.org/10.1787/8ccf5c38-en.
OECD (2017), OECD Guidelines on Measuring Trust, OECD Publishing, Paris, https://doi.org/10.1787/9789264278219-en.
Figure notes
13.1. Percentage who answered “yes” to “Do you have confidence in the national government?”. Data for Chile, Estonia, Greece, Hungary, India, Indonesia, Israel, Latvia, Lithuania, Mexico, Luxembourg, Costa Rica, Romania and South Africa are for 2019 rather than 2020. Data for the Czech Republic are for 2018 rather than 2020. Data for Iceland are for 2017 rather than 2020. Data for Austria, Finland, Ireland, Norway, Portugal, the Slovak Republic, Slovenia and Switzerland are for 2006 rather than 2007. Data for Iceland and Luxembourg are for 2008 rather than 2007. 2007 is used as a benchmark as the year before the global financial crisis.
13.2. Average value of the answer to “How much do you personally trust each of the following institutions?” on a scale of 1 to 10, where 1 means no trust at all, and 10 means complete trust. The reliability of the data is lower for Luxembourg and Poland.
13.3. Percentage who answered “a great deal” or “quite a lot” to “How much confidence do you have in the parliament, the civil service and the police?”. Data for most European countries included in the graph are 2018. For precise information on when the EVS was fielded please refer to https://europeanvaluesstudy.eu/methodology-data-documentation/survey-2017/. Data for non-European countries are from the WVS. The United States data are for 2017; Australia, Chile, Colombia, Mexico and South Korea for 2018; Japan for 2019; and New Zealand for 2019-20.
G.39. (Confidence in national government by age group, 2020) is available online in Annex G.
Source: Gallup World Poll, 2020.
Source: Eurofound (2020), Living, Working and COVID-19.
Source: OECD calculations based on the World Values Survey and European Values Study, 2017-20.