
Indicator A3. How does educational attainment affect participation in the labour market?
Higher educational attainment increases the likelihood of being employed. On average across OECD countries, the employment rate is 61% for 25-34 year-olds without upper secondary education, 78% for those with upper secondary or post-secondary non-tertiary education as their highest attainment and 85% for those with tertiary education.
On average across OECD countries, among 25-34 year-olds with upper secondary or post-secondary non-tertiary attainment, the employment rate is roughly 10 percentage points higher for younger adults with a vocational qualification (82%) than for those with a general qualification (73%).
In more than one-third of OECD and partner countries, the employment rates for 25-34 year-olds with vocational upper secondary or post-secondary non-tertiary attainment are equal to or higher than the employment rates for those with tertiary education. Most of these countries have upper secondary or post-secondary vocational programmes with strong and integrated work-based learning or/and vocational programmes designed to offer students direct entry to the labour market.
Context
The economies of OECD countries depend upon a supply of highly skilled workers. Expanded education opportunities have increased the pool of skilled people across countries, and those with higher qualifications are more likely to find employment. In contrast, while employment opportunities still exist for those with lower qualifications, their labour-market prospects are relatively challenging. People with the lowest educational qualifications have lower earnings (see Indicator A4) and are often working in routine jobs that are at greater risk of being automated, therefore increasing their likelihood of being unemployed (Arntz, Gregory and Zierahn, 2016[1]). These disparities in labour-market outcomes can exacerbate inequalities in society. The health crisis we are experiencing linked to the spread of COVID-19 will undoubtedly have an impact on unemployment, and those with lower educational attainment might be the most vulnerable. The impact will have to be monitored in the coming years.
Young people often struggle to enter the labour market (see Indicator A2). Many OECD countries are increasingly interested in the development of vocational education and training system to tackle youth unemployment. While vocational education improves the school-to-work transition, it may become a challenge for vocationally trained individuals to learn new skills later on (Hanushek, Woessmann and Zhang, 2011[2]).
Comparing labour-market indicators across countries can help governments to better understand global trends and anticipate how economies may evolve in the coming years. In turn, these insights can inform the design of education policies, which aim to ensure that the students of today can be well prepared for the labour market of tomorrow.
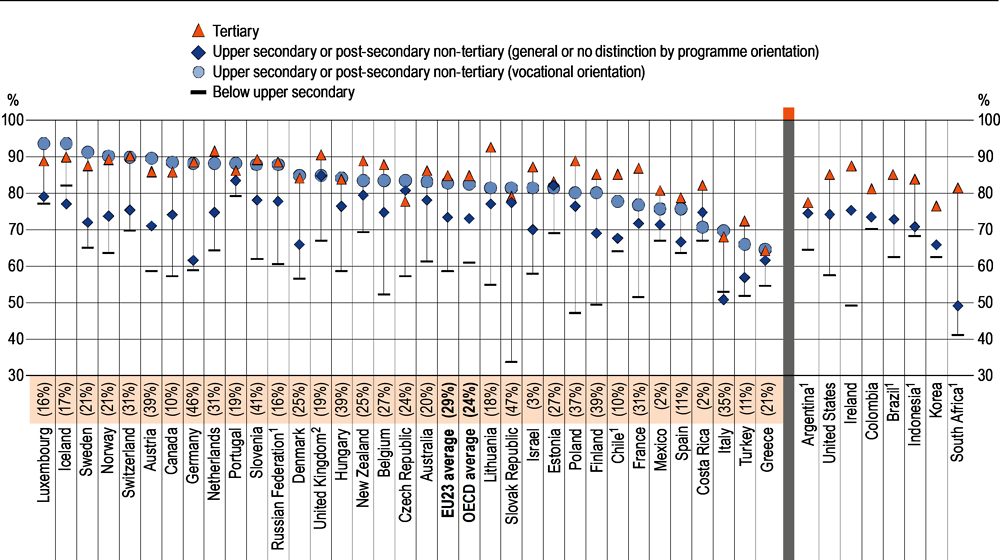
Note: The percentage in parentheses represents the percentage of 25-34 year-olds whose highest level of education is vocational upper secondary or post-secondary non-tertiary education.
1. Year of reference differs from 2019. Refer to the source table for more details.
2. Data for upper secondary attainment include completion of a sufficient volume and standard of programmes that would be classified individually as completion of intermediate upper secondary programmes (12% of adults aged 25-64 are in this group).
Countries in the left panel are ranked in descending order of the employment rate of 25-34 year-olds who attained vocational upper secondary or post-secondary non-tertiary education, and those in the right panel are ranked in descending order of the employment rate of 25-34 year-olds who attained upper secondary or post-secondary non-tertiary education (general or no distinction by programme orientation).
Source: OECD (2020), Table A3.3. See Source section for more information and Annex 3 for notes (https://doi.org/10.1787/69096873-en).
Other findings
Work experience during study is associated with higher employment rates later on in adults’ careers. However, rates vary greatly across countries and by the type of work experience acquired while studying.
Among adults with upper secondary or post-secondary non-tertiary education as their highest attainment, the employment advantage for those with a vocational qualification as compared to those with a general qualification tends to weaken over their lifetimes. In some countries, such as the Czech Republic, France and Mexico, the initial employment benefit of a vocational qualification turns into a disadvantage for adults age 35 and over.
In all OECD countries, employment rates increase with time since graduation. In 2018, on average across OECD countries, two out of three (66%) young adults with an upper secondary education were employed within two years of graduation. The employment rate rises to 76% two to three years after graduation and to 79% four to five years after graduation.
The unemployment rate of women who completed a vocational upper secondary or post-secondary non-tertiary programme is higher than that of men. On average across OECD countries, 9% of young women with a vocational programme as their highest attainment are unemployed, compared to 6% of young men.
Educational attainment and employment
Upper secondary education is often considered the minimum requirement for successful labour-market integration. Adults without this level of education are less employed, regardless of their age (Figure A3.2). On average across OECD countries, the employment rate is 59% for adults (25-64 year-olds) without upper secondary education, 77% for those with upper secondary or post-secondary non-tertiary education as their highest attainment, and 86% for tertiary-educated adults Table A3.1).
In all OECD and partner countries, attainment of upper secondary or post-secondary non-tertiary education is associated with higher employment rates. On average across OECD countries, the employment premium for adults with this level of education as their highest attainment is roughly 20 percentage points more than those without upper secondary education. However, the employment premium varies markedly across OECD and partner countries, ranging from 1 percentage point in Indonesia to 40 percentage points in the Slovak Republic (Table A3.1).
Employment rates also tend to increase between upper secondary education and post-secondary non-tertiary education. On average across the OECD, adults with post-secondary non-tertiary education enjoy better employment prospects than those with only upper secondary education (81% compared to 76%). However, in Estonia, Spain and Sweden, the employment rate is slightly lower for adults with post-secondary non-tertiary education than for adults with upper secondary attainment (Table A3.1)
On average across OECD countries, the employment rate for tertiary-educated adults increases by a further 9 percentage points, compared to those with upper secondary or post-secondary non-tertiary education as their highest attainment. Furthermore, employment rates continue to increase with higher levels of tertiary education, from 82% for adults with a short-cycle tertiary degree, to 84% for those with a bachelor’s or equivalent degree, 88% for those with a master’s or equivalent degree and 93% for those with a doctoral or equivalent degree (Table A3.1).
Adults with the most advanced qualifications (master’s and doctoral) generally have the best employment prospects. In most countries with available data, the employment advantage for the additional step of earning a master’s qualification is considerable, reaching at least 10 percentage points in Argentina and the Slovak Republic. In all countries except Greece, the Slovak Republic and the Russian Federation, at least 90% of doctorate holders are employed (Table A3.1).
By age group and programme orientation
On average across OECD countries, higher educational attainment increases is associated with higher employment rates for each age group. Among younger adults (25-34 year-olds), the average employment rate is 61% for those without upper secondary education, 78% for those with upper secondary or post-secondary non-tertiary education as their highest attainment, and 85% for those with a tertiary degree. Compared to the other age groups, employment rates are lowest for 55-64 year-olds, regardless of educational attainment level. This is mainly due to retirement, as a large proportion of 60-64 year-olds have already left the labour force (Figure A3.2).
In addition to increasing with educational attainment, employment rates also vary by the type of programme pursued. In the majority of OECD and partner countries, upper secondary and post-secondary non-tertiary education consists of both general and vocational programmes. Across OECD countries, 24% of younger adults attained a vocational upper secondary or post-secondary non-tertiary education and 16% attained a general one (see Indicator A1). This greater prevalence of vocational attainment is associated with strong employability in the labour market. On average in OECD countries, among younger adults with upper secondary or post-secondary non-tertiary education as their highest attainment, the employment rate is about 10 percentage points higher for those with a vocational qualification than for those with a general qualification, at 82% compared to 73% (Figure A3.1).
The difference in employment rates between younger adults with a vocational or a general qualification is 27 percentage points in Germany, but some of those with a general qualification are still enrolled in education. In Germany, younger adults who completed a vocational programme account for more than 80% of all those with upper secondary or post-secondary non-tertiary education as their highest attainment (see Indicator A1). Conversely, in Costa Rica, Estonia and the United Kingdom, younger adults with a general qualification at this level have better employment prospects than those with a vocational qualification (Figure A3.1).
In some countries, such as Hungary, Iceland, Ireland, New Zealand, Norway and Sweden, most upper secondary vocational programmes are not in theory designed to provide access to tertiary education, but rather to offer students direct entry to the labour market or to pursue post-secondary non-tertiary education (see Indicator B7). Interestingly, those who leave education with an upper secondary or post-secondary non-tertiary vocational qualification in most of these countries have excellent employment prospects, significantly higher than those with a general qualification, and also higher than the OECD average. The employment rates of younger adults with an upper secondary or post-secondary non-tertiary vocational qualification are at least 90% in Iceland, Norway and Sweden (Figure A3.1).
Moreover, in more than one-third of OECD and partner countries, the employment rates for younger adults with vocational upper secondary or post-secondary non-tertiary education are equal to or higher than the employment rates for those with tertiary education (Figure A3.1). Some of these countries have vocational programmes with a strong and integrated work-based learning component at upper secondary or post-secondary non-tertiary level. For example, in Austria, Germany, Hungary, Sweden and Switzerland, at least 90% of younger adults with a vocational qualification obtained a work experience while completing upper secondary or post-secondary non-tertiary education (see Box A1.1 in Indicator A1). However, the employment advantage of a vocational qualification as compared to those with a general qulaification tends to weaken over people’s lifetimes. On average across OECD countries, among adults with upper secondary or post-secondary non-tertiary qualification as their highest attainment, the employment premium of vocational qualifications is 9 percentage points over a general one for 25-34 year-olds, 5 percentage points for 35-44 year-olds, 3 percentage points for 45-54 year-olds and 1 percentage points for 55-64 year-olds (Figure A3.2). In the Czech Republic, France and Mexico, only 25-34 year-olds enjoy any employment advantage from a vocational qualification. For adults age 35 and over, the employment rates are higher for those with a general qualification than for those with a vocational qualification (Table A3.3 and (OECD, 2020[3])).
At least two factors could explain this phenomenon of declining employment advantages. First, vocational programmes generally aim to provide students with specific skills that are immediately valuable for employers. This occupational specificity may cause some difficulties if they need to adapt to technological and structural changes in the economy (Hanushek, Woessmann and Zhang, 2011[2]). Second, the proportion of younger adults who only have a general upper secondary or post-secondary non-tertiary qualification is small since most of them pursue further education and do not enter the labour market at this stage.
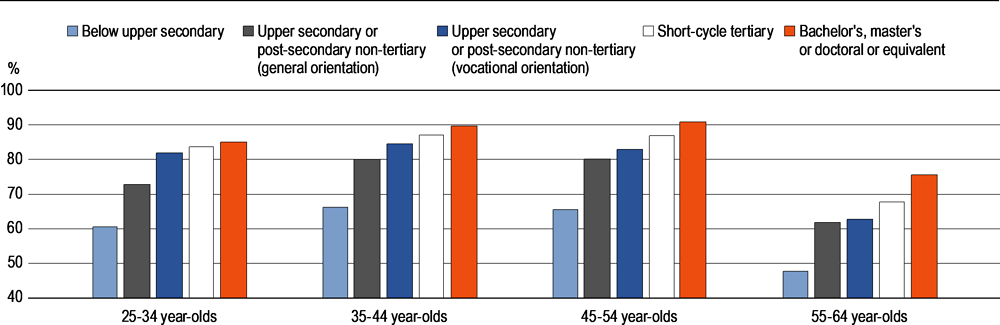
Note: The share of adults with a given educational attainment varies across age groups. See Indicator A1 for more information.
Source: OECD (2020), Education at a Glance Database, https://stats.oecd.org/. See Source section for more information and Annex 3 for notes (https://doi.org/10.1787/69096873-en).
On average across OECD countries, the employment rates for adults with a short-cycle tertiary degree are lower than those with a bachelor’s, master’s or doctoral or equivalent degree, and the difference tends to increase with age (Figure A3.2). In some countries, where short-cycle tertiary education is more common than the OECD average, employment rates are relatively high for short-cycle tertiary degree holders at the beginning of their career. For example, in France, 14% of younger adults have attained short-cycle tertiary education, compared to 8% on average across OECD countries. Their employment rate is 88%, compared to 86% for those with at least a bachelor’s degree. No such employment premium is observed among older age cohorts. In contrast, Latvia is the only country with a reversed trend: the employment rate for short-cycle tertiary degree holders is higher than for those with a bachelor’s, master’s or doctoral degree among adults aged 35-64 (Table A3.3 and (OECD, 2020[3])).
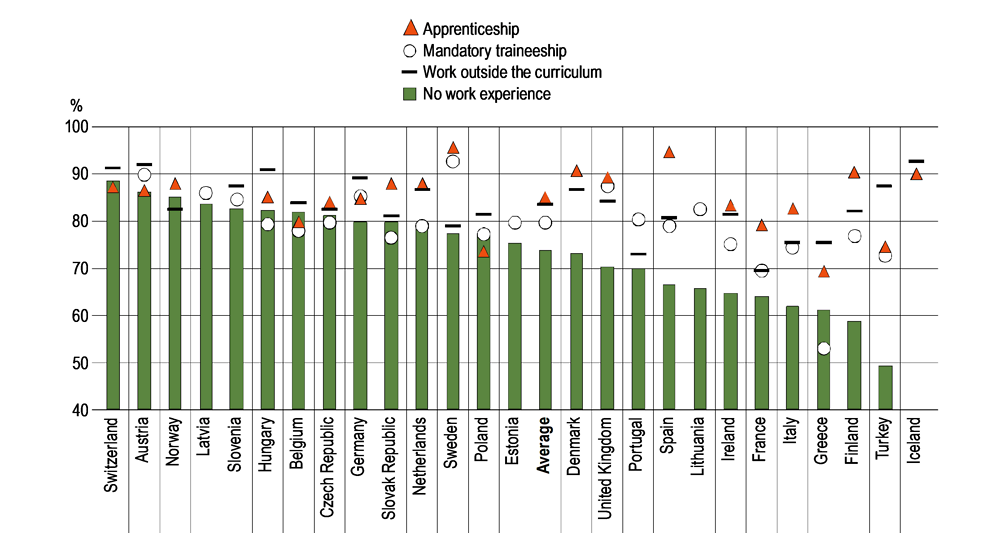
It has been widely accepted that vocational education can ease the transition from school to work and improve employment outcomes, as it provides opportunities for students to acquire skills relevant to the workplace during their studies. However, vocational programmes at upper secondary or post-secondary non-tertiary level vary by type of work experience. Data from the European Labour Force Survey (EU-LFS) ad-hoc module show that, among 25-34 year-olds with a vocational upper secondary or post-secondary non-tertiary qualification as their highest attainment, apprenticeships, mandatory traineeships and work outside the curriculum are the most common types of work experience among countries that participated in the survey (see Box A1.1 in Indicator A1).
Note: For the percentage of the population in each category, please refer to Table A1.4, available on line.
Countries are ranked in descending order of the employment rate of 25-34 year-olds with a vocational upper secondary or post-secondary non-tertiary educational attainment who had no work experience during that period of study.
Source: OECD/Eurostat (2020). See Source section for more information and Annex 3 for notes (https://doi.org/10.1787/69096873-en).
In about half of countries with available data, the employment rate for 25-34 year-olds who completed an apprenticeship is higher than the rate for those who did a mandatory traineeship, worked outside the curriculum, or did not gain any work experience. This is most evident in Spain, where the employment rate for adults who did an apprenticeship is 14 percentage points higher than those who had work experience outside the curriculum, and 28 percentage points higher than those who did not have any work experience while studying. Younger adults who did a mandatory traineeship enjoy the highest employment rate in Latvia, Lithuania and Portugal, though in these countries the types of work experience for vocational work-study programmes are very limited (Figure A3.3 and Table A3.6, available online).
Having work experience unrelated to their studies can also have a positive impact on younger adults’ labour-market outcomes. In about half of countries with available data, the 25-34 year-olds who had work experience outside the curriculum have the highest employment rates among all younger adults with a vocational education. In Turkey, for example, those who worked outside the curriculum have an employment rate at least 10 percentage points higher than those with any other type of work experience (Figure A3.3).
The lack of work experience while studying is associated with lower employment rates later in life: 25-34 year-olds with vocational upper secondary or post-secondary non-tertiary attainment who did not gain any work experience during study have the lowest employment rates in about half of countries, and often by a large margin. However, not all types of work experience are associated with better labour-market outcomes. In Poland, out of all types of work experience, young adults who did an apprenticeship have the lowest employment rate. In Belgium, the Czech Republic, Greece, Hungary and the Slovak Republic, the employment rates for those who did a mandatory traineeship are even lower than for those who did not have any work experience at all (Figure A3.3). This finding is particularly unexpected for Belgium, Hungary and the Slovak Republic, where more than 40% of 25-34 year-olds held a vocational qualification that required a mandatory traineeship (see Box A1.1 in Indicator A1).
By gender
In all OECD and partner countries except Norway and Portugal, young women have lower employment rates than young men, regardless of educational attainment (Table A3.2). Gender disparities in employment rates narrow as educational attainment increases. On average across OECD countries, the gender difference in employment rates among 25-34 year-olds without upper secondary education is 27 percentage points (72% for men and 45% for women). The difference shrinks to 16 percentage points among younger adults with upper secondary or post-secondary non-tertiary education as their highest attainment (85% for men and 69% for women), and 8 percentage points among tertiary-educated younger adults (89% for men and 81% for women). However, in the Czech Republic and the Slovak Republic, gender differences in employment rates are not very sensitive to educational attainment, varying by no more than 5 percentage points across educational attainment levels (Table A3.2).
Educational attainment and part-time or part-year employment
Greater educational attainment can also reduce worker’s likelihood of only working part-time or part-year for men and women. On average across OECD countries, 25% of male workers without upper secondary education work part-time or part-year, compared with 19% of those with upper secondary or post-secondary non-tertiary education as their highest attainment and 17% among those with tertiary education. However, it is tertiary-educated male workers who have the highest probability of working part-time or part-year in Colombia (9%), Mexico (11%) and Portugal (5%) (Figure A3.4). In nearly all OECD and partner countries, women are more likely to be in part-time or part-year employment than men. On average across OECD countries, women are about twice as likely to work part-time or part-year than men, regardless of educational attainment (OECD, 2020[4]).
On average across OECD countries, 20% of male workers with a general upper secondary or post-secondary non-tertiary qualification as their highest attainment work part time, compared to 18% of those with a vocational qualification. The difference exceeds 10 percentage points in Austria, Germany and Switzerland. Conversely, in the Czech Republic, Mexico and the Slovak Republic, male workers with a vocational qualification are more likely to have a part-time or part-year job than those with a general qualification (Figure A3.4). A similar situation is observed for female workers in most OECD and partner countries: female workers with a vocational qualification are more likely to have a part-time or part-year job than those with a general qualification (OECD, 2020[4]).
1. Year of reference differs from 2018. Refer to the Table A4.1 for more details.
Countries are ranked in descending order of the share of tertiary-educated men who are in part-time or part-year employment.
Source: OECD (2020), Data collection on education and earnings. See Source section for more information and Annex 3 for notes (https://doi.org/10.1787/69096873-en).
Educational attainment and unemployment
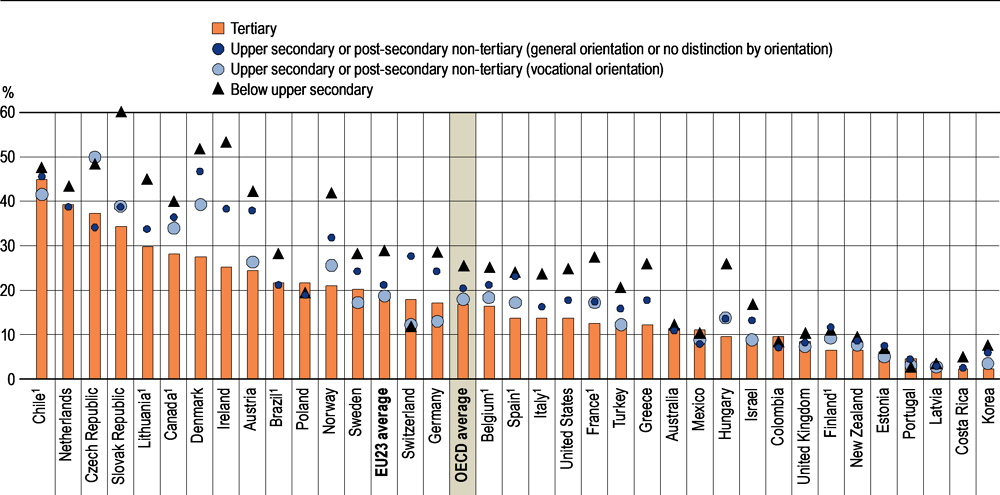
In many OECD and partner countries, unemployment rates are especially high among younger adults with lower educational attainment levels. On average across OECD countries, the unemployment rate for younger adults lacking upper secondary education is 13%, almost twice as high as for those with upper secondary or post-secondary non-tertiary attainment (7%). The unemployment rate for tertiary-educated younger adults is only 5% (Table A3.4).
The situation is especially severe for younger adults without upper secondary education in the Slovak Republic and South Africa, where more than 35% of them are unemployed. The unemployment rate is also high in France, Greece, Italy and Spain, where about one-quarter of these younger adults are unemployed (Table A3.4).
Having attained upper secondary education or post-secondary non-tertiary education reduces the risk of unemployment in most OECD and partner countries. In Austria, the Czech Republic, Germany, Hungary, Poland, the Slovak Republic and Sweden, the unemployment rate for younger adults with upper secondary or post-secondary non-tertiary education as their highest attainment is less than one-third the rate of younger adults with below upper secondary education (Table A3.4).
In most OECD and partner countries, among younger adults with upper secondary or post-secondary non-tertiary attainment, those with a vocational qualification have lower risk of unemployment than those with a general one. The difference in employment rates is most pronounced in Austria, Germany, Iceland, Norway, Sweden and Switzerland, where the unemployment rate among those with a vocational qualification is less than half the rate of those with a general qualification (Table A3.4). In all of these countries, except Iceland, more than 55% of younger adults with upper secondary or post-secondary non-tertiary attainment completed a vocational programme (see Indicator A1).
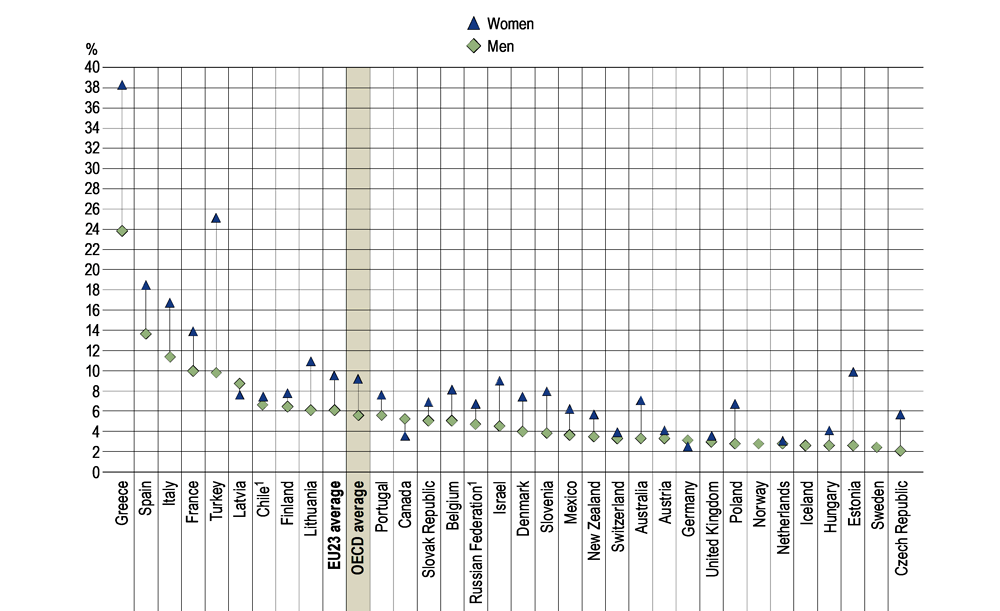
1. Year of reference differs from 2019. Refer to the Education at a Glance Database for more details.
Countries are ranked in descending order of the unemployment rate of men with vocational upper secondary or post-secondary non-tertiary educational attainment.
Source: OECD (2020), Education at a Glance Database, https://stats.oecd.org/. See Source section for more information and Annex 3 for notes (https://doi.org/10.1787/69096873-en).
The unemployment rate of 25-34 year-old women who completed a vocational programme is higher than that of 25-34 year-old men. On average across OECD countries, 9% of young women with vocational upper secondary or post-secondary non-tertiary education as their highest attainment are unemployed, compared to 6% of young men. In Australia, the Czech Republic, Estonia, Israel, Poland, Slovenia, and Turkey, the unemployment rate for these young women is at least twice that of their male peers. Only in Canada, Germany and Latvia, do young men with this level of educational attainment experience higher unemployment than young women (Figure A3.5).
In many OECD and partner countries, younger adults with a tertiary degree are less likely to be unemployed compared to those with upper secondary or post-secondary non-tertiary education as their highest attainment. The positive effect of a tertiary education on unemployment rates is particularly high in Ireland, Lithuania, South Africa and the United States. In these countries, the unemployment rate among tertiary-educated younger adults is less than half the rate of younger adults who only have upper secondary or post-secondary non-tertiary attainment (Table A3.4).
Educational attainment and inactivity
On average across OECD countries, 31% of 25-34 year-olds who have not completed upper secondary education are inactive (i.e. not employed and not looking for a job). In Finland, Poland and the Slovak Republic, over 40% of younger adults without upper secondary education are inactive, and at most 50% of this group are employed (Table A3.3 and Table A3.4).
Inactivity rates fall substantially for younger adults with at least upper secondary education. On average across OECD countries, 16% of younger adults with upper secondary or post-secondary non-tertiary education as their highest attainment are inactive, and this falls to 10% for those with a tertiary degree (Table A3.4).
Across OECD countries, among younger adults with upper secondary or post-secondary non-tertiary education as their highest attainment, 12% of those with a vocational qualification are inactive, compared to 21% of those with a general qualification. In Austria, Germany, Iceland and Sweden, the inactivity rates among those with a vocational qualification are about one-third of the rates of those with a general qualification. In most OECD countries, the difference in inactivity rates by programme orientation are higher for 25-34 year-olds than for 25-64 year-olds, as younger adults who only completed general upper secondary or post-secondary non-tertiary education may still enrolled in education and are not seeking for job. Conversely, in Costa Rica and Estonia, younger adults who completed a vocational programme have higher inactivity rates than those from a general pathway (Table A3.4 and (OECD, 2020[3])).
Women have consistently higher inactivity rates than men across all attainment levels, but the rates are especially high among those who have not completed upper secondary education. On average across OECD countries, the gender difference in inactivity rate is 29 percentage points for 25-34 year-olds with below upper secondary education, compared to 16 percentage points among those with upper secondary or post-secondary non-tertiary attainment and 8 percentage points for those with tertiary attainment. These differences in inactivity rates largely explain the differences in employment rates between men and women (OECD, 2020[3])
Employment rates of recent upper secondary graduates
The transition from school to work is a major step in people’s lives. Young adults who leave the education system often face different challenges in finding employment. The health crisis we are experiencing linked to the spread of COVID-19 will undoubtedly have an impact on youth employment that will have to be monitored in the coming years. The use of data from the EU-LFS, complemented by data from administrative sources and other surveys for non-EU-LFS countries allows a more in-depth analysis of these school-to-work transitions (see also Indicator A2).
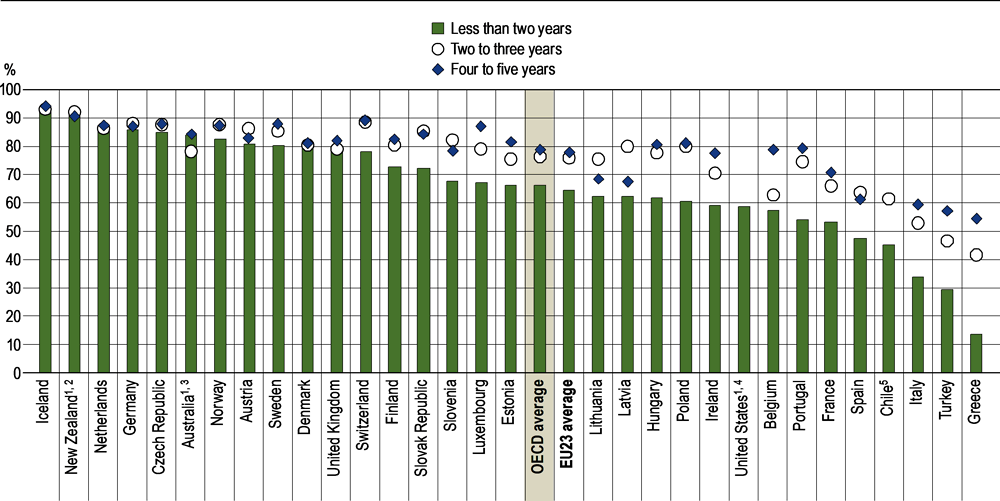
In all OECD countries with available data on recent upper secondary graduates, employment rates increase with time since graduation. In 2018, on average across OECD countries, 66% of young adults who had recently completed upper secondary education and were not studying any further were able to find employment within two years of graduation. Their employment rates increase significantly during the first years following graduation, but then tend to stabilise. Thus, the employment rate among young adults with an upper secondary education who graduated two to three years earlier is 76%, 10 percentage points higher than among those who graduated less than two years earlier. Among young adults who graduated four to five years earlier, 79% are employed, which is only 3 percentage points higher (Figure A3.6).
The differences in employment rates of recent upper secondary graduates across OECD countries are larger than the overall differences in employment rates among the wider population. Among adults who completed upper secondary education less than two years ago, the lowest employment rate is found in Greece (14%) and it is below 50% in Chile, Italy, Spain and Turkey. At the other end of the spectrum, the employment rate of these recent graduates reaches or exceeds 85% in the Czech Republic, Germany, Iceland, the Netherlands and New Zealand. The difference between the countries with the lowest and highest rates is almost 80 percentage points, much larger than the differences observed across countries for all adults with upper secondary attainment. The country with the lowest employment rate for upper secondary educated 25-64 year-olds is Greece (62%) and the country with the highest is Portugal (86%), a difference of 24 percentage points (Figure A3.6 and Table A3.1).
The change in employment rates over time since graduation indicates the smoothness of the school-to-work transition. In some countries, including Denmark, Iceland, Germany, the Netherlands and New Zealand, the difference in employment rates among different graduation cohorts is negligible and the employment rates of recent graduates have already reached their highest level in the first two years following the graduation. With the exception of Denmark, these countries also belong to the OECD countries with the highest employment rates (Figure A3.6).
In contrast, in other countries, school-to-work transitions are more difficult and labour-market outcomes remain challenging after some years since graduation. For instance, in Greece, Italy and Turkey, less than 35% of recent upper secondary graduates have found employment within two years of graduation, but in the long run more and more recent graduates are able to find a job. Four to five years after completing their education their employment rates are at least 25 percentage points higher than their more recently graduated peers. However, even then their employment rates do not exceed 60%, which is well below the average for OECD countries (79%) (Figure A3.6).
1. Data source differs from the EU-LFS.
2. Upper secondary general programmes only.
3. Year of reference differs from 2018. Refer to the source table for more details.
4. Year of reference 2017 and 2018 combined. Data reported under the category "Less than two years" refer to one year since completing education. The age group refers to 15-34 year-olds.
5. Data reported under the category "Less than two years" refer to one year since completing education.
Countries are ranked in descending order of the employment rate of young adults less than two years after completion of upper secondary education.
Source: OECD (2020), Table A3.5. See Source section for more information and Annex 3 for notes (https://doi.org/10.1787/69096873-en).
In some other countries, recent upper secondary graduates face major difficulties in their first years in the labour market, but have relatively good outcomes in the long run. For instance, in Portugal, only 54% of upper secondary graduates were employed within two years of graduation, but 80% of those who completed their education four to five years earlier are in employment, an increase of 25 percentage points. Similarly, in Belgium, Luxembourg and Poland, employment rates increase by about 20 percentage points, meaning that despite the difficulties that recent graduates face at the start of their professional career, their labour-market outcomes in the longer run are very good (Figure A3.6).
Active population (labour force) is the total number of employed and unemployed persons, in accordance with the definition in the Labour Force Survey.
Age groups: Adults refer to 25-64 year-olds; younger adults refer to 25-34 year-olds.
Educational attainment refers to the highest level of education attained by a person.
Employed individuals are those who, during the survey reference week, were either working for pay or profit for at least one hour or had a job but were temporarily not at work. The employment rate refers to the number of persons in employment as a percentage of the population.
EU-LFS countries are all countries for which data on recent graduates from the European Union Labour Force Survey are used. These are the following 27 countries: Austria, Belgium, the Czech Republic, Denmark, Estonia, Finland, France, Germany, Greece, Hungary, Iceland, Ireland, Italy, Latvia, Lithuania, Luxembourg, the Netherlands, Norway, Poland, Portugal, the Slovak Republic, Slovenia, Spain, Sweden, Switzerland, Turkey and the United Kingdom.
Inactive individuals are those who, during the survey reference week, were neither employed nor unemployed. Individuals enrolled in education are also considered as inactive if they are not looking for a job. The inactivity rate refers to inactive persons as a percentage of the population (i.e. the number of inactive people is divided by the number of all working-age people).
Levels of education: See the Reader’s Guide at the beginning of this publication for a presentation of all ISCED 2011 levels.
Part-time or part-year workers: the population who have had earnings from work, but not worked full-time, full-year, i.e. people who have either worked part-time or worked only a part of the reference period for the earnings data. The scope of the concept of part-time or part-year workers is broader than the concept of part-time employment used in most labour-force surveys which usually refer to a reference period of four weeks prior to the survey. Therefore, the share of individuals working part-time or part-year during the whole year is higher than the respective share of individuals working part-time during a reference period of four weeks.
Unemployed individuals are those who, during the survey reference week, were without work, actively seeking employment, and currently available to start work. The unemployment rate refers to unemployed persons as a percentage of the labour force (i.e. the number of unemployed people is divided by the sum of employed and unemployed people).
For information on methodology, see Indicator A1.
Data on the education and labour-force status of recent graduates by years since graduates are from the EU-LFS for all countries participating in this survey. The data from the EU-LFS have been complemented by data from administrative source and graduate or non-graduate surveys for non-EU-LFS countries. For information on the methodology, see Indicator A2.
Please see the OECD Handbook for Internationally Comparative Education Statistics (OECD, 2018[5]) for more information and Annex 3 for country-specific notes (https://doi.org/10.1787/69096873-en).
For information on sources, see Indicator A1.
Data on subnational regions for selected indicators are available in the OECD Regional Statistics Database (OECD, 2020[6]).
References
[1] Arntz, M., T. Gregory and U. Zierahn (2016), “The risk of automation for jobs in OECD countries: A comparative analysis”, OECD Social, Employment and Migration Working Papers, No. 189, OECD Publishing, Paris, https://dx.doi.org/10.1787/5jlz9h56dvq7-en.
[2] Hanushek, E., L. Woessmann and L. Zhang (2011), “General education, vocational education, and labor-market outcomes over the life-cycle”, NBER Working Paper Series, No. 17504, National Bureau of Economic Research, Cambridge, MA, https://doi.org/10.3386/w17504.
[4] OECD (2020), Education at a Glance Database - Education and earnings, http://stats.oecd.org/Index.aspx?datasetcode=EAG_EARNINGS.
[3] OECD (2020), Education at a Glance Database - Educational attainment and labour-force status, http://stats.oecd.org/Index.aspx?datasetcode=EAG_NEAC.
[6] OECD (2020), Regional Statistics Database - Educational attainment, by age group, https://stats.oecd.org/Index.aspx?datasetcode=REGION_EDUCAT.
[5] OECD (2018), OECD Handbook for Internationally Comparative Education Statistics 2018: Concepts, Standards, Definitions and Classifications, OECD Publishing, Paris, https://doi.org/10.1787/9789264304444-en.
Table A3.1 Employment rates of 25-64 year-olds, by educational attainment (2019)
Table A3.2 Trends in employment rates of 25-34 year-olds, by educational attainment and gender (2009 and 2019)
Table A3.3 Employment rates, by educational attainment and age group (2019)
Table A3.4 Unemployment and inactivity rates of 25-34 year-olds, by educational attainment (2019)
Table A3.5 Employment rates of young adults who have recently completed education, by educational attainment and years since graduation (2018)
WEB Table A3.6 Employment rate of 25-34 year-olds who attained vocational upper secondary or post-secondary non-tertiary education, by type of work experience while studying (2016)
Cut-off date for the data: 19 July 2020. Any updates on data can be found on line at https://doi.org/10.1787/eag-data-en. More breakdowns can also be found at http://stats.oecd.org/, Education at a Glance Database.
StatLink: https://doi.org/10.1787/888934162128
Table A3.1. Employment rates of 25-64 year-olds, by educational attainment (2019) |
|---|
Percentage of employed 25-64 year-olds among all 25-64 year-olds |
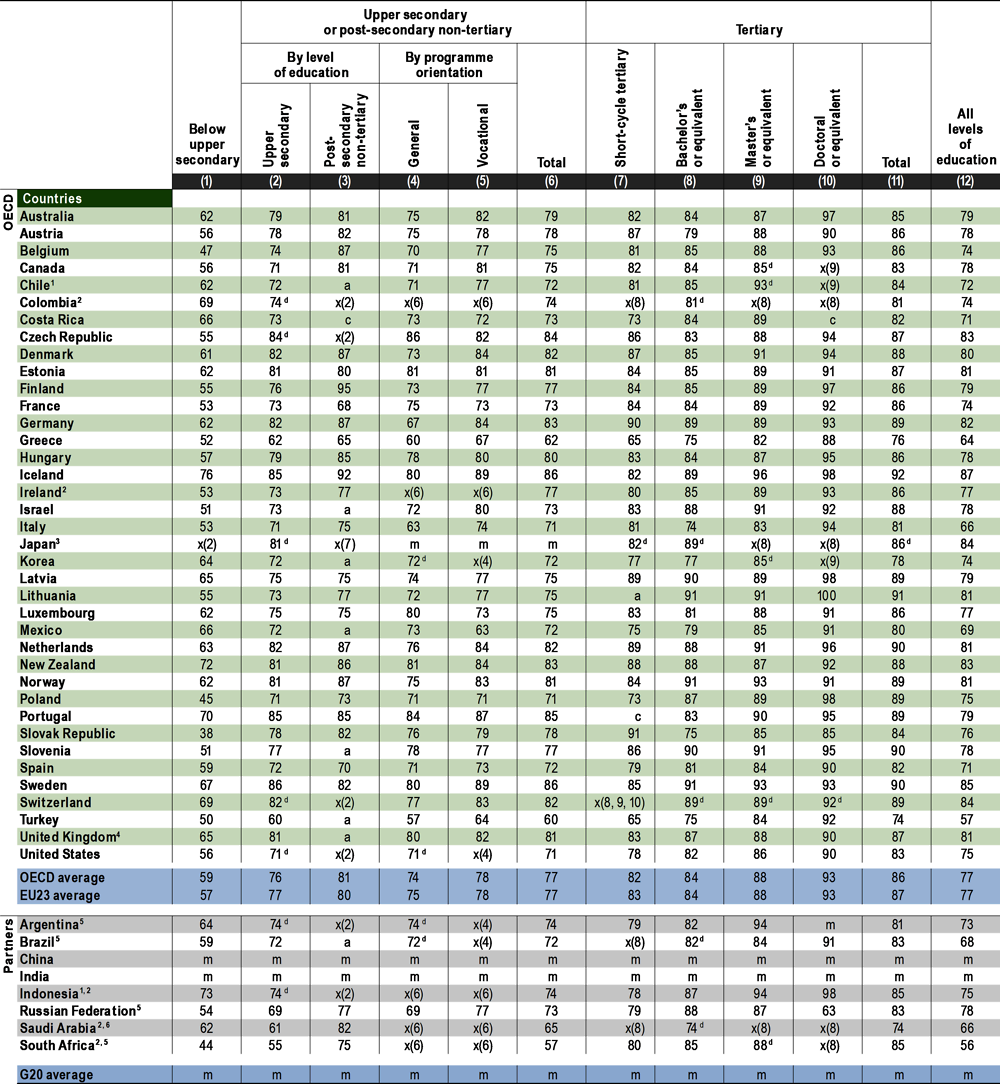 |
Note: In most countries, data refer to ISCED 2011. For Indonesia and Saudi Arabia, data refer to ISCED-97. See Definitions and Methodology sections for more information. Data and more breakdowns are available at http://stats.oecd.org/, Education at a Glance Database. |
2. There is no distinction by programme orientation at upper secondary or post-secondary non-tertiary level of education. |
3. Data for tertiary education include upper secondary or post-secondary non-tertiary programmes (less than 5% of adults are in this group). |
4. Data for upper secondary attainment include completion of a sufficient volume and standard of programmes that would be classified individually as completion of intermediate upper secondary programmes (12% of adults aged 25-64 are in this group). |
Source: OECD/ILO (2020). See Source section for more information and Annex 3 for notes (https://doi.org/10.1787/69096873-en). Please refer to the Reader's Guide for information concerning symbols for missing data and abbreviations. |
Table A3.2. Trends in employment rates of 25-34 year-olds, by educational attainment and gender (2009 and 2019) |
|---|
Percentage of employed 25-34 year-olds among all 25-34 year-olds |
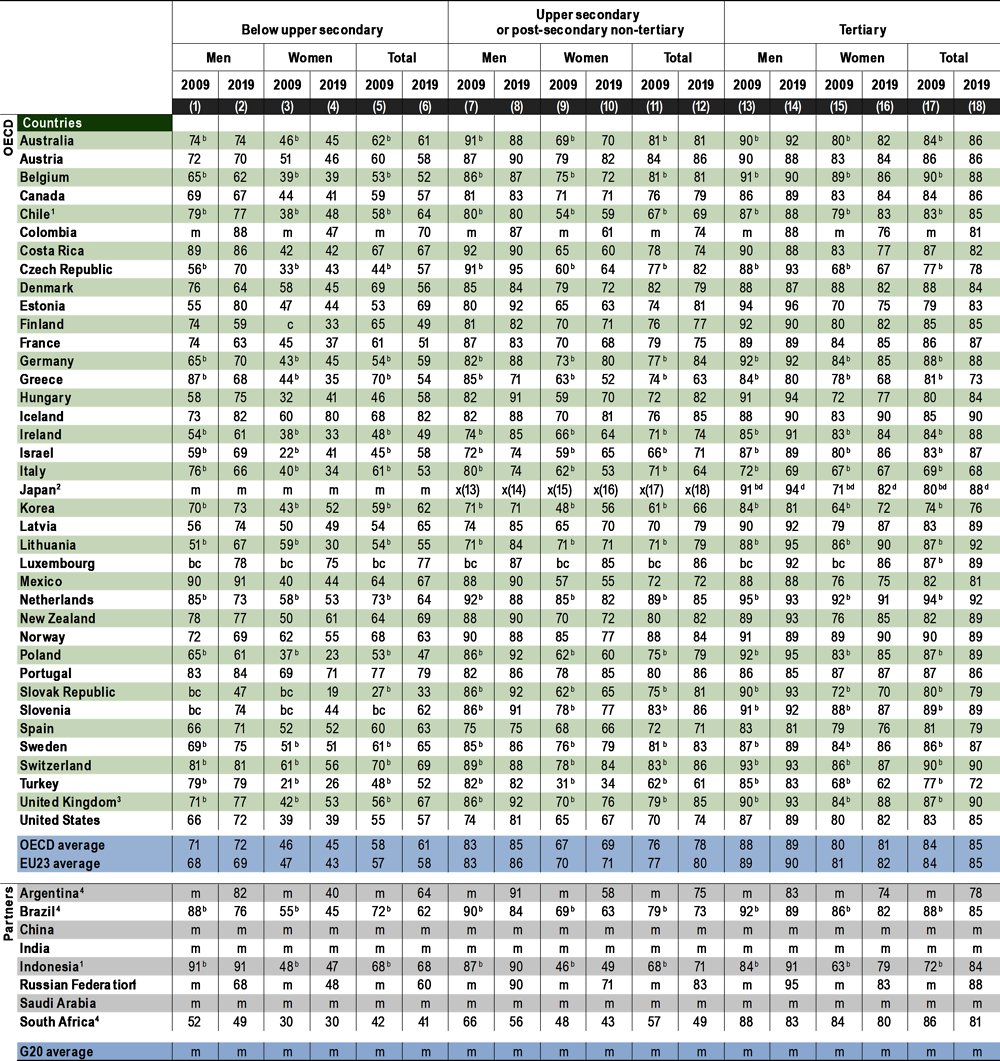 |
Note: In most countries, there is a break in the time series, represented by the code "b", as data for 2019 refer to ISCED 2011 while data for 2009 refer to ISCED-97. See Definitions and Methodology sections for more information. Data and more breakdowns are available at http://stats.oecd.org/, Education at a Glance Database. |
2. Data for tertiary education include upper secondary or post-secondary non-tertiary programmes (less than 5% of the adults are in this group). |
3. Data for upper secondary attainment include completion of a sufficient volume and standard of programmes that would be classified individually as completion of intermediate upper secondary programmes (12% of adults aged 25-64 are in this group). |
Source: OECD/ILO (2020). See Source section for more information and Annex 3 for notes (https://doi.org/10.1787/69096873-en). Please refer to the Reader's Guide for information concerning symbols for missing data and abbreviations. |
Table A3.3. Employment rates, by educational attainment and age group (2019) |
|---|
Percentage of employed adults among all adults in a given age group |
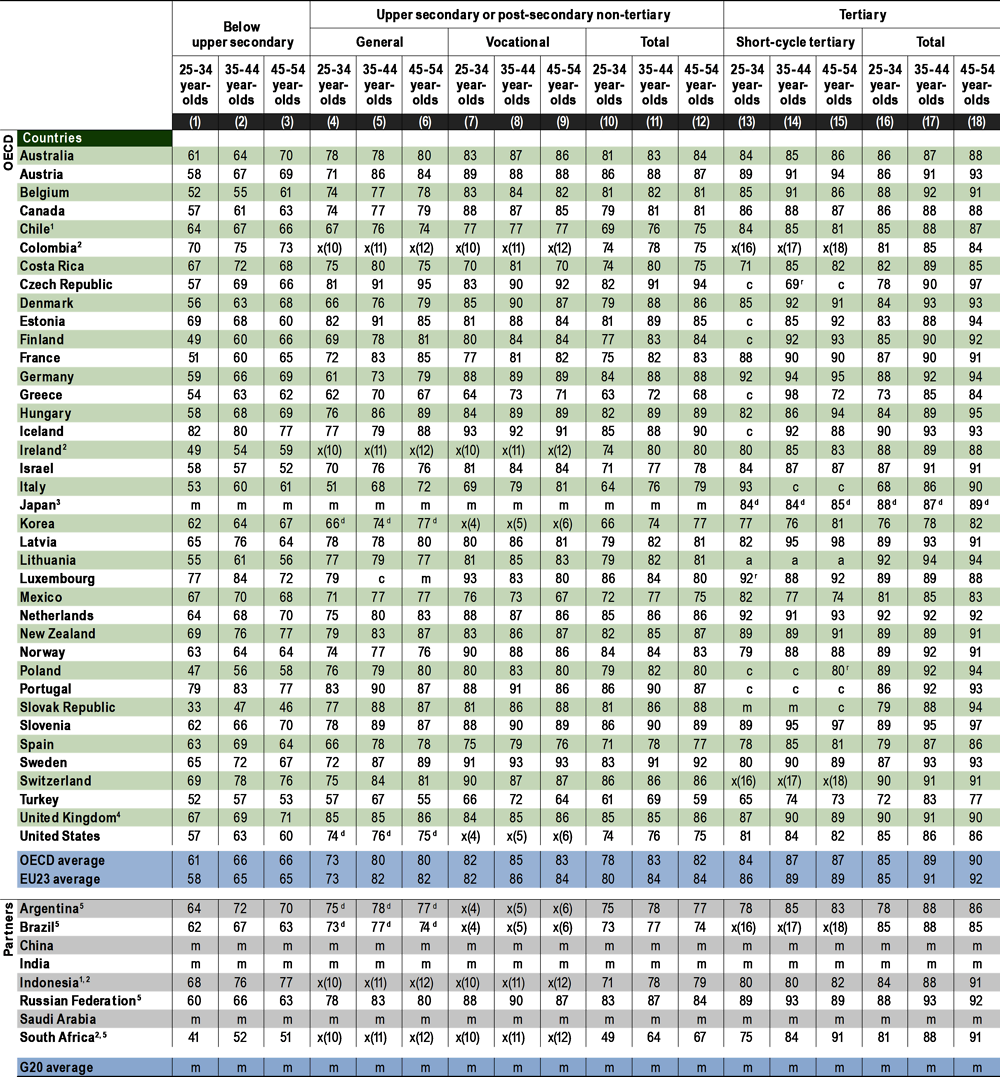 |
Note: In most countries, data refer to ISCED 2011. For Indonesia and Saudi Arabia, data refer to ISCED-97. See Definitions and Methodology sections for more information. Data and more breakdowns are available at http://stats.oecd.org/, Education at a Glance Database. |
2. There is no distinction by programme orientation at upper secondary or post-secondary non-tertiary level of education. |
3. Data for tertiary education include upper secondary or post-secondary non-tertiary programmes (less than 5% of adults are in this group). |
4. Data for upper secondary attainment include completion of a sufficient volume and standard of programmes that would be classified individually as completion of intermediate upper secondary programmes (12% of adults aged 25-64 are in this group). |
Source: OECD/ILO (2020). See Source section for more information and Annex 3 for notes (https://doi.org/10.1787/69096873-en). Please refer to the Reader's Guide for information concerning symbols for missing data and abbreviations. |
Table A3.4. Unemployment and inactivity rates of 25-34 year-olds, by educational attainment (2019) |
|---|
Inactivity rates are measured as a percentage of all 25-34 year-olds; unemployment rates as a percentage of 25-34 year-olds in the labour force |
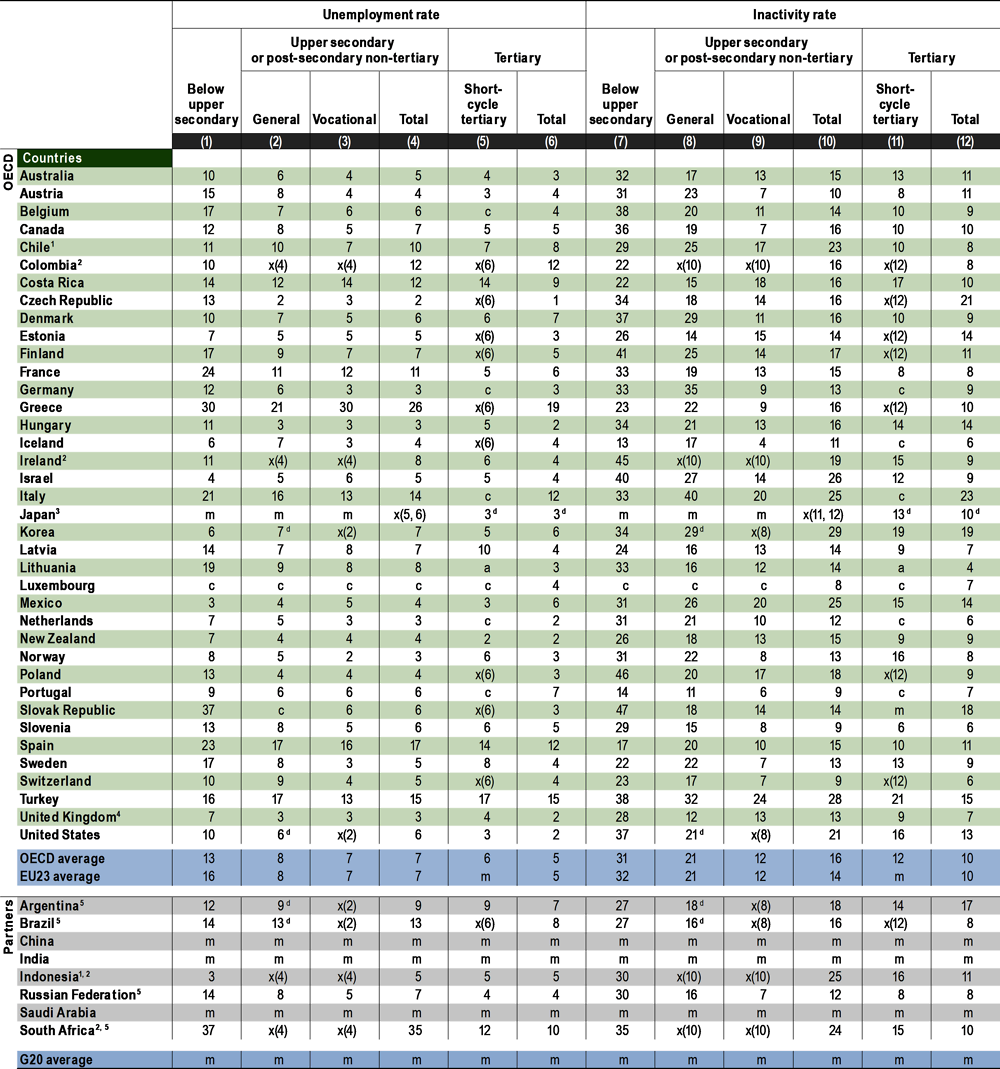 |
Note: In most countries, data refer to ISCED 2011. For Indonesia and Saudi Arabia, data refer to ISCED-97. See Definitions and Methodology sections for more information. Data and more breakdowns are available at http://stats.oecd.org/, Education at a Glance Database. |
2. There is no distinction by programme orientation at upper secondary or post-secondary non-tertiary level of education. |
3. Data for tertiary education include upper secondary or post-secondary non-tertiary programmes (less than 5% of adults are in this group). |
4. Data for upper secondary attainment include completion of a sufficient volume and standard of programmes that would be classified individually as completion of intermediate upper secondary programmes (12% of adults aged 25-64 are in this group). |
Source: OECD/ILO (2020). See Source section for more information and Annex 3 for notes (https://doi.org/10.1787/69096873-en). Please refer to the Reader's Guide for information concerning symbols for missing data and abbreviations. |
Table A3.5. Employment rates of young adults who have recently completed education, by educational attainment and years since graduation (2018) |
|---|
Adults aged 15-34 at graduation, not in education |
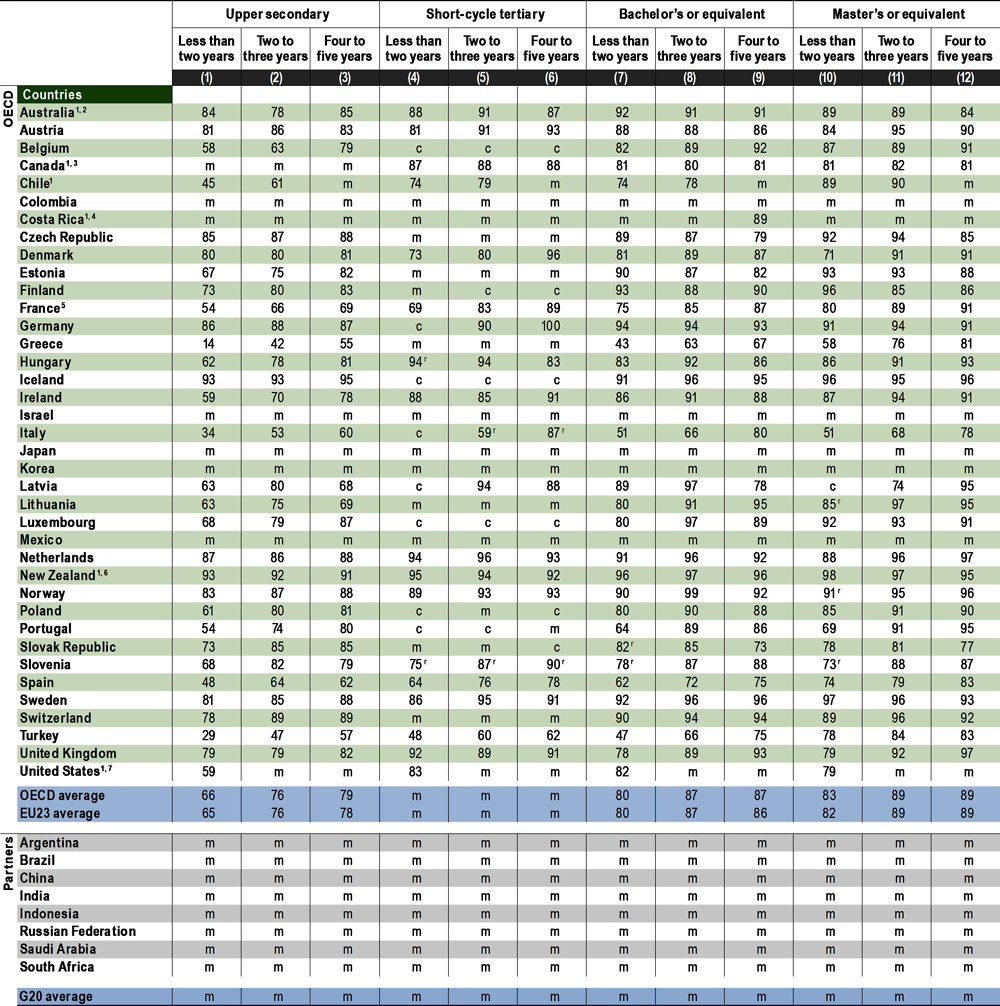 |
Note: The time periods of “less than two years”, “two to three years” and “four to five years” refer to 0-23 months, 24-47 months and 48-71 months since completion respectively. See Definitions and Methodology sections for more information. Data and more breakdowns are available at http://stats.oecd.org/, Education at a Glance Database. |
4. Year of reference 2016. Data reported for the category "Four to five years" refer to five years since completion. |
7. Year of reference 2017 and 2018 combined. The age group refers to 15-29 year-olds. Data reported under the category "Less than two years" refer to "One year" since graduation. |
Source: OECD (2020). See Source section for more information and Annex 3 for notes (https://doi.org/10.1787/69096873-en). Please refer to the Reader's Guide for information concerning symbols for missing data and abbreviations. |