Chapter 21. Philippines
Support to agriculture
The level of support to producers, measured as a share of gross farm receipts (%PSE), averaged 26% in 2016-18. This is higher than the OECD average and one of the highest among all emerging economies covered by this report.
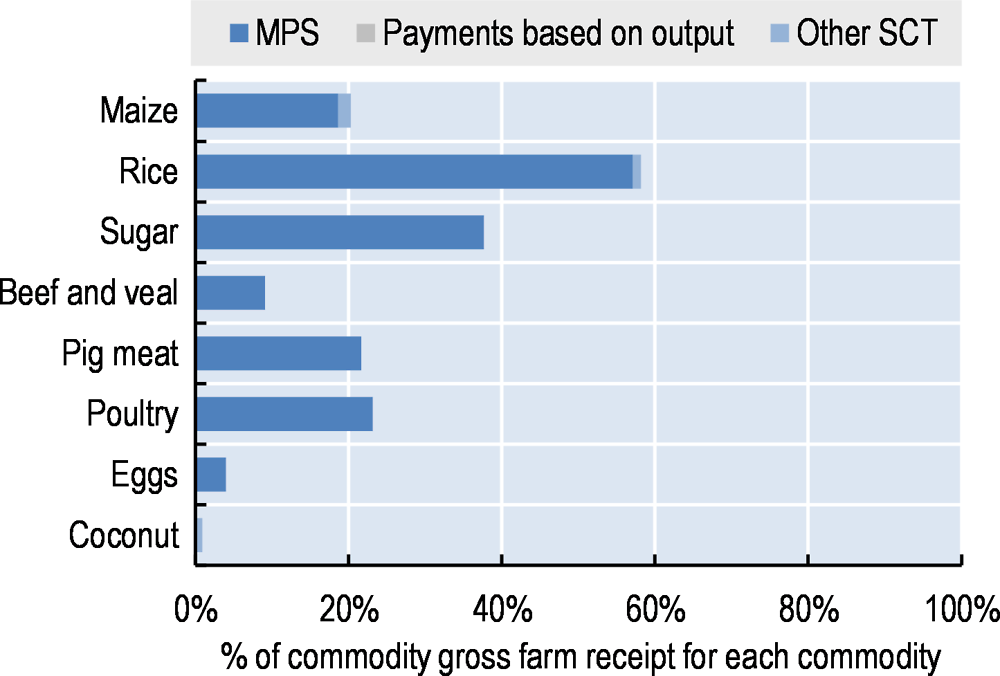
Market price support (MPS), which reflects the existing trade barriers (mainly Tariff Rate Quotas - TRQs), is the dominant form of support to Philippine producers. Rice producers are the main beneficiaries of the price support policies. The MPS for rice accounted for almost a half of the total value of MPS and represented 58% of gross farm receipts for rice in 2016-18. In addition to rice, substantial levels of support are provided to sugarcane, pig meat, and poultry, in particular through high import tariffs. The high level of MPS comes with an implicit taxation of primary consumers including the food processing industry, averaging 26% of the value of consumption in 2016-18 (%CSE).
Expenditures on general services (GSSE) as a ratio of agricultural value added have increased in recent years. Most of the expenditure on general services finances the development of infrastructure, in particular irrigation systems and – increasingly – also for extension programmes. The overall cost of support to the Philippine agricultural sector was at 2.9% of GDP in 2016-17. It was nearly six times the OECD average and one of the highest across all countries measured.
Main policy changes
The Philippines is moving away from quantitative restrictions on rice toward a system based on tariff rate quotas, except from Association of Southeast Asian Nations (ASEAN) countries from which imports will be facing a uniform 35% tariff and no quotas.
To increase support for rice producers, the government supressed the Irrigation Service Fee (ISF) paid by farmers to cover operational and maintenance costs of the irrigations systems as from 2017. The subsidy to the National Irrigation Administration (NIA), replacing the abolished ISF, continued under the 2018 national budget with PHP 2 billion (USD 38 million) to provide free irrigation for small farmers.
The National Irrigation Administration (NIA) was provided with additional PHP 41.7 billion (USD 0.79 billion) to ensure the development, restoration, repair, and rehabilitation of climate-resilient irrigation systems nationwide.
Assessment and recommendations
-
The Philippines’ key agricultural policy objectives focus on food security and poverty alleviation through guaranteeing a stable supply of staple food (rice) at affordable prices. The goal of self-sufficiency in rice has driven a range of policy measures supporting rice producers – as opposed to the regional trend toward the diversification into higher value commodities – while contributing to the undernourishment of poor households that are net rice consumers and effectively taxed by higher prices.
-
The Philippines is slowly moving away from quantitative restrictions on rice imports and changing the role of the National Food Authority (NFA), which was previously the only authorised institution allowed to import rice in case of actual or projected shortage. Now the NFA allocates permits to eligible importers for the importation of rice, and is confined to local paddy procurement and to maintaining buffer stocks at an equivalent of two weeks of national consumption. A continued effort to deregulate markets, reduce trade barriers and shifting away from commodity-specific forms of support could improve the country’s food security by increased diversification of production, better allocation of resources, with subsequent effects on consumption and income.
-
In view of the Philippines’ high susceptibility to typhoons, tropical storms and flooding, the government should adopt a holistic approach to risk management and mainstream adaptation policy objectives across programmes and institutions. Moreover, the effectiveness of current risk management tools should be assessed – in particular, the extent to which insurance and cash-transfer schemes encourage risk-reducing decision-making on farm on the farm. Lastly, farmer awareness should be increased by sharing information about local conditions, future projections and adaptive solutions.
-
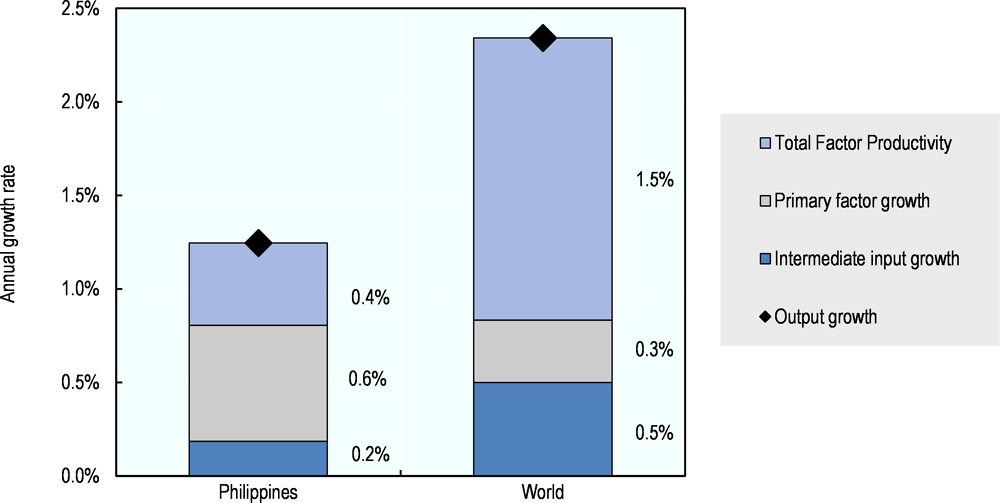
The agricultural sector’s total factor productivity (TFP) growth is slower than the world average and slower than in most countries in the region. This is likely to be linked to decades of underinvestment (or, in some cases, misdirected investment), policy distortions, uncertainties linked with the implementation of agrarian reform and periodic extreme weather conditions. In 2017, the Philippines reallocated some funding from variable input subsidies to investment in infrastructure and through the re-orientation of agricultural knowledge systems. Continuing such efforts to refocus budgetary support on long-term structural reform is key to promoting productivity growth.
-
Agricultural policies in the Philippines are designed and implemented by a complex system of institutions. The government could strengthen institutional co-ordination between the Department of Agriculture and other relevant departments and institutions that develop and implement programmes supporting agriculture; strengthen transparency and accountability of publicly-funded programmes; accelerate efforts to build a solid policy-relevant statistical system; and integrate monitoring and evaluation mechanisms into the policy process.
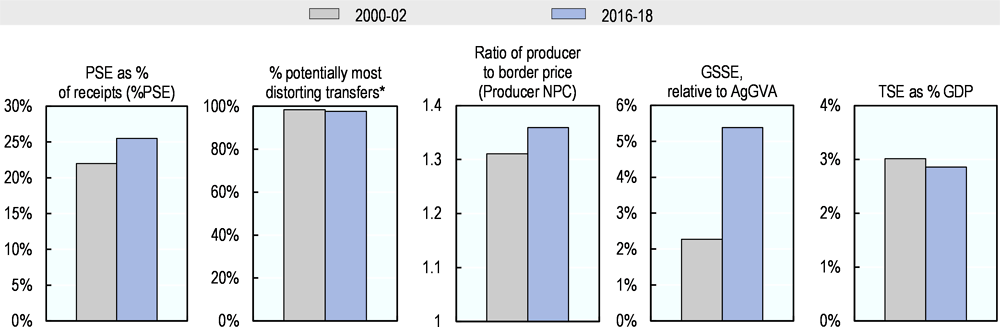
Note: * Share of potentially most distorting transfers in cumulated gross producer transfers.
Source: OECD (2019[1]), “Producer and Consumer Support Estimates”, OECD Agriculture statistics (database), https://doi.org/10.1787/agr-pcse-data-en.
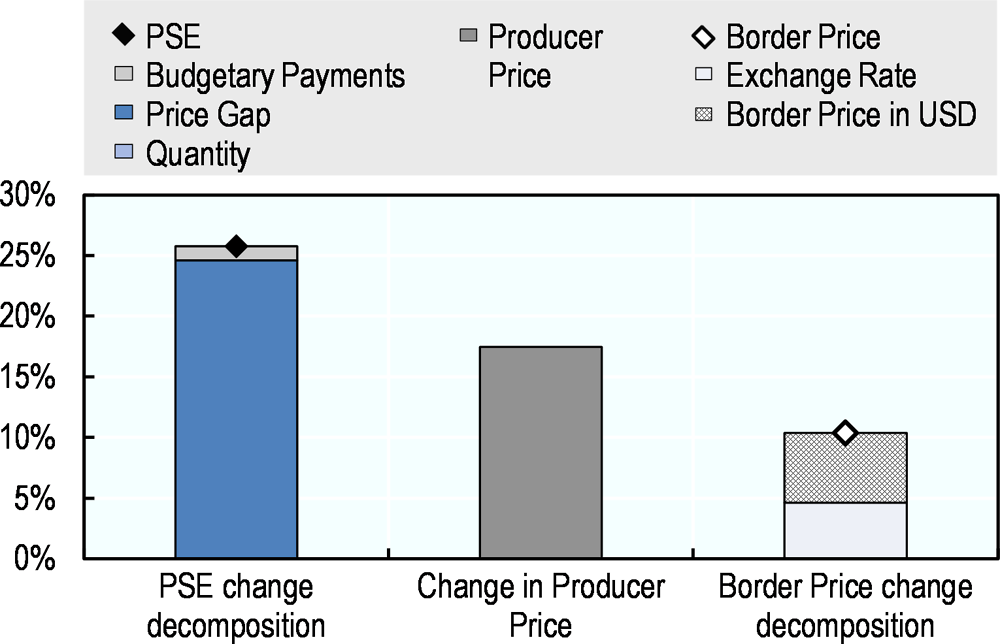
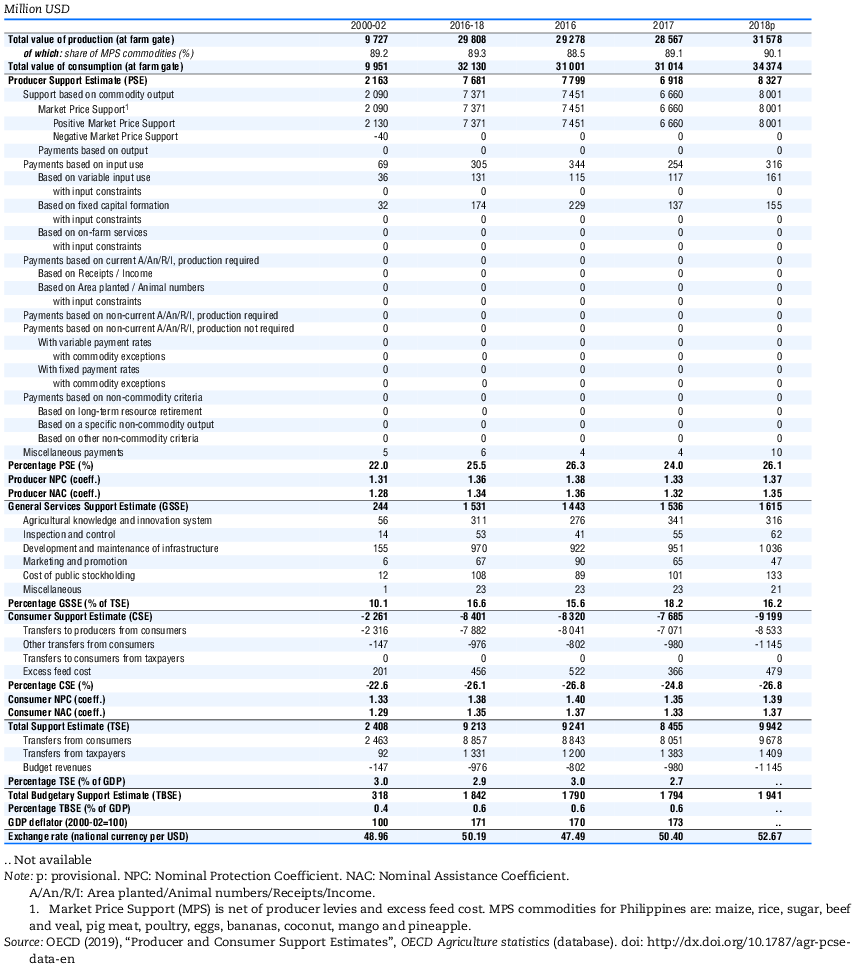
Support to producers (%PSE) was around 26% in 2016-18, indicating that more than one-fourth of gross farm revenues were generated by policies. Compared to 2000-02, the level of support has grown (Figure 21.1); an increase can be noted from 2017 to 2018 due to an increased price gap between domestic prices and world prices (Figure 21.2). A dominant part of support is provided through market price support, with a strong focus on rice. Market price support and input subsidies without input constraints, both considered as potentially most distorting forms of support, represent almost the total value of support to producers. On average, prices received by farmers were 36% higher than world prices in 2016-18 (compared to 31% in 2000-02). MPS is also the main component of Single Commodity Transfers (SCT): rice and sugar had the highest share of SCT in commodity gross farm receipts in 2016-18 (Figure 21.3). Expenditures for general services (GSSE) relative to agricultural value added more than doubled from 2000-02 to 2016-18 (Figure 21.1). A dominant share of these expenditures is allocated to infrastructure, in particular on investment in irrigation systems, the other important (and increasing) expenditures are on extension. Total support to agriculture as a share of GDP was 2.9% in 2016-18 – one of the highest across all countries covered by the OECD support indicators.
Source: OECD (2019[1]), “Producer and Consumer Support Estimates”, OECD Agriculture statistics (database), https://doi.org/10.1787/agr-pcse-data-en.
Source: OECD (2019[1]), “Producer and Consumer Support Estimates”, OECD Agriculture statistics (database), https://doi.org/10.1787/agr-pcse-data-en.
Contextual information
The Philippines is a mid-size country in terms of land area, but its population of 105 million makes it the world’s 13th most populous country. At USD 8 343 in purchasing power parity (PPP), GDP per capita in the Philippines is little above one-third the average GDP per capita of all countries analysed in this report (Table 21.2). Agriculture is a key sector for the Philippines, accounting for a little more than a quarter of total employment and one-tenth of GDP (Table 21.2). Farms tend to be small-sized with the average landholding at just 1.3 hectare – a figure that has been falling in recent years.
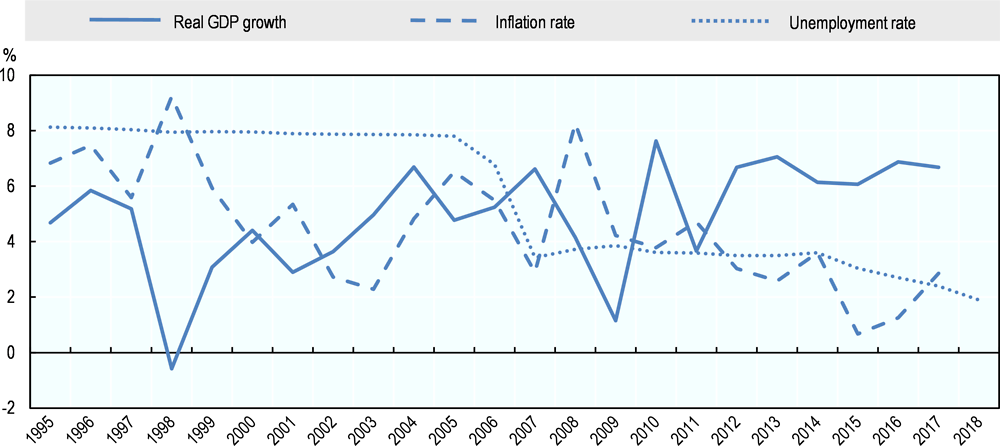
Since 2012, the Philippines has achieved relatively stable growth of around 6% annually, and reduced its rate of unemployment (Figure 21.4). Inflation has fallen to a low of less than 1% in 2015 before rising again. Overall, the Philippine economy, including its agro-food sector, integrates well in international markets – as measured by the ratio of trade to GDP at 27% in 2017.
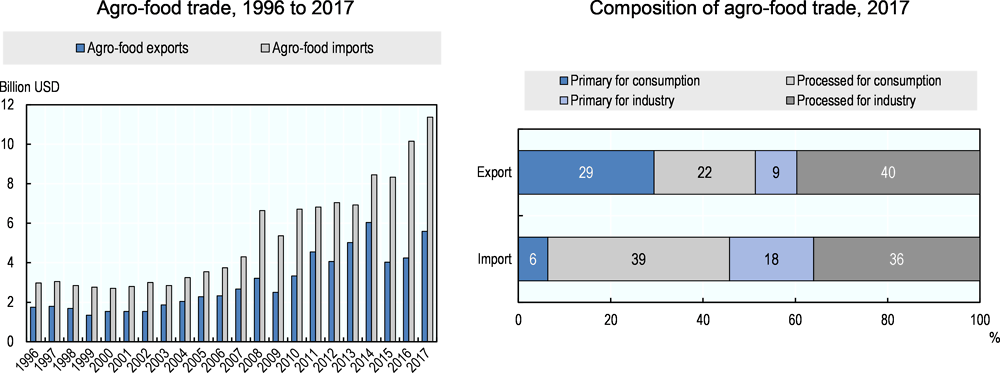
With limited land and a large population, the Philippines is a growing net importer of agro-food products. Of these imports, three-quarters are processed goods that are used directly for (final) consumption or as intermediate inputs by the processing industry. On the export side, around half of all agro-food exports are sold to firms for use as inputs in export markets, with another half going to foreign consumers (Figure 21.5).
Note: Change in the ILO definition of employment in 2005.
Sources: OECD statistical databases; World Bank, WDI and ILO estimates and projections.
Note: Numbers may not add up to 100 due to rounding.
Source: UN Comtrade Database.
At 0.4% per year, the agricultural Total Factor Productivity (TFP) growth has increased moderately over the past ten years, the output growth has remained relatively weak and has averaged 1.2% per year, well below the world average (Figure 21.6) and is one of the lowest growth rates in Southeast Asia (OECD, 2017[2]).
Agricultural land resources are under strain from frequent natural disasters, population growth and urbanisation. The Philippines has abundant water resources, of which the agriculture sector is the main user – accounting for 82% of total freshwater withdrawals (Table 21.3). Nonetheless, shortages can occur during the dry season in some regions. Agriculture share in total energy use has increased, but remains well below the OECD average.
Note: Primary factors comprise labour, land, livestock and machinery.
Source: USDA Economic Research Service Agricultural Productivity database.
Description of policy developments
Main policy instruments
Market price support is the dominant form of support to Philippine producers. Price support policy is focused mainly on rice and sugar and reflects a combination of trade barriers and domestic market regulation. Discussions to reform the current system of quantitative restrictions for rice, and potentially sugar, are underway. The rice price support policy is implemented by the National Food Authority (NFA) through price support for producers, a subsidised release price for consumers, government procurement, and import restrictions. The NFA is in charge of keeping buffer stocks of rice to stabilise consumer price levels and ensure adequate and continuous supply. For sugar, production quotas and trade barriers are used for producer price support and market regulation.
Tariff protection remains the Philippines’ main trade policy tool. Trade liberalisation has primarily occurred within regional trade agreements, particularly the ASEAN Free Trade Area. The simple average applied Most Favoured Nation tariff on agricultural products was 9.8% in 2016. All tariff lines applied are ad valorem and range from 0% to 65%.
Tariff rate quotas are applied for 14 agricultural products, with in-quota tariffs ranging from 30% to 50% and out-of-quota from 35% to 65%. This means that out-of-quota rate is extremely close to the in-quota rate. Products covered include live swine, goats and poultry and meat thereof, potatoes, coffee, maize, rice, sugar, and coffee. However, for three of those agricultural products (live horses, live bovine animals and beef), the TRQ is not implemented. For three others (poultry meat, potatoes and coffee), it is only applied to a specific range of tariff lines (WTO, 2018[3]). Import licensing is required for all regulated products (including those under TRQs) and are intended to safeguard public health, national security and welfare and to meet international treaty obligations.
The Philippines apply quantitative restriction (QR) on rice imports. These restrictions were first established when joining the WTO in 1995: the Philippines benefited from a special treatment clause (Article 5 of the Agreement on Agriculture) which allowed it to maintain QRs on rice imports on the basis of food security until 2012. In return, the Philippines had to guarantee minimum market access in the form of a progressively increasing import quota (minimum access volume, MAV). In 2012, the Philippines requested a new extension of its special treatment for rice through a waiver until 2017. The waiver was granted in July 2014 on the condition that the Philippines increased the MAV to 805 200 tonnes, lowered the in-quota tariff to 35% and that, after 30 June 2017. , its importation of rice would be subject to ordinary customs duties established on the basis of a tariff equivalent to be calculated in accordance with the guidelines defined in the WTO Agreement on Agriculture (WTO, 2014[4]). QRs on rice imports were unilaterally extended to December 2020. However, the “Revised Agricultural Tariffication Act” passed in 2018 is proposing to reform the system of QR on rice imports (see trade policy developments section).
Sanitary and phytosanitary requirements are complex and remain unchanged despite the reform of the food safety regime in 2013 (entered into force in 2015) with the “Food Safety Act”, the country’s first comprehensive food safety law that applies to all food from “farm-to-fork”, whether domestically produced or imported (WTO, 2018[3]).
Several agricultural commodities are subject to export controls and may require permits in addition to agency approval, namely rice, grains and grain products, and sugar. Exports of rice and maize remain restricted and, in principle, controlled by the NFA.
Budgetary support to agricultural producers, both through payments provided to farmers individually and to the agricultural sector as a whole (general services), is marginal compared to the value of transfers created by market price support and when compared to the OECD average. During the 2000s, budgetary support to producers went mainly to subsidise use of variable inputs. However, payments to producers for fixed capital formation have increased in recent years.
Crop insurance has expanded significantly in recent years. Approximately 15% of farmers received free crop insurance coverage in 2017 and the government plans to increase coverage to 20% in 2018 (PCIC, 2018[5]). The system is fully dependent on the Philippines Crop Insurance Corporation, a government corporation under the Department of Agriculture.
Expenditures on general services have increased significantly since the end of the 2000s. The most important item is the development and maintenance of infrastructure, of which a major share is devoted to off-farm investments in irrigation systems. Expenditures financing extension services is the second most important (and increasing) item in GSSE.
In 1988, the Philippines undertook an ambitious agrarian reform that covered close to three quarters of the country’s total agricultural land. By end-2015, the redistribution of land was almost complete, but property rights remain to be settled, with almost half of the reform beneficiaries still covered by collective ownership certificates. Various restrictions on land-market transactions and insecure property rights set limits to on-farm investment and weakened the potential economic benefits of the reform.
Domestic policy developments in 2018-19
The Irrigation Service Fee (ISF) paid by farmers to cover operational and maintenance (O&M) costs of the irrigations systems was abolished for rice producers owning eight hectares of land or less in 2017. The government approved a fund of PHP 2.3 billion (USD 48 million) to enable the National Irrigation Administration (NIA) to cover the O&M costs in 2017 (FAO, 2016[6]). The subsidy of the ISF to the NIA continued under the 2018 national budget with PHP 2 billion (USD 38 million) to ensure free irrigation for small farmers. The surface of newly irrigated land developed was 16 562 hectares in 2017 and 18 447 hectares in 2018 (Department of Budget and Management, 2018[7]).
Total budgetary allocations to agriculture remained relatively stable at PHP 45.9 billion (USD 0.91 billion) in 2017 and PHP 50.6 billion (USD 0.96 billion) in 2018 (Simeon, 2018[8]), though their structure changed. Payments based on input use declined – in particular, due to a decline in funding for post-harvest facilities (such as dryers, warehouses and seed storage). At the same time, funding for general services support increased – most notably, due to a rise in the budget for the development and maintenance of irrigation systems, in line with the national priority to increase infrastructure spending , as well as additional funding for extension programmes. The NIA was allocated and additional PHP 41.7 billion (USD 0.79 billion) to ensure the development, restoration, repair, and rehabilitation of climate-resilient irrigation systems nationwide. The 2019 total budget for agriculture will remain similar, if slightly lower than 2018, at PHP 49.8 billion (USD 0.95 billion) (Simeon, 2018[8]).
Expanding opportunities in agriculture, forestry, and fisheries was one of the budget priorities in 2018. Investments were planned in infrastructure, including the construction of irrigation systems, farm-to-market roads and mechanisation and post-harvest facilities. Investments are also planned in research and development as well as in financial assistance with a “quick credit programme” and a “crop insurance programme”. Finally, the Department of Agrarian Reform (DAR) was allocated PHP 9.9 billion (USD 191 million) to fast track the distribution of land to farmers and provide other basic support services.
The Philippines ratified the Paris Agreement on Climate Change in March 2017, committing to cut emissions by 70% by 2030 and strengthen adaptation efforts. Agriculture is not among the priority sectors for emission reductions, however, the Philippines Climate Change Commission asked the agriculture and fishery stakeholders to submit proposals for the Philippines’ Nationally Determined Contribution (NDC) on the Paris Agreement, to be submitted by 2020 (Philippine Council for Agriculture and Fisheries, 2018[9]).
Trade policy developments in 2018-19
The Philippines had previously committed in the WTO to discontinue a quantitative restriction (QR) on rice imports in mid-2017; however, an executive order (No. 23) was issued in May 2017, which has unilaterally extended tariff concessions and the QRs. The QRs are now set to be maintained until December 2020 or until Congress amends the Agricultural Tariffication Act of 1996 (which currently exempts rice from tariffication).
Confronted with rising inflation, in August 2018, the Philippine House of Representatives approved the proposed “Revised Agricultural Tariffication Act”. The Senate have passed legislation to this effect, with a reconciled bill approved by a Bicameral Conference Committee on 28 November 2018 (GAIN, 2018[10]). It moves trade policies away from quantitative restrictions on rice toward a system based on tariff rate quotas, except from ASEAN countries from which imports face a uniform 35% tariff and no quotas. The MFN bound tariff for rice imports is to be set at 40% in-quota and at 180% for imports outside quotas. The current MAV of 805 000 tonnes is set to revert to its 2012 level of 350 000 tonnes (GAIN, 2018[11]). The NFA, previously the only authorised institution allowed to import rice in case of actual or projected shortage, is tasked to allocate permits to eligible importers for the importation of rice. NFA would remain the sole authority for local paddy procurement and be tasked to maintain buffer stocks at an equivalent of two weeks of national consumption.
In April 2016, the Philippines signed a Free Trade Agreement (FTA) with the member states of the European Free Trade Association (EFTA). This broad-based agreement covers trade in goods (industrial and agricultural goods, fish and other marine products), rules of origin, trade facilitation, trade in services, investment, competition, protection of intellectual property rights, government procurement and sustainable development (GAIN, 2016[12]). In March 2018, the Philippines Senate voted to ratify the agreement, and the agreement entered into force on 1 June 2018 for the Philippines, Norway, Liechtenstein and Switzerland and has been fully implemented since 24 October 2018.1
The Philippines and the European Union continue to negotiate an EU-Philippines FTA. The current relationship between the two parties is based on the Partnership and Cooperation Agreement signed in 2012. The aim of the negotiations is to conclude an agreement that covers a wide range of areas including tariffs, non-tariff barriers to trade, trade in services and investment, as well as trade aspects of public procurement, intellectual property, competition and sustainable development (EC, 2017[13]).
References
[7] Department of Budget and Management (2018), “2018 People’s budget”, Republic of the Philippines.
[13] EC (2017), “Countries and regions: The Philippines”, European Commission, http://ec.europa.eu/trade/policy/countries-and-regions/countries/philippines/.
[6] FAO (2016), Commodity policy developments, Food and Agriculture Organization of the United Nations, https://doi.org/www.fao.org/economic/est/est-commodities/commodity-policy-archive/en/.
[10] GAIN (2018), “Philippine Rice Tariffication Update”, 29 August, Report Number RP 1826, Global Agricultural Information Network, USDA, https://gain.fas.usda.gov/Recent%20GAIN%20Publications/Philippine%20Rice%20Tariffication%20Update_Manila_Philippines_8-29-2018.pdf.
[11] GAIN (2018), “Philippines Grain and Feed Update - Philippine Grain and Feed Situation and Outlook“, 12 November, GAIN Report Number: RP 1941, Global Agricultural Information Network, USDA, https://gain.fas.usda.gov/Recent%20GAIN%20Publications/Grain%20and%20Feed%20Update_Manila_Philippines_12-11-2018.pdf.
[12] GAIN (2016), “Philippines: EFTA-Philippines Free Trade Agreement Signed”, 19 May, Global Agricultural Information Network, USDA, https://gain.fas.usda.gov/Recent%20GAIN%20Publications/Philippine-EFTA%20Free%20Trade%20Agreement%20Signed_Manila_Philippines_5-19-2016.pdf.
[1] OECD (2019), “Producer and Consumer Support Estimates”, OECD Agriculture statistics (database), https://doi.org/10.1787/agr-pcse-data-en.
[2] OECD (2017), Building Food Security and Managing Risk in Southeast Asia, OECD Publishing, Paris, https://dx.doi.org/10.1787/9789264272392-en.
[5] PCIC (2018), “2 million farmers to get free crop insurance”, Philippines Crop Insurance Corporation, https://businessmirror.com.ph/2018/01/16/2-million-farmers-to-get-free-crop-insurance/.
[9] Philippine Council for Agriculture and Fisheries (2018), “CCC calls for urgent PH NDC mitigation recommendations“, http://www.pcaf.da.gov.ph/index.php/2018/07/20/urgent-call-for-ph-ndc-mitigation-recommendations/.
[8] Simeon, L. (2018), “Department of Agriculture will not ask for higher allocation for 2019”, https://www.philstar.com/business/2018/08/01/1838466/department-agriculture-will-not-ask-higher-allocation-2019.
[3] WTO (2018), “Trade policy review of the Philippines”, WT/TPR/S/368, World Trade Organization, https://www.wto.org/english/tratop_e/tpr_e/s368_e.pdf.
[4] WTO (2014), “Decision on Waiver relating to Special Treatment for Rice of the Philippines”, WT/L/932, World Trade Organization, https://docs.wto.org/dol2fe/Pages/FE_Search/DDFDocuments/126136/q/WT/L/932.pdf.