3. The application of data in the public sector to generate public value
This chapter explores the way in which the public sector can recognise data as a strategic asset and apply it in pursuit of public value. It begins by presenting the government data value cycle before discussing how data might be valued as an asset and different approaches that can be taken to understanding public value. The chapter then focuses on the practical ways in which data might be applied to generate public value in three areas: “anticipation and planning”, “delivery”, and “evaluation and monitoring”.
The application of data in government has almost limitless potential for providing more efficient, effective and trustworthy public services. Chapter 2 considered the importance of defining and embracing a data governance model that creates the appropriate conditions for a data-driven public sector (DDPS) both at the centre of government and within individual public sector organisations and sectors. The response to this model will be influenced by contextual factors, but all public sector organisations exploring the role of and extracting value from data must clearly define and communicate the purpose to which data are put and the benefits to be achieved. For example, in the United States, the Department of Health and Human Services’ priority is to create a shareable data environment, while the Navy focuses on enhanced combat capability (US Department of Health & Human Services, 2011[1]; Department of the Navy, 2017[2]).
This chapter will focus on the application of data in the public sector to generate public value. It will first discuss definitions of value, initially presenting the government data value cycle, before going on to explore “valuing data as an asset” and “public value”. Having presented a base from which governments can define, argue and realise value, the chapter will develop the framework presented in van Ooijen, Ubaldi and Welby (2019[3]) to discuss how countries are applying data to create, or increase, public value through three types of activity:
1. Anticipation and planning: The role of data in the design of policies, planning of interventions, anticipation of possible change and the forecasting of needs.
2. Delivery: How the use of data can inform and improve the implementation of policy, responsiveness of government and provision of public services.
3. Evaluation and monitoring: The approach to data involved in measuring impact, auditing decisions and monitoring performance.
The government data value cycle
The OECD working paper “A data-driven public sector: Enabling the strategic use of data for productive, inclusive and trustworthy governance” (van Ooijen, Ubaldi and Welby, 2019[3]) presented the idea of the government data value cycle. This cycle identifies the stages through which data pass in order to be managed well and maximise value. The cycle helps track the journey from handling data (raw, isolated and unstructured datasets) to identifying and understanding the relationships between those data, resulting in information and knowledge. The result of such knowledge is the basis for governments to take action and decisions, whether strategic, tactical or operational (Ubaldi, 2013[4]).

Source: van Ooijen, C., B. Ubaldi and B. Welby (2019[3]), “A data-driven public sector: Enabling the strategic use of data for productive, inclusive and trustworthy governance”, https://doi.org/10.1787/09ab162c-en.
Building public sector intelligence in this way allows for the more efficient and effective operation of governments, and the creation of new public value. Nevertheless, it is deliberately presented as a cycle because this change does not happen in a linear fashion, but rather through feedback loops and ongoing iteration. Data can inform and affect the nature of decision-making processes, which in turn can lead to the production and collection of different or more data (OECD, 2015[5]).
This model presents four phases of data in government: 1) the collection and generation of data; 2) the storing, securing and processing of data; 3) the sharing, curating and publishing of data; and 4) the use and reuse of data. The first two stages of the process are entirely about how the public sector manages and looks after its responsibility to the data it generates, collects and holds. As discussed in Chapter 4, this activity touches on several important areas of data rights and the preservation of the public value associated with trustworthy and effective government. The final two stages offer opportunities to generate new public value through ways that will be discussed in the second half of this chapter.
Collecting and generating
This is the starting point for the application of data within government. The data accessed by public servants can take many forms and come from multiple sources. They could involve the consumption of a third party’s published dataset, whether as open government data (OGD) or via an application programme interface (API). They could be using the data generated by another piece of technology, perhaps an Internet of Things (IoT) device. They could be data requested as part of the design of a service, like forms collecting information from the public or logged in customer relationship management software following subsequent follow-up enquiries. They could be data produced as the output of government activity, such as one that involved the creation of government contracts. They could also be data held by private sector actors working in conjunction with the public sector to deliver goods and services.
While much of those data are generated by government activity, it is also possible that this first stage in the cycle involves non-governmental sources. This highlights the importance of universal standards in data collection and handling in both the private and public sectors (and forms part of the data infrastructure and architecture discussions in Chapter 2). Although the implications of data involved in this stage are internal to the public sector and influence internal decisions, having good-quality data helps in its reuse in later phases. As these decisions shape the interactions through which data are collected and lay the foundations for future use, this phase of activity defines the citizen experience of government services (Welby, 2019[6]). As such, public value is a passive by-product rather than, as with later phases, something directly generated from the use or reuse of the data.
Storing, securing and processing
Once data are identified, collected and generated, they must then be stored, secured and processed. This phase of the process is highly important to the discussions covered in Chapter 4 on the role of data and public trust. With data collected, decisions must be taken about how to store it, assess its quality (including any issues around bias), catalogue it and cleanse it. These steps are essential not only in ensuring the confidence of citizens in the public sector’s capacity for the proper handling of data, but also in providing a solid basis for the subsequent phases of the cycle.
This point of the cycle focuses on the behaviours and activities of those within the public sector in addressing the architectural and infrastructural challenges of high-quality data provision discussed in Chapter 2 considering data governance models. As such, the implications of data involved at the stage of storing, securing and processing are internal to the public sector, influencing internal decisions. They do not create new public value in terms of maintaining trust in government (as covered by the discussions on data-related citizen rights in Chapter 4). Such considerations should especially be a priority for those with responsibility for personally identifiable information, whether they’re in the public or private sector.
Sharing, curating and publishing
The third phase of the government data value cycle considers the way in which data that have been stored, secured and processed are shared, curated and published. At this point, legal context and constraints may dictate how readily requests for access and agreements to share can be handled for data that are not openly available. Where there are explicit efforts to support sharing, curating and publishing, the availability of data interoperability platforms and licensing those data that are made available through open data websites should be a priority with the earlier stages of the cycle, thus ensuring the latent quality of data.
The experience of the countries whose participation in the comparative study used as a basis for this report reflects a variety of approaches in terms of how explicit the expectations might be for sharing data between government institutions, especially in order to avoid citizens providing the same information to multiple parts of government.
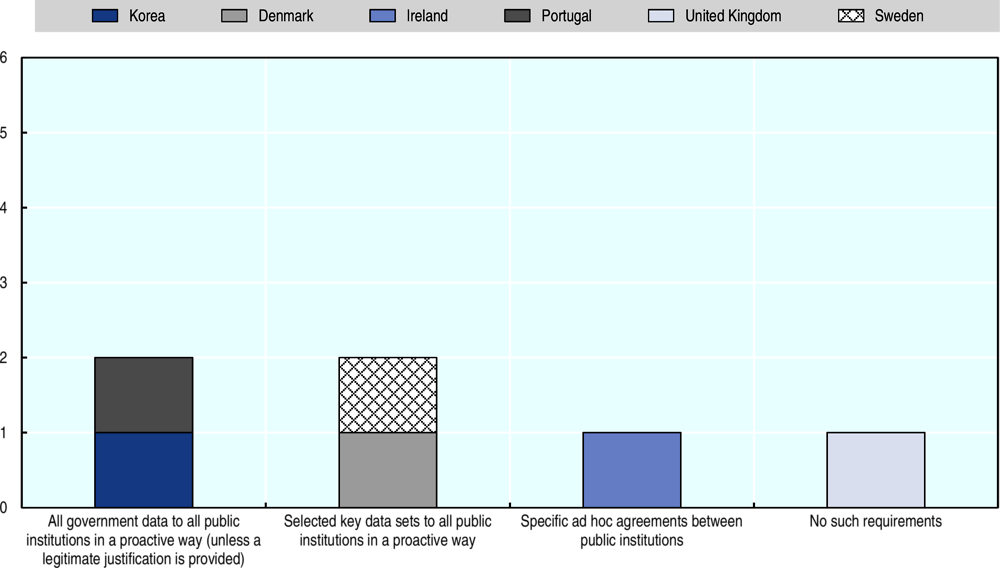
Source: Based on information provided by six OECD countries in response to the Questionnaire on the State of the Data-driven Public Sector in OECD Countries, Question 7: “Does your country have an explicit formal requirement (i.e. written guidance provided in an official government document: laws, directives, regulations, guidelines, action plans, executive order, other) for public institutions to share the data they produce with other public institutions?”.
In Korea and Portugal, there is a legal expectation for the proactive sharing of data. In Korea, the Electronic Government Act provides the legal basis for preventing the duplication of data collected from citizens, thereby requiring the sharing of relevant data within government as a matter of course (Government of Korea, 2017[7]). In Portugal, a similar piece of legislation implements the “once-only” principle, meaning citizens do not have to supply same document twice to the government. Portugal’s Interoperability Platform for the Public Administration facilitates the exchange of service-related information within government and, following the Resolution of the Council of Ministers 42/2015 of 19 June, extends this to private sector suppliers (Presidência do Conselho de Ministros, 2015[8]).
In Denmark and Sweden, only selected datasets are available for all public institutions to access in a proactive way. Denmark, similarly to Argentina’s data as a service approach (see Box 2.6 in Chapter 2), has produced a comprehensive set of resources that detail how to construct and publish data models.1 These resources allow for a common language for discussing Danish data and simplify its reuse by those wishing to do so. Sweden has had a long-standing legal commitment to sharing data, with legislation passed in 1998 detailing which pieces of information are to be shared and the circumstances under which to do so (Finansdepartementet S3, 1998[9]). In Ireland, different public institutions come to ad hoc agreements about sharing or accessing data. However, there are ongoing efforts to expand the legislative framework on the reuse of data to establish a more formal model for this. The United Kingdom does not have any formal requirements for data created by one organisation to be shared by another, with the implication that data-sharing happens only due to ad hoc requests rather than a strategic approach to interoperability and ease of sharing.
Almost all these countries are taking steps to ensure the publication of data through open data websites providing access to a wide range of datasets. The focus on producing good-quality data early in the government data value cycle to support its reuse later either elsewhere in government or as OGD is discussed in Chapter 2. However, the internal discoverability of these data is less sophisticated, with only Korea and the United Kingdom developing a single data inventory for government to simplify the ease with which policy makers and service teams can access these data for reuse. Denmark, Ireland and Portugal have plans for this in the near future while Sweden does not.
Internal reuse and discoverability of data is not necessarily limited by the absence of a single data inventory. Neither Denmark (Box 3.1) nor Portugal have such an inventory, but along with Korea they have taken practical steps to consider the needs and structure of base data registries. Such canonical records of information provide a foundation for policy and service delivery that simplify the acts of sourcing, and curating, vital datasets. These are also being developed by the United Kingdom, but without explicit legislation to underpin them.
The 2010 OECD e-Government Study of Denmark (OECD, 2010[10]) highlighted the importance of providing high-quality basic data registries to support the activity of government teams, but also to stimulate the effectiveness of open government data efforts. Although Denmark had some existing registries, coupled with the necessary legal frameworks, their adoption was limited as they did not reflect the needs of their users.
To move away from pure adherence to the law towards the provision of an enabler that responds to needs, the government undertook a three-year programme for implementing basic data registries in Denmark. This effort revisited the whole approach to data governance within the public sector, including changing the legal framework and building partnerships outside of government to capture views and identify valuable sources of data.
As a result, public authorities in Denmark now register various core information about individuals, businesses, real properties, buildings, addresses and more. This information, called basic data, is reused throughout the public sector and is an important basis for public authorities to perform their tasks properly and efficiently, not least because an ever-greater number of tasks have to be performed digitally and across units, administrations and sectors.
However, basic data also has great value for the private sector, partly because businesses use these data in their internal processes and, partly, because the information contained in public sector data can be exploited for entirely new products and solutions, in particular digital ones. In short, good basic data, which is freely available to the private sector, is a potential driver for innovation, growth and job creation.
Source: Local Government Denmark (2012[11]), Good Basic Data for Everyone: A Driver for Growth and Efficiency, https://en.digst.dk/media/18773/good-basic-data-for-everyone-a-driver-for-growth-and-efficiency.pdf.
At this stage in the process, the potential impacts of using data are no longer limited to internal public sector stakeholders, but begin to touch those external to government who can begin to use shared data. The first two phases of the government data value cycle shape the citizen experience and are influential in securing trust in government and maintaining public value, but this stage, and the one which follows, sees the potential to generate new public value from the activity of those with whom data are shared to explore policy impacts and service opportunities.
Use and reuse
The final phase of the government data value cycle focuses on the use and reuse of data, and offers the clearest opportunity for generating visible public value. The previous steps in the cycle are often hidden from view. Yet, they should not be neglected, because if there is not an effective approach to them, efforts to derive value from the use and reuse of data will be undermined due to poor quality data, incomplete sources, unreliable access and barriers to sharing. Therefore, although the public value from the use and reuse of data is visible, it is only because it is supported by a broader ecosystem of data governance, as discussed in Chapter 2, creating the conditions in which data can be successfully applied.
It is well understood that opening data allows for external stakeholders to generate public value on the basis of these data but, in a data-driven public sector, equal weight and attention are given to the internal experience. By improving the management and application of data at each stage in this process, policy makers and public officials can increase their effectiveness by enhancing their data capabilities and ultimately generating greater public value. The second half of this chapter will discuss in more detail how the use and reuse of data can bring that value and it is suggested that for a DDPS built on the government data value cycle, the value is generated from the outcomes of its final two stages. This can include gathering insight on existing policy activity; understanding the issues facing stakeholders; foreseeing new trends and needs; delivering higher quality services; designing and adapting innovative approaches; monitoring ongoing implementation activities; and managing the resources being used to address a particular challenge.
Valuing data as an asset
That the public sector should invest in its data capabilities seems self-evident, particularly as the virtues of data in the digital age have been broadly acclaimed by data evangelists. Human and technical resources focused on data are a priority in both the public and private sectors, with increasing time and money invested in the capture, management, processing and stewardship of data. There has been a 256% growth in data science jobs over 5 years (Indeed Hiring Lab, 2019[12]). Organisations have an intuitive recognition that spending money on data management saves money and reduces risks.
Those efforts are often able to identify the costs of data-related activities, but have been less effective at identifying the benefits of data use, thereby contributing to primarily seeing data as an expense rather than an asset. The ability for organisations to value the data they hold is therefore diminished if there is not a methodology for viewing it with an equivalence to other key assets, like staff and financial resources.
Indeed, while it is encouraging to hear government actors describe data as an “asset” in strategic documents setting out the goals for their future use of data, those documents are often less descriptive in terms of defining how the value of that asset will be calculated. It is essential for the intuition around data’s value to be replaced by a more robust definition for valuing it and providing the basis for business case investment and benchmarking impact.
In accounting terms, the three essential characteristics of an asset have been identified as (Godfrey et al., 2010[13]; Henderson et al., 2017[14]):
1. Does the asset have service potential or provide future economic benefits, where the benefit comes from the use of the asset or its sale?
2. Is the asset controlled by the organisation? That is to say, does the organisation have the power to benefit from the asset and deny or regulate how others access it?
3. Is the asset the result of previous activity? Has the asset been collected through a process, acquired from a source in some way, or through carrying out some work to develop it?
Data share these characteristics and can therefore be called an asset. However, how should that asset be valued? Data are not tangible assets and their value cannot be measured in the same way. For tangible assets, a measure can be taken in terms of an initial cost, the current market value or a calculated potential for generating future revenue. In the business context, such measurement is a priority, not only to support financial reporting to shareholders, but as the basis for mergers or acquisitions, and the calculation of tax.
Neither the private nor public sectors have yet developed a definitive model for measuring the value of data. This is an area which warrants further research, so it is encouraging to see that the Open Data Institute and the Bennett Institute for Public Policy at the University of Cambridge have recently announced a project to establish a taxonomy for valuing data as a route to identifying it as a foundation of data policy (Nuffield Foundation, 2019[15]). Nevertheless, in 1999, Moody and Walsh proposed seven laws for measuring the value of information (Box 3.2) that are helpful in considering some characteristics that can be quantified. Twenty years after those laws of information were identified, the conversation might now focus on data instead of information (discussed in more detail in Chapter 4), but their analysis remains insightful in identifying some of the practical ways in which the value of an intangible asset can be understood and measured.
1. Information is (infinitely) shareable
Data are an asset that can be shared between multiple people without any loss to their value. This is different from other assets, where multiple actors hold a proportion of the total value. Regardless of how many people have access to the data, it is as though they had exclusive access to it, meaning that value is cumulative, not apportioned: the greater the access, the greater the benefits. Having this understanding also challenges any behaviours at hoarding or duplicating data because they represent a loss of value. Duplication of data limits value because it increases storage costs, the potential for redundancy and risks associated with data quality in maintaining accuracy.
2. The value of information increases with use
Most tangible assets decrease in value the more that they are used, but the opposite is true for data – the more that data are used, the greater the return on investment. This is a particularly important point to consider in offsetting the costs associated with the different phases of the government data value cycle, not only to be clear that the marginal costs of data use are negligible in comparison, but also because it is only when data are used that they have value. Unused data are therefore a liability, incurring costs of storage, maintenance and security, rather than an asset.
3. Information is perishable
The value of data may depreciate over time. The speed at which this takes place depends on the type of data in question. Indeed, it is possible that in the public sector, there are certain datasets whose value may increase after a period, but this is usually through being combined or contrasted with other comparative data.
4. The value of information increases with accuracy
Inaccurate information can be incredibly costly in the context of the public sector. Decisions taken about policies or service outcomes that rely on incorrect data can have serious consequences. Nevertheless, this should not be interpreted as a requirement for an impossible standard of accuracy, but an important facet in developing a mechanism for valuing data as an asset.
5. The value of information increases when combined with other information
An important mechanism for unlocking the value of data is ensuring it can be compared and combined with other sources. The challenge of interoperability within the public sector can be an impediment to realising the full value of data both in preventing potential benefits and in adding costs by efforts to extract and reconcile different sources instead.
6. More is not necessarily better
With most assets, the more you have, the “wealthier” you are. The inverse is true for data, with increasing proliferation causing greater challenges in allocating limited resources.
7. Information is not depletable
In general, the more an asset is used, the less there is. However, data can often be self-generating: the more they are used, the more that exists. The value of the original data persists, plus the value of what has been derived from it through the process of further analysis and use.
Source: Moody, D. and P. Walsh (1999[16]), Measuring the Value of Information: An Asset Valuation Approach, http://si.deis.unical.it/zumpano/2004-2005/PSI/lezione2/ValueOfInformation.pdf.
Despite the challenges of treating an intangible asset in this way, it is important for public sectors to develop practical ways for identifying the value of data. As Ladley, in his book Making Enterprise Information Management (EIM) Work for Business (2010[17]), argues, “until data, information, and content are managed as other assets are managed, neither information nor data nor content has a chance to fulfil its potential within organisations”.
In doing this, the government data value cycle can provide a valuable way for disaggregating data-related activity into its constituent phases. By considering the costs and benefits associated with each of the four stages (collection and generation; storing, securing and processing; sharing, curating and publishing; and use and reuse), it becomes possible to define value. It is possible to assign data a cost in terms of how much effort is involved in obtaining and maintaining the data. It is also possible to assign a value to the utility of data in terms of where, by whom and how often it is used. This view minimises an understanding of data at rest in favour of reporting on and understanding those involved with using data and the applications to which it is being put. One approach to this could be the use of an internal balance sheet for tracking the value and activity associated with data assets (Laney, 2017[18]).
An approach to identifying the value of data in the public sector on this basis is shown in Figure 3.3. The left-hand side highlights the three areas in which costs are most likely to be incurred while the right-hand side shows the four positive benefits (in green) of using and reusing data and two disbenefits (in red) that would arise from data being poorly used or mishandled.

This exercise may highlight the priority of addressing some of the “data governance” issues discussed in Chapter 2. In the context of realising the value of data, it is important to get the foundations right so that countries are able to use existing data well as discussed in the OECD Digital Government Review of Sweden and the OECD Primer on Artificial Intelligence (OECD, 2019[19]; OECD Observatory of Public Sector Innovation, 2019[20]). These efforts can then support the opportunities offered by emerging technologies and ongoing delivery to provide transformed outcomes and unlock the latent value of their data (Ubaldi et al., 2019[21]). Chapter 2 identifies the prerequisites to be addressed in order for each phase of the government data value cycle to operate efficiently.
Using the government data value cycle as the basis for mapping data flows and understanding the sources and use of data helps to identify existing data held within an organisation and the situations in which data are not being used well. The DDPS is not focused solely on developing new services or processing the new scale of data provided by sensor data. Navigating and maximising the value of data that are already held within government is of critical importance. Indeed, there are increasing costs associated with storing, protecting and securing ever-greater quantities of data. In fact, Laws 2 and 6 of Moody and Walsh’s suggested laws of information (see Box 3.2) highlight the potential value of data to diminish if they go unused or are collected simply for the sake of doing so.
It is also important to recognise data as an asset in order to secure the trustworthiness of government and data itself (see Chapter 4 for more detail). This need forms the basis for the OECD Recommendation of the Council on Enhanced Access to and Sharing of Data being developed under the joint responsibility of the Committee on Digital Economy Policy, the Committee on Scientific and Technological Policy, and the Public Governance Committee. Data must be given an appropriate value in order to ensure that organisations give sufficient attention to securing and protecting it. Following the introduction of the European Union’s General Data Protection Regulation, organisations that do not take sufficient steps to secure their data will face significant penalties. Therefore, another way of establishing the value of data as an asset is in the value associated with the repercussions of a data breach.
Treating data as a valuable asset does not mean gathering more and more data or applying it indiscriminately. It means managing and being intentional in how value will be generated. This underscores the importance, discussed in Chapter 2, of knowing what is being gathered; who is gathering it; and the purpose behind any generation, collection, storage or sharing. Every other asset in an organisation is audited and identified, so it is critical that similar activities are carried out in order to understand how data are being treated as well as consideration for the ethical dimension (discussed in Chapter 4).
Establishing a case for data as an asset may prove valuable in helping to implement and establish a data-driven culture throughout the public sector by challenging organisational leaders to appreciate that their data will increase, or decrease, in value directly in relation to their efforts to manage and apply it. In pursuing the development of the DDPS, key performance indicators should be created for those with responsibility for the data agenda that set clear expectations for identifying ways in which data add value, and tackling any lost opportunities in terms of transforming a service or avoiding costs.
In conclusion, it is possible to attempt to measure data in the same way as something tangible. However, while a similar analysis in terms of cost, market value and potential for increased financial returns could be carried out, this is just one factor alongside the role and contribution of data in terms of offering greater accountability, measuring the effectiveness of a particular policy or service, or justifying investment in new and existing interventions. Therefore, any discussion of the value of public sector data must take place in the context of understanding how its usage generates public value, rather than simply as a latent asset. The next section will discuss this concept in terms of the generation of “public value” envisaged by the government data value cycle.
Public value
Having established that the government data value cycle provides the basis for thinking about the role and application of data within a DDPS, and explored how data might be defined and valued as an asset, the final part of understanding the value of data in the context of this chapter is in relation to the definition of “public value”.
According to the government data value cycle, it is in the final two stages that new public value is generated; that is in the sharing, curating and publishing of data as a raw material that allows for the use and reuse of that data to create or enhance something else. This could be either as OGD with an expectation of value to be generated by non-government actors (business, academia or civil society) or as data sharing internally within government to obviate the need for citizens to provide the same information to multiple parts of government. In this respect, the conversation about applying data to generate public value looks at the relationship between data as an input and its subsequent outcome.
The origins of the concept of “public value”, that is, the value an organisation contributes to society, can be traced to Moore (1997[22]), who wanted to find an equivalence to the private sector’s shareholder value within public management. His definition equated public sector managerial success with initiating and reshaping public sector activity in ways that increase its value to the public. Moore’s original work emphasised the importance of three particular areas of performance for public agencies:
1. delivering actual services
2. achieving social outcomes
3. maintaining trust and legitimacy of the agency.
This perspective has been complemented by the work of Meynhardt (2009[23]), who suggests that public value is created when there is an impact on a shared experience in terms of the quality of the relationship between the individual and society. While Talbot (2011[24]) emphasises the importance of the public’s perspective on what is valuable and important, public value is not declared by governments, but rather defined by what citizens understand to have gained.
The concept of the DDPS is based on the idea that the application of data can generate public value. In this context, there are several organising principles about how that value might manifest itself within these overall categories of delivering services, achieving social outcomes, and maintaining the trust and legitimacy of an agency.
Gross domestic product
One of the traditional ways of measuring the health and happiness of a country is to use gross domestic product (GDP). Using the size of a country’s economy as a proxy for the wealth of households and therefore the well-being of society has been a long-standing mechanism for understanding whether or not policies are proving successful at meeting political objectives. Although citizens do not necessarily directly acknowledge the impact of increased GDP, it is one of the areas in which the public value of data could be understood in terms of the financial benefits it might produce.
As discussed earlier, financial value is often the easiest way of defining the value of a tangible asset. In the case of data, that financial benefit has often been cited in terms of making the case for its greater use or release to the public. In Spain, the National Observatory of Telecommunications and the Information Society (ONTSI) publishes a yearly assessment of the “infomediary” sector of the economy, businesses that exist because of data. In 2016 ONTSI calculated that by 2015 OGD had generated an impact between EUR 600 million and EUR 800 million. In 2019, the Multisectoral Information Association reported the turnover for these businesses at EUR 1 796 million (ASEDIE, 2019[25]; OECD, 2018[26]).
The financial value of data has been a priority when it comes to making the argument for releasing OGD. In the 2017 OECD Open, Useful and Re-usable data (OURdata) Index (OECD, 2017[27]), 32 out of the 34 participating countries released government data in order to create new business opportunities for entrepreneurs and students. Certainly one of the great hopes of the OGD agenda has been the ambition to use these data to stimulate economic growth through the creation of new industries and business models and the jobs that would follow (OECD, 2018[26]). In the United Kingdom, the opening up of geospatial data through the Ordnance Survey’s OS OpenData™ initiative was identified as creating a benefit of GBP 8.1 million to GBP 18.2 million in productivity gains and GBP 4.4 million to GBP 8.3 million in additional real tax revenues (ConsultingWhere Limited and ACIL Tasman, 2013[28]). This is fairly modest compared to Canada’s 2015 assessment of the economic impact on the country’s GDP of opening geospatial data to be CAD 695 million (Hickling Arthurs Low Corporation, 2015[29]). Nevertheless, even though that figure sounds significant, it represents just 0.04%, so the GDP financial benefits of data perhaps remain somewhat elusive.
Government efficiency
The efficiency and effectiveness of government services is another means by which public value can be understood. In keeping with the definitions of public value advanced earlier, the increased efficiency of services can be directly experienced by citizens in their day to day lives as a result of digital government approaches (Welby, 2019[6]). Sometimes the citizen will directly experience the improvements to a service following the application of data. In other cases, a citizen may not be aware of the transformative impact of data on their services because government is able to proactively respond to their needs before they make a request or obviates the need for them to supply information because it has been accessed elsewhere in government. Such benefits result in time saved for citizens, but also in reduced back office processing and handling time for public servants too, resulting in increased throughput, fewer errors and greater cost efficiency from an operational point of view. Pollock (2010[30]) concludes that as well as the benefits in generating new products and services built with public sector information or those derived from developing complementary services and consultancy, data can provide indirect benefits, such as reduced transaction costs and increased efficiency of up to GBP 600 million per year.
The United States President’s Management Agenda (United States White House, 2018[31]) identifies a long-term vision of recognising government data as an asset. Public value is seen in modernising the federal government to improve the ability of agencies to deliver mission outcomes, provide better public services and steward taxpayers’ money.
Public sector efficiency gains are considered by several academics whose work has touched on the value of publishing OGD and is discussed in the OECD Open Government Data Report (OECD, 2018[26]). This aspect of public value is seen in how making OGD freely available reduces the overheads for organisations in disseminating this information as well as increases the more timely access to information. For others, efficiency is seen less as the external value of improved services and more in terms of cost savings and the improvement of internal processes. At a country level, the recognition that OGD can increase the efficiency of services was acknowledged in the 2017 OURdata Index (OECD, 2017[27]), with 31 of the 34 participating countries stating an intent to improve public sector performance through the release of data (OECD, 2018[26]). In Luxembourg, many datasets have been opened for public use, but its main users have been within the public sector itself. Historically, a lot of geodata (cadastre, aerial imagery, topographic maps, address register) were licensed at cost between different public sector bodies, but by removing this cost and opening the data, they can be more widely used, generating increased public value.
The McKinsey Global Institute has calculated potential efficiency gains at EUR 250 billion per year within the European public sector (Manyika et al., 2011[32]) and between USD 35 billion and USD 95 billion per year in the United States by 2020 (Lund et al., 2013[33]). The private sector can also provide a guide in terms of defining the potential productivity gains in a data-driven approach with McAfee and Brynjolfsson (2012[34]) finding that such companies were, on average, 5% more productive than their competitors.
Social value
The previous two definitions of public value have tended to be rooted in financial measurements, but if public value is only defined as GDP and focused on efficiency, then it would be simply “economic value”. A 2006 study by the Center for Technology in Government (Cresswell, Burke and Pardo, 2006[35]) found that the ability of government to realise the full value of money spent on IT investment cannot be solely measured in terms of financial results. Instead, the experience they found in five case studies from Austria, Israel and the United States saw that the value of government spending existed in the broader political and social returns to the public at large rather than just the internal value to government operations (as discussed above).
In the United Kingdom, HM Treasury issues guidance to public servants on how to construct business cases. As well as setting out the expectations for how investment might be secured, The Green Book calls on public servants to focus on the generation of “social value” in its framing of any costs and benefits (Box 3.3). Together with the public value framework (HM Treasury, 2019[36]), a tool for understanding how well public money is turned in to policy outcomes, these are important contributions from a usually financially focused body to broaden the perspective on defining value.
Costs in the appraisal of social value
Total direct public costs (to originating organisation):
capital
revenue
Total indirect public costs (to other public sector organisations):
capital
revenue
Wider costs to UK society:
monetisable, including cash costs
quantifiable but unmonetisable costs
qualitative unquantifiable costs
Total risk costs (the costs of mitigating or managing risks):
optimism bias (decreased as estimated risk costs are included)
estimated or measured risk cost
Benefits in the appraisal of social value
Direct public sector benefits (to originating organisation):
cash-releasing benefits
monetisable non-cash releasing benefits
quantifiable but not monetisable benefits
qualitative unquantifiable benefits
Indirect public sector benefits (to other public sector organisations):
cash-releasing benefits
monetisable but non-cash releasing benefits
quantifiable but unmonetisable benefits
qualitative unquantifiable benefits
Wider benefits to UK society (e.g. households, individuals, businesses):
monetisable, including cash benefits
quantifiable but not monetisable benefits
qualitative unquantifiable costs and benefits.
Source: HM Treasury (2018[37]), The Green Book: Central Government Guidance on Appraisal and Evaluation 2018, https://assets.publishing.service.gov.uk/government/uploads/system/uploads/attachment_data/file/685903/The_Green_Book.pdf.
The OECD has had a long-standing effort to develop measures for understanding both trust and well-being as part of the Better Life Initiative. The well-being framework (Figure 3.4) shifts the focus away from aggregated economic conditions towards a definition of social progress. It does so by looking to identify the impact of public policies in terms of outcomes rather than purely because of inputs and outputs (OECD, 2017[38]). This results in a blended approach that considers the objective, and subjective, aspects of life and an approach that considers the distribution of experience across a population, thereby incorporating questions of inequality and sustainability into the definition of well-being.
The New Zealand government has taken the radical step of rethinking its approach to public spending and is moving away from the pursuit of GDP growth to instead focus on well-being. The country’s 2019 budget requires all new spending to go toward five specific well-being goals: 1) bolstering mental health; 2) reducing child poverty; 3) supporting indigenous peoples; 4) moving to a low-carbon-emission economy; and 5) flourishing in a digital age. It uses a living standards framework that is built from citizen level data and tracked with concrete indicators. This builds on a long-standing interest in that country in exploring the possibilities of “social investment” (Acquah, Lisek and Jacobzone, 2019[39]).
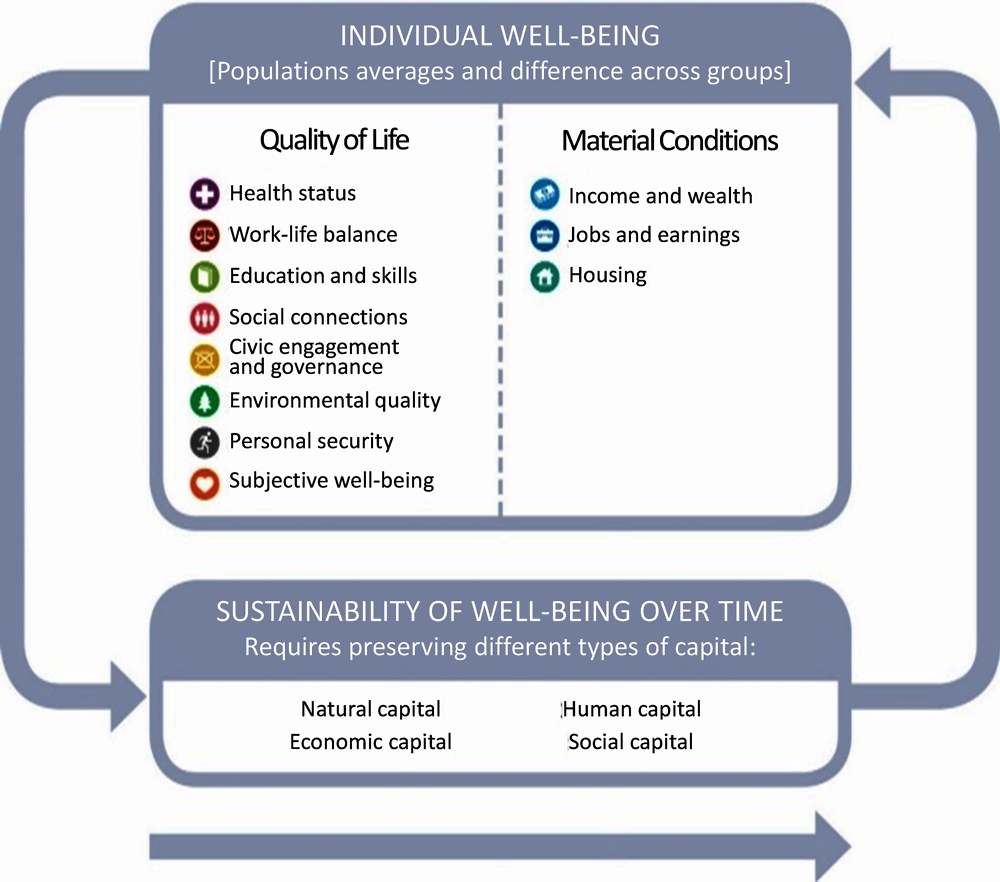
Source: OECD (2017[38]), How’s Life?: 2017 Measuring Well-being, https://dx.doi.org/10.1787/how_life-2017-en.
Engagement and participation
Central to the definitions of “public value” referenced above are citizens and their understanding and participation in the value that is created. Therefore, the application of data to generate public value is not only about making the data available, whether as OGD or in its role in providing public services, but also ensuring that it can be understood and seeking the engagement and participation of citizens.
The ambition for increased transparency and greater accountability of government through the publication of OGD has been an important factor in its success (OECD, 2018[26]). The publication of OGD and the communities that have emerged around particular themes and policy sectors demonstrate that it has created public value in terms of citizen engagement and participation. Chapter 4 will go into more detail about the role of data in building public trust, and highlight ways in which governments can provide effective consent mechanisms for helping citizens to understand the specifics of how their data are being used. While this is important at a technical level, there is also a role for increasing the data literacy of the public and exploring innovative ways of incorporating their perspectives.
An emerging trend in the assessment of public value that looks at engagement and participation and is relevant to the application of data are “mini-publics”. “Mini-publics” are “a group of citizens, demographically representative of the larger population, brought together to learn and deliberate on a topic in order to inform public opinion and decision-making” and may take the form of a citizen jury, a consensus conference, deliberative poll or citizen assembly (Breckon, Hopkins and Rickey, 2019[40]).
The example of Ireland (Box 3.4) offers insight into how this process blends the application of data in evidence-based policy making with the generation of public value. Randomly selected citizens have been brought together to work through the issues and implications of politically challenging and sensitive topics. This necessitates good facilitation between citizens and experts in order to help engage with evidence and data. It also requires a commitment on the part of the public to fulfil their citizen duties in grappling with complicated issues and considering the broader, societal picture. Where such processes are understood to reflect public participation (and so fulfilling the aforementioned definitions of “public value”), people see any subsequent activity as delivering value, even if it does not follow their personal preferences (Talbot, 2011[24]). However, this means that the value of the exercise owes a lot to the extent to which governments commit to giving “mini-publics” power over the political agenda, similar to the way a judge has to behave in line with the pronouncement of a jury in court.
Ireland first explored the potential of citizen juries in 2012 when the Irish parliament commissioned the Convention on the Constitution. It consisted of 100 members: an independent chair, 29 members of the Irish parliament, 4 representatives of Northern Irish political parties and 66 randomly selected citizens of Ireland.
The Convention was mandated to consider eight specific topics:
1. reducing the presidential term of office to five years, aligning with local and European elections
2. reducing the voting age to 17
3. reviewing the Dáil electoral system
4. giving citizens residing outside the country the right to vote in presidential elections at Irish embassies, or otherwise
5. provision for same-sex marriages
6. amending the clause on the role of women in the home and encouraging greater participation of women in public life
7. increasing the participation of women in politics
8. removal of the offence of blasphemy from the Constitution
as well as an additional two selected by the Convention itself:
9. Dáil reform
10. economic, social and cultural rights.
The Convention met over ten weekends of a day and a half. Each meeting had three components: 1) a presentation by experts of papers circulated in advance; 2) debate between groups advocating on either side of an issue; and 3) roundtable discussions involving facilitators and note takers. On Sunday morning, the members considered again the discussions of the previous day and voted on a ballot paper reflecting the details of the debate.
The government formally responded to each of the papers put forward by the Convention, putting three to a public referendum, two of which – an amendment to the Irish Constitution allowing same-sex couples to marry and removing the offence of blasphemy from the Constitution – were passed.
In 2016, following a general election and a new session of the Dáil, a new “mini-public” was formed. The Irish Citizens Assembly again comprised 100 members, including an independent chair, but unlike the Convention, was formed entirely of citizens. Most notable within this session was the debate and recommendation concerning Ireland’s ban on abortion. As with the Convention, the Oireachtas did not simply implement the view of the Citizens Assembly, but responded by forming a Joint Committee whose report was enacted and gave the Irish public the ultimate decision via a referendum.
Sources: Breckon, J., A. Hopkins and B. Rickey (2019[40]), Evidence vs Democracy: How “Mini-publics” Can Traverse the Gap Between Citizens, Experts, and Evidence, https://media.nesta.org.uk/documents/Evidence_vs_Democracy_Report_Final.pdf; Arnold, T. (2014[41]), “Inside the Convention on the Constitution”, https://www.irishtimes.com/news/politics/inside-the-convention-on-the-constitution-1.1744924.
While “public value” can be easily understood at a conceptual level in terms of making an improvement that is understood and recognised by members of the public, it is clear that there are various ways in which that value can be generated. This section has considered the possibility of measuring “public value” through growth in GDP, government efficiency, social value, well-being, or engagement and participation.
There is no single approach for defining “public value” in the application of data, with activities under each of these categories offering different opportunities and routes to realising value. To help identify the most suitable means of defining value, it is important to clarify the reason for seeking to create value, the problem one is trying to solve and the need that needs to be met. One way of ensuring the need is understood from several perspectives is to involve the public and to bring together a diverse, multi-disciplinary team. Delivering successful outcomes and responding to the challenges facing diverse communities requires the collective involvement of external stakeholders as well as those from across policy, delivery and operational teams. This can help to avoid situations where public data are put to uses that diminish public trust and legitimacy while unlocking revolutionary approaches to how governments think about providing services to citizens and how they measure efficiency in service delivery as well as user satisfaction (Welby, 2019[6]).
Understanding, defining and measuring the value of data as an asset and its contribution to public value relies on ensuring the government data value cycle is acknowledged and each step in the process is clearly mapped and measured. Establishing the baselines and benchmarks for the use of data within, and between, government organisations is an important prerequisite for identifying value. Nevertheless, in developing business cases and securing political commitment, often this value needs to be defined on a financial basis. The United Kingdom’s approach in seeking social value, and discussed in Box 3.3, may be helpful in showing how both financial and non-financial measurements might still be defined in cash terms.
The data governance approach discussed in Chapter 2 is fundamental to the success of DDPS efforts. Ensuring the leadership, capacity to deliver and necessary legal frameworks as well as architectural and infrastructure approaches that enhance the data value cycle should be a priority. Getting this right makes it possible to explore ways for applying data to generate public value, with the confidence that the necessary foundations are in place to achieve successful outcomes and provide a robust measurement of its value.
A DDPS approach is essential for countries to maximise the potential of digital government approaches for transforming the provision of public goods and services and contributing to increasing citizen well-being. This chapter has discussed a framework for defining the value of data, but the focus will now turn to examples of ways in which data might be applied to take full advantage of the opportunities offered by the DDPS approach.
Van Ooijen, Ubaldi and Welby (2019[3]) propose that the opportunities of DDPS fall into three categories of anticipatory governance, design and delivery, and performance management. One of the aims of this report is to provide an analytical and conceptual framework that can be applied throughout the public sector and across policy areas, to foster more data-driven approaches to policy making and serviced design and delivery. Figure 3.5 proposes an expanded definition that recognises the opportunities for applying data to generate public value as being a broader and more generalised set of three connected and reinforcing behaviours.
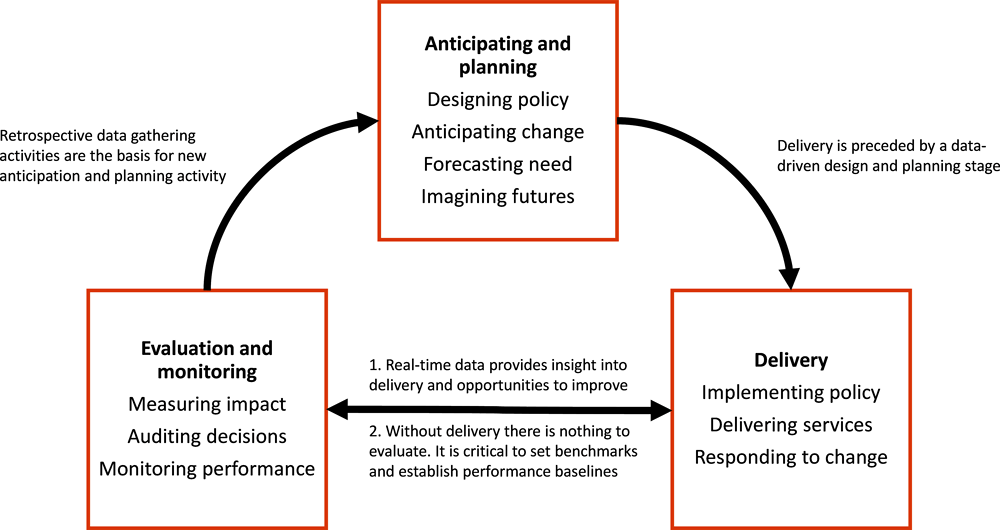
The first phase is “anticipation and planning”, with its understanding of the role of data in designing policy, anticipating change, forecasting need and imaging future possibilities. This phase focuses on how data can be used to look ahead, whether to anticipate a multiplicity of potential futures or in preparing to take action to resolve a particular problem. “Anticipation and planning” relies on a variety of sources for the data to carry out these activities, including those generated through the evaluation of previous and ongoing interventions.
The second phase, “delivery”, and the activities associated with implementation of policies, the practical delivery of services and the immediate challenges of responding to change focuses on how data are used on an ongoing basis to shape delivery and draw attention to issues that might need an instant response or improve existing delivery modalities. “Delivery” relies on successfully implementing analytical tools and defining effective performance measurements to be able to harness the data that emerge from delivering a service, often in real time, and to quickly and effectively interpret it and apply any resulting insights.
Third, “evaluation and monitoring” in terms of measuring impact, auditing decisions and monitoring performance, is focused on retrospectively analysing events that have taken place and drawing insights from the data generated through the “delivery” phase. As such, there is an important feedback loop between this phase and the “delivery” phase. “Evaluation and monitoring” is a critical source of value in its own right, but also contributes significantly to any associated “delivery” and subsequent “anticipation and planning” efforts that look to learn from previous interventions.
These three areas offer distinct opportunities for applying data to generate value. But as Figure 3.5 showed, there is a flow of data and outputs between them. Therefore, while the remainder of this chapter will consider each phase in turn, this is not to suggest that these are silos with data having value in one phase only. Instead, these phases should be seen as a continuum, where the application of data in the “anticipation and planning” phase may lead to a set of deliverables, during the “delivery” of which new data will be generated and insights applied and which subsequently will provide the data for the “evaluation and monitoring” of performance and impact. The example of San Francisco’s holistic efforts to improve service delivery for disadvantaged youth (Box 3.5) illustrates this. This reflects the ongoing, iterative cycle of delivery that is advocated through a digital government approach of seeing policy, delivery and operations as informing and influencing one another through a multi-disciplinary, cross-sectoral and cross-functional collaboration.
Sharing data between different organisations within the public sector can be one of the greatest challenges to improving outcomes and delivering public value. In the city of San Francisco, the experience of disadvantaged youth prompted the heads of foster care, juvenile probation and mental health departments to work with the city’s attorney to facilitate the limited exchange of case information among the necessary agencies. This transformed the level of care for children interacting with these agencies due to an improvement in case co-ordination and the identification of overlapping clients.
This was made possible thanks to an integrated data system that recognised and focused on the families that were the most vulnerable, most troubled and most in need. As a result of the data integration, it was possible to carry out “evaluation and monitoring” activities that resulted in the realisation that 2 000 users of services consumed half the resources of the department, and that most of those families lived within walking distance. As a result, the Human Service Agency concentrated “delivery” of services in specific neighbourhoods and co-located services at community centres, further increasing efficiency and the quality of service delivery.
As a result of this new linked data source, subsequent “anticipation and planning” efforts were able to be carried out that provided a better assessment of the needs of high-risk youth, identifying opportunities to divert them from damaging future events, understanding where youth were falling through the cracks and establishing what services were needed to intervene earlier to prevent those negative outcomes.
Initially supported by a low-tech system, the system was transferred to a more sophisticated platform to enable the three agencies to better understand the interplay between the data. Creating a shared view of the data highlighted that those clients who were under the care of multiple systems were at higher risk of committing a crime. It found that 51% of San Franciscans involved in multiple systems were convicted of a serious crime, 33% had been served by the 3 agencies, and 88% of these youth committed a crime 90 days after becoming involved with multiple agencies. This offered a critical window of opportunity for the caseworker to intervene and provided the justification for a web-based integrated case management system to make this connection in real time.
Source: OECD (2015[42]), Rebooting Public Service Delivery: How Can Open Government Data Help to Drive Innovation?, www.oecd.org/gov/Rebooting-Public-Service-Delivery-How-can-Open-Government-Data-help-to-drive-Innovation.pdf.
Anticipating and planning
The first phase in which countries are demonstrating their ability to apply data to generate public value is in looking to the future in terms of planning, or imagining what might be required to better support their societies. The future is unpredictable and cannot be reliably foretold. There will therefore be scenarios where the necessary data do not, and cannot, exist but decisions will still need to be taken. In those cases, a methodology for identifying public value and understanding the purpose of the intervention and measuring its impact are helpful in subsequently judging whether or not a decision taken without data has had the desired outcome or not.
Nevertheless, it should always be a priority to attempt to obtain the necessary data for attempting to mitigate the risks associated with the unpredictability of the future. Assuming that such data have been sourced, the “anticipation and planning” phase can begin to see data applied to define and plan an intervention, provide the evidence to support policy-making activity, and the anticipatory governance pursuits of foresight and forecasting. Being prepared to source data in shaping the anticipation and planning of future activity and future needs means countries are able to respond to the unpredictable as well as the planned. Moreover, when governments consider how they might be proactive in responding to the needs of their citizens, it is important that they explore not only related services, but also every opportunity to reimagine the status quo. The ongoing work of the OECD Working Party of Senior Digital Government Officials (E-Leaders) to explore the future of government and collaborate on how to maximise the opportunities of the digital age is an important resource to help governments prepare for, and respond to, these challenges.
In certain policy domains, it will be impossible to source the necessary data. One approach to this scenario is to invite the private sector and civil society actors to share some of the risk. In Korea, funding is made available through the “Public sector big data analysis projects” competition to incentivise new ways of applying the insights provided by the country’s data to its policy challenges. This provides an experimental freedom to develop models that focus on a particular problem, and which can then be scaled, free from the constraints of the government’s own policy and delivery agenda. In the United Kingdom, the Land Registry and Ordnance Survey worked with Geovation, the United Kingdom’s location and property data lab, to find members of the public with big ideas for transforming society using location or property data and help turn those ideas into viable projects. To date, GBP 23 million has been invested in 84 start-ups across 10 market sectors (Geovation, 2019[43]).
More usually, “anticipating and planning” will be able to identify existing sources of data with which to plan. Sometimes those efforts will have been prompted by a high-profile policy failure, or the prioritisation of a new policy for ideological reasons. Perhaps a think tank, the media or academics will have carried out an analysis of data that shifts the agenda of government. Other times, the evaluation of some ongoing activity and the collection of new data may prompt efforts to target a different outcome. The experiences of Denmark, Ireland, Korea, Portugal, Sweden and the United Kingdom in the research which led to the analysis presented in this report all indicated that when data were used to provide an anticipatory position, it was mostly as a reaction to some existing data or activities with a view to creating a new, forward-looking perspective.
The idea of anticipatory governance is also relevant in the context of innovative public sector data governance, as discussed in Chapter 2.
Evidence based policy making
The first area to consider in terms of the “anticipation and planning” phase is the use of evidence to design policy interventions that respond to forecasted challenges. This is not the same as the forecasting activities (discussed later), which attempt to predict whether or not a policy would be effective. It is about the approaches which countries take to experiment with a particular approach and consider as wide a spectrum of intervention as possible to shape future policy interventions, informed by the availability of data. This is not solely the domain of governments and public servants, as think tanks, journalists and academics are some of the actors involved in thinking through how to respond proactively to the needs of society based on data.
One of the most critical factors in securing the use of data as evidence in pursuit of policy making in the design, implementation and evaluation phases is establishing standards for that evidence. The OECD’s Expert Group on Standards of Evidence has proposed six characteristics (Box 3.6) that should be implemented in order to support evidence-based policy making.
The OECD Expert Group on Standards of Evidence has developed six standards for evidence:
1. Appropriateness: Evidence should be selected to address multiple political considerations, useful to achieve policy goals and consider the local context.
2. Integrity (honest brokerage): Individuals and organisations providing evidence for policy making need processes to ensure the integrity for such advice, including managing conflicts of interest, ethical conduct and the influence of lobbying.
3. Accountability: Those setting the rules and shape of official evidence advisory systems used to inform policy making should have a formal public mandate, and the final decision authority for policies informed by evidence should lie with publicly accountable officials.
4. Contestability: Evidence must be open to critical questioning and appeal, can include enabling challenges over decisions about which evidence to use.
5. Transparency: Information should be clearly visible and open to public scrutiny. The public should be able to see how the evidence bases informing a decision are identified and utilised. Transparency is also part of the OECD Guiding Principles for Regulatory Quality and Governance, as well as the Open Government Principles.
6. Deliberation: There should be space for engagement that enables members of the public to bring their multiple competing values and concerns to be considered in the evidence utilisation process. This is also about co-design and co-creation of policies and participation from an open government perspective that contributes to evidence.
Source: OECD (forthcoming[44]), Standards of Evaluation: A Review of International Perspectives.
Some countries have developed guidance for public servants on using OGD in the development of policy. According to the 2017 OURdata Index survey, Austria, Colombia, the Czech Republic, Finland, France, Japan, Korea and the United ingdom have all developed overarching guidelines on how best to use OGD to inform policy-making processes (OECD, 2017[27]). While these countries are providing guidance for public servants, Denmark, Norway, Spain and the United States are using OGD to enhance the public debate around policy and develop co-responsibility for responding to its challenges. Moreover, Chile, Colombia, France and Israel are hoping the release of OGD will facilitate the crowdsourcing of solutions for public policy problems by tapping into the collective intelligence of the public (OECD, 2018[26]). In Mexico, the 2013-18 National Digital Strategy stresses the importance of OGD in contributing to achieving policy outcomes – land management improvement, the digital economy, and natural disaster prevention and mitigation (OECD, 2016[45]).
Korea has developed a standardised model for analysing “big data” within the public sector so that data generated in one part of the public sector can be compared with what is generated elsewhere. The use of the resulting models informs policy making in 18 areas, with 320 standardised models having so far been provided to 175 organisations. There are plans to introduce similar models in categories including citizen services, tourism, transportation, closed-circuit television (CCTV) and public housing. Such standardisation minimises local differences in the analysis which takes place between different institutions, and in particular central and local governments. This allows policy to be informed with a more accurate and comprehensive understanding of a given dataset.
In Denmark, significant effort has gone into the handling of education data. A databank and data warehouse provide institutions, regions, municipalities and the public access to a number of predefined reports and graphs with statistics. There is also the possibility for people to define their own reports on certain aspects of the data it contains.
In Ireland, the biggest use of data for policy making is in mapping. The Ordnance Survey of Ireland’s Geohive service provides easy access to publicly available geospatial data. Combined with data from other sources, these mapping data underpin analysis of housing trends and flood risk. A further development in Ireland is the creation of Pobal, a website and support service providing information on deprivation profiling in a particular area, details of local childcare services and information about other funded services available for people to access. This resource is not only for policy makers, but for citizens and community organisations as well.
One of the most powerful opportunities offered by the application of data in evidence-based policy making is in its potential to support a change in approach. In the Flemish region of Belgium, a spending review was carried out with the intent of developing policies that would create jobs in order to meet the needs of the communities. However, the analysis showed that the greatest need was in serving elderly citizens with requirements for domestic services rather than for jobs.
Anticipatory governance
A second area during the “anticipating and planning” phase in which the DDPS approach can generate public value is that of anticipatory governance. Anticipatory governance describes systematic efforts to consider the future in order to inform policy decisions today. In this context, governments respond proactively rather than reactively, based on knowledge and evidence rather than experience and protocol. The use of data leads to the better detection of societal needs as they emerge and improves predictions for future needs. This is a particularly important activity in the context of innovation. The OECD’s Observatory of Public Sector Innovation has recently initiated an “Anticipatory Innovation Governance” project to analyse the challenges and opportunities in this space.
Data-enabled prediction and modelling techniques support governments in anticipating societal, economic or natural developments that are likely to occur in the future. They may also capture early warnings and better assess the need to intervene. Additionally, governments that are built on strong data foundations are able to deliver proactive government services that anticipate the needs of citizens and obviate their need to interact with the state, without necessarily realising that has happened.
This reflects macro anticipation at a societal level in terms of understanding emerging trends and carrying out “predictive” activity to inform long-term planning. However, it also reflects the micro anticipation in terms of an individual and their needs. At that level it is not about predicting what an individual is going to need based on their historic choices and presenting them with the existing solution, but about a deeper transformation of the design of the state based on a deep understanding of life events and the sort of interactions that are associated with a given set of services.
Anticipatory governance falls into two categories: forecasting and foresight.
Forecasting
Forecasting in the DDPS context is to use existing data and trends to try to predict the most likely developments and outcomes. Data-enabled predicting and modelling techniques of this sort may support governments in anticipating societal, economic or natural developments that are likely to occur in the future. Forecasting capabilities attempt to spot emerging needs, and anticipate new ones, based on observable trends, be they physical or digital, as in the example in Box 3.7.
The emergency departments of hospitals can often become overcrowded and struggle to respond to patients in a timely manner. Any delay in the care of a patient can increase patient mortality and so Australian hospitals have a target of treating emergency department patients within four hours.
To help hospitals meet this target, the Commonwealth Scientific and Industrial Research Organisation developed the Patient Admission and Prediction Tool (PAPT). Using a hospital’s historical data, it can provide an accurate prediction of the expected patient load, their medical urgency and specialty, and how many will be admitted and discharged.
PAPT is now being extended to predict diseases such as influenza and the hospital admissions of patients with chronic diseases.
It is currently in use in 30 hospitals and has shown a 90% accuracy rate in forecasting bed demand. If PAPT were rolled out across Australia, it would equate to AUD 23 million in annual savings.
Source: Dods, S. et al. (2013[46]), Evidence-Driven Strategies for Meeting Hospital Performance Targets: The Value of Patient Flow Modelling, https://doi.org/10.4225/08/584c43f4df82b.
In a DDPS, the necessary resources are in place to support forecasting as a mechanism for developing early-warning systems, sentiment analysis of social media and real-time decision support systems (Höchtl, Parycek and Schöllhammer, 2016[47]). The increasing ubiquity of mobile devices and social media platforms means public authorities have a wider range of routes to gather valuable information from citizens related to their daily lives as well as their needs, preferences and behaviours. Taken together, these data allow governments to better assess needs, design more appropriate policy measures and be more precise in estimating an expected impact.
In Mexico, the government established Datalab as a specialist data laboratory to develop these capabilities. One area of focus is strengthening anticipatory governance approaches in order to generate data-based predictions of, for example, populations at risk regarding diseases, zones with emerging environmental problems and future arising conflicts (OECD, 2018[26]). Also in Mexico, the Ministry of Energy is using a predictive workforce planning and analytics model to identify current and future talent and skills gaps in critical oil and gas occupations over a ten-year horizon (Deloitte, 2016[48]).
In Portugal, funding has been directed towards projects using data science to focus on risk mitigation. One successful project has been analysing the skills of the unemployed labour force compared to the needs of the job market in order to identify those most at risk of becoming long-term unemployed and consequently providing them with targeted training.
Ireland is using social media analytics to model welfare provision and has used predictive data analysis concerning the future needs of the country to support policy associated with Project Ireland 2040, a government-wide exercise to plan for the challenges and opportunities of the next 20 years.
Foresight
In the context of a DDPS, foresight is associated with horizon scanning in order to define problems; it does not attempt to predict the future. It is instead a systematic approach to explore multiple plausible versions of how the future could be different from expected and use those insights to shape policies in ways that can be more agile in responding to them. The most relevant data for foresight processes are those that might identify emerging changes in the present, which could grow into significant and disruptive developments in the future.
The OECD’s Strategic Foresight Unit plays an important role in strengthening the capacity of national governments by co-ordinating the Government Foresight Community that consists of over 100 experienced foresight professionals working in governments and international organisations around the world. Additionally, the OECD’s Observatory of Public Sector Innovation curates a collection of foresight-related resources within its Toolkit Navigator.2
The necessary skills and capacities to carry out successful foresight activities may not always be available, but in Australia the Public Sector Innovation Toolkit provides a practical guide to horizon scanning in the public sector. It offers a grounding in what horizon scanning is and how to do it, with checklists and materials to support public servants beginning to apply it in their own context.
Skills and capabilities are not the only prerequisite for successful foresight; the provision of, and access to, the necessary data are too. Furthermore, a foresight mindset requires a commitment to a longer term outlook rather than the short-term political cycles that can sometimes cause policies to focus on immediate issues or demands rather than longer term planning. Given these factors, it is unsurprising that outside the centre of government, foresight activities are more limited. In particular, the OECD/Bloomberg Survey on the innovation capacity of cities indicates that foresight and prospective exercises is an area in which cities are lacking (OECD/Bloomberg, 2019[49]).
Several OECD countries have established institutions that take the lead on exploring the foresight dimension of anticipatory governance. In Canada, Policy Horizons operates at the federal level to help the Government of Canada develop future-oriented policy and programs that are robust and resilient in the face of disruptive change. Using the foresight method means that the team takes data from the past and extrapolates it into the future using a variety of tools, from statistics to simulations. In Portugal, the Centre for Digital Competencies of the Public Administration (TicAPP) within the Administrative Modernization Agency, has as part of its mission the development of quantitative and predictive models that allow the use of available data to support the political and administrative decision process. Additionally, Portugal also has LabX, an Experimentation Lab for Public Administration created in 2016 to embed a culture of innovation in the Portuguese public administration, (re)designing public services around citizens’ needs and expectations, and promoting an evidence-based approach to policy making through testing and experimentation in a controlled environment. The role of labs for policy experimentation and foresight is similarly being explored in the United Kingdom, where the Government Policy Lab and the What Works network are two examples of initiatives that look to generate data and then analyse them in order to model different policy scenarios.
Designing services and policy interventions
One of the most compelling opportunities for DDPS is the way in which the application of data can reshape the opportunities for designing better policy interventions and services through a deeper and more rounded understanding of the needs of citizens and engaging citizens as co-creators of value. While this is part of “anticipation and planning” activities, there is a clear linkage between the design and the “delivery” phases.
As countries develop their data governance models (as discussed in Chapter 2) and embed a more sophisticated understanding of the government value data cycle, the use and reuse of data within government becomes more sophisticated. The flow of data around government, its cataloguing and the easing of access to it means that there is the potential for more deeply integrated service design opportunities. Furthermore, as citizens are invited to participate in the design of services and contribute to the user research establishing their needs, services begin to reflect the actual needs and circumstances of citizens.
In the United Kingdom, the Government Digital Service has developed a set of mandatory guidelines for assessing and assuring the quality of any public-facing government services. This Service Standard contains 14 points and is administered through a series of assessments at different stages in the implementation cycle. The role of qualitative and quantitative data in understanding the needs of citizens and their behaviours when interacting with public services is highlighted throughout. Particularly relevant to the role of data in “anticipating and planning” the design of services is the requirement to consider the role of qualitative and quantitative data in ensuring that the responsible teams have understood the needs of their users and are subsequently able to respond to them on an ongoing basis. A similar standard exists in Canada with one of its principles requiring Canadian public servants to be good data stewards and collect data from users only once and reuse wherever possible whilst also ensuring that data are managed securely, and in ways that facilitate reuse.
Another important aspect of the design phase of planning for both the “delivery” and the “evaluation and monitoring” of services and policy interventions is the initial effort required in benchmarking performance and measuring success. In order to generate the maximum public value, it is essential to clearly define the purpose of its application; but this is only half the exercise. The other half is identifying how to measure the value and judge the success, or otherwise, of a given intervention.
In the United Kingdom, citizens can choose to join the organ donation register. The team responsible for increasing its coverage worked with the team responsible for administering the United Kingdom’s single government domain, GOV.UK, as well as teams from the Driver and Vehicle Licensing Agency, the National Health Service, the Department for Health, and the Cabinet Office’s Behavioural Insights team to explore how they might influence a particular user journey to generate more signups.
The policy need was to increase the profile of organ donation in a sensitive way. To do that, the team ran experiments on the final stage in the journey for people renewing their vehicle tax. In total, they experimented with eight different designs of content and images viewed by in excess of 1 million visitors. As a result, they could identify one of the proposed alternatives was more effective than the original language. In the course of a year, this led to 350 000 more organ donors joining the register.
This example highlights the potential value of exploring nudge-based policy interventions backed up by data capabilities. In this case, the policy team was able to work with a delivery vehicle in the shape of GOV.UK that was responsive to updates and could be used for experimentation. However, it relied on a culture of evaluating data to consider how to improve the approach and maximise both the public return on investment and broader societal value.
Source: Cabinet Office et al. (2013[50]), Applying Behavioural Insights to Organ Donation: Preliminary Results from a Randomised Controlled Trial, https://assets.publishing.service.gov.uk/government/uploads/system/uploads/attachment_data/file/267100/Applying_Behavioural_Insights_to_Organ_Donation.pdf.
Delivery
The second phase in which countries demonstrate their ability to apply data to generate public value is the day-to-day activity of delivering services and operating government. As is shown in the case studies accompanying this report, the “delivery” phase is not limited to a focus on services, but reflects a broader perspective that accommodates the role of data in less visible areas of the public sector’s work.
As the phase where the most significant interactions between citizens and governments take place, there is an important relationship between “delivery” and the discussion of an enabling data governance model from Chapter 2, the mechanics of implementing the government data value cycle earlier in this chapter, and the implications of data on trust discussed in Chapter 4.
The way in which the DDPS approach manifests itself during “delivery” informs how effectively the value of data can be realised in both the “anticipation and planning” and “evaluation and monitoring” phases. The link between “delivery” and “evaluation and monitoring” is particularly strong as a DDPS culture will strive to introduce feedback loops that are constantly providing the ability to improve the quality of delivery. These feedback loops, which can be provided by both qualitative and quantitative mechanisms, enable governments to move away from a top-down design and implementation of public services to the formulation of well-targeted service design and need-based policy implementation and service delivery, thereby increasing the reach and effectiveness of services.
Nevertheless, the use of data to shape the “delivery” of government is not always a priority, particularly when it comes to the use of OGD. Most countries view its role in improving public service delivery as secondary, with greater efficiency and effectiveness of services not a main objective of OGD policies and initiatives (OECD, 2018[26]).
The following section will look at how the application of data in the “delivery” phase can generate “public value” in four ways: 1) improving public services that respond to citizen needs; 2) giving public servants the capacity to focus on meeting other needs; 3) communication and engagement with the public; and 4) responding to emergencies, crises and other developing situations.
Improving public services that respond to citizen needs
A DDPS approach enables a closer working relationship between policy design and service delivery activities with a resulting shift from top-down implementation of public services to a user need led approach to design and delivery, based on an end-to-end understanding of a particular service journey, which can consequently increase its reach and effectiveness.
Inclusive user-driven approaches towards government service delivery can be strengthened through the forward-looking approaches highlighted in the previous section on “anticipation and planning”. The analysis of data produced by the behaviour and characteristics of existing users can facilitate predictive activities identifying potential new users and/or emerging needs and problems. While this will inform the development of new services to address unmet needs, there is also the possibility of proactively enhancing the existing approach to address issues in the existing service. As a result, government services can continue to improve, responding to the rhythm of people’s lives and continuously evolving to meet their needs and expectations, in pursuit of delivering greater public value.
Much of the public value that can be generated from developing the use of data in the “delivery” phase of improving public services may take place in ways that are not immediately obvious to an external user. Addressing the regulatory, data architecture and data infrastructure challenges discussed in Chapter 2 offers the potential to transform interoperability of data between government organisations, thereby allowing the prefilling of information and making the once-only principle of data submission a reality. Such efforts can be particularly powerful in reducing the scope of what would be involved in bringing the “long tail” of analogue processes and services on line.
Indeed, the application of data to the delivery of services can accelerate innovation cycles. This is not only because the environment is conducive to experiment with emerging technologies, implemented on a strong foundation of reliable data, but also through more agile design approaches. The Lean Startup (Ries, 2011[51]) approach of build-measure-learn encourages a minimum viable approach to be put in front of users as soon as possible in order to learn and continuously iterate and improve. The embedding of a data-driven approach with this delivery culture means it will be easier for public institutions to know how citizens use their services, or how satisfied they are with them, learn from it, and adapt the design and delivery accordingly.
A further hidden value is the capacity for public service providers to deliver in a proactive way, i.e. to deliver a service before a user has had to engage the state. The aggregation of citizen data from different public institutions allows governments to build a more complete view of the needs of their citizens and address what otherwise might be a disjointed experience if a citizen had to interact with multiple parties. Citizens may view such an approach negatively, as indicative of a “surveillance state”, even if the intentions are noble. Therefore, the discussion about data and trust, explored in detail in Chapter 4, is essential in ensuring that where DDPS activities are driven by the personal data of citizens, the necessary steps are taken to ensure it protects, and enhances, the trustworthiness of government.
A more visible release of public value from a DDPS approach to the “delivery” of services is in the experience of citizens crossing borders. Data exchange between countries can facilitate new forms of international co-operation such as that seen in the European Union’s development of the eIDAS standard and the Mi Argentina mobile application making it possible for digital credentials to be recognised in multiple countries (Box 3.9). There are also further automated benefits, such as that between Estonia and Finland, where exchange of basic business register data is expected to facilitate the development of business between the two countries (OECD, 2015[52]).
Argentina’s driving licence
In Argentina, the Mi Argentina mobile application allows citizens to access a digital version of their driving licence. It has the same legal validity as the physical equivalent and is automatically generated if the citizen is already in possession of a valid driving licence. The National Digital Driver’s Licence is built on top of the Argentinian Digital Identity System that provides remote validation of citizens’ identity using biometric data.
Because so many Argentinians regularly travel across the border to neighbouring Chile and Uruguay, efforts have been made with their respective governments for this digital licence to have the same validity in those countries. This approach has benefitted from the Digital Agenda Group of the Southern Common Market working together to identify and prioritise public services that could be delivered across borders.
European Regulation 910/2014 (eIDAS)
In the European Union, cross-border recognition and legitimisation of identity mechanisms are backed not by the reuse of a particular set of credentials, as in the case of Argentina, but by a focus on developing an agreed standards approach to those technical solutions.
The eIDAS regulation provides an important legal basis to the delivery of cross-border services and the easy movement of citizens from one jurisdiction to another within the single market. Established in EU Regulation No. 910/2014 of 23 July 2014, it has been providing the legal underpinnings to the conditions under which member states have developed and enhanced Digital Identity solutions that could be recognised by other countries and reused by citizens to access services throughout the single market.
From 29 September 2018, any organisation delivering public services in an EU member state must recognise electronic identification from all EU member states. The development of digital identity approaches on the basis of standards makes it possible for services to be accessed across a region without people needing to create them every time.
Sources: Jueguen, F. (2019[53]), “Lanzan la versión digital del registro de conducir que se podrá 'llevar' en el celular”, https://www.lanacion.com.ar/economia/lanzan-version-digital-del-registro-conducir-se-nid2219177; Bracken, M. (2019[54]), “Argentina just made driving licences digital”, https://public.digital/2019/02/12/argentina-just-made-driving-licences-digital; OECD (2019[55]), Digital Government Review of Argentina: Accelerating the Digitalisation of the Public Sector, https://doi.org/10.1787/24131962; European Union (n.d.[56]), eIDAS: The Ecosystem, https://www.eid.as/home.
Moreover, an understanding of demand for services themselves can provide a clearer view of the service delivery landscape in a society, allowing to better target specific channels to specific segments of the population to ensure no citizens are left behind. Box 3.10 provides examples from Portugal and Mexico.
Data analysis and an interoperability platform unlocked support for an extra 600 000 people in Portugal
In Portugal, the insights from data have transformed the support provided to some of the most vulnerable households in the country. The government created a Social Energy Tariff to subsidise energy costs. The service required eligible users to sign up and register, but the initial data showed that those who should have benefited from the tariff were not registering for it.
When research was carried out to understand why, they learnt that it was because citizens did not know that they had to ask for the special tariff. As a result, the decision was taken to automate the process. However, in order to do this, data needed to be shared between the Directorate General for Energy and Geology, energy companies, the tax system, and the social security system.
Fortunately, Portugal’s Interoperability Platform for the Public Administration (iAP) had been developed for exactly this scenario, providing access to a diverse set of services from both public and private sector partners. As a direct result of being able to use the Interoperability Platform for automating the Social Energy Tariff, the number of households receiving the tariff increased from 154 648 to 726 795, providing financial support to 7% of the Portuguese population for the cost of their energy without requiring them to validate their eligibility.
Combining data to ensure support reaches those with the greatest need
In Mexico, the Ministry of Social Development is responsible for providing social services to citizens. By combining household, beneficiary and geographic data, it has been possible to build a new system for targeting support to those that need it the most with the purpose of improving the living conditions for the poorest populations in Mexico.
Working with a civil society partner, Data Science for Social Good, the Ministry of Social Development focused on increasing the accuracy of targeting the support to eligible individuals and families. The three goals were:
1. identify individuals who qualified for, but had not used, particular programmes
2. combine datasets to better predict household needs and potentially inform the design of new social service programmes
3. detect people who had under-reported their income and stop them from receiving any further assistance.
Sources: Information provided by Portugal to the OECD; Data Science for Social Good (n.d.[57]), Enhancing the Distribution of Social Services in Mexico, https://dssg.uchicago.edu/project/enhancing-the-distribution-of-social-services-in-mexico.
Several of the countries that participated in the comparative project that provided the baseline of insights and evidence used to back up the analysis included in this report indicated that there was an overlap in their use of data to improve public service delivery and its use in developing evidence-based policy making. This close relationship between policy design and service delivery demonstrates the importance of recognising the relationships between each phase in the application of data.
In Denmark, Korea and Portugal, legislation has been passed to address the needs and structure of base data registries. These are a valuable enabler for the delivery of data-driven services because they limit the proliferation of duplicate data, provide a reliable source for the most important datasets, and reflect a coherent approach to the internal access to, and sharing of, data. In Korea, the “Public sector big data analysis projects” have been successfully scaled to bring benefits to different population groups. These have included citizen-visible services, such as understanding where best to locate electric vehicle charging infrastructure, through to the less public applications of data in delivery, like detecting suspected evasion of military service or tackling traffic accident-related insurance fraud.
Giving public servants the capacity to focus on meeting other needs
Improving the “delivery” of public services offers a very tangible indicator of an increase in public value from the perspective of citizens and businesses whose lives may be simplified. However, alongside those benefits are those more hidden from view in terms of their implications for internal staff.
One of the arguments that has been used to justify the digital transformation of government has been the opportunity to reduce the headcount of those working in frontline roles. As more and more services are available on line, the demand in person is expected to decrease and those roles will become redundant. This perspective is based on some incorrect assumptions. First, it expects a behaviour we cannot be certain of, i.e. that all users will shift to online platforms to access the services. Second, it takes for granted that the digital transformation is simply a quicker way of carrying out the same activities as before, rather than an opportunity to rethink the way in which services are provided. Thus, in a situation where services are transformed, the role of back office and frontline staff changes too. This can happen in several ways:
By addressing the common case interactions, public servants are able to focus more time and energy on answering more challenging questions.
As those who are comfortable with using digital services make the transition away from face to face services, those who continue to provide in-person support are able to devote more energy to the needs of those who might otherwise be digitally excluded.
The increase of digital submissions and the reuse of data from across government reduces the potential for errors. This reduces the prospect of having to follow up and clarify something that can delay the fulfilment of the original service.
There are also possibilities for real-time analytical information to be used across service centres and telephone support lines to predict demand and manage staff time accordingly. For example, this could extend to developing the capability for reallocating public servants from one category of enquiry to another in response to unforeseen spikes in demand.
Communication and engagement with the public
The most recent Survey on the Organisation and Functions of the Centre of Government (OECD, 2017[58]) identified the most important objective of communication strategies. Figure 3.6 shows that communicating government actions was the highest priority, with only 8% of respondents having the objective of encouraging participation or promoting transparency, and a mere 4% reporting that they were attempting to improve links with citizens. This does not reflect the OECD Recommendation of the Council on Open Government, which calls for a “culture of governance that promotes the principles of transparency, integrity, accountability and stakeholder participation in support of democracy and inclusive growth” (OECD, 2017[59]). It also contrasts markedly with the strong characteristic of the OGD and open government movements where data are understood as a valuable device for fostering civic engagement in the design and delivery of public services and policies in order to strengthen a more people-driven and participatory form of democracy (OECD, 2018[26]; Ubaldi, 2013[4]).
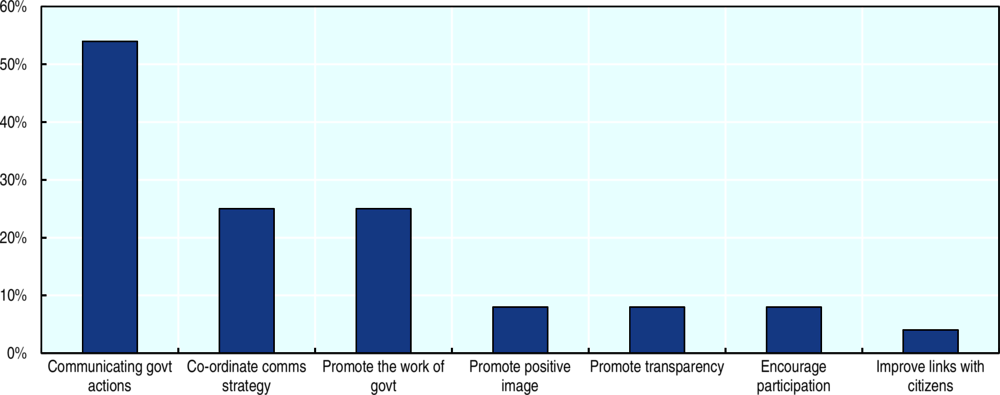
Source: OECD (2017[58]), Survey on the Organisation and Functions of the Centre of Government.
The potential for OGD to stimulate greater engagement and opportunities to communicate with the public is clear. In Chile, the Ministry General Secretariat of the Presidency put out a call to artists to develop original digital content with OGD and showcase the possibilities. In every corner of the globe, countries are hosting hackathons that encourage teams to come together and work with OGD in response to particular challenges; these include the Accountability Hackathon in the Netherlands, the CANDEV data challenge in Canada, the OpenGovDataHack and Hack the Plan in India, and GovHack in Australia, among others.
However, the experience of Sweden and HackforSweden (OECD, 2019[60]) is particularly inspirational. HackforSweden currently works with almost 100 Swedish government agencies and companies to promote innovation through open data with the explicit intent to create a platform for citizen-driven responses to societal needs and seeking collaboration to co-create public value. From humble beginnings in 2014, HackforSweden is now moving away from annual events to seek ongoing engagement and creativity from the digital ecosystem in the country with the mission to swap 200 people at an event for 2 million people connected through a platform in just 2 years (Hack for Sweden, n.d.[61]).
Outside of OGD, the potential for DDPS approaches to be utilised by governments to communicate with the public is currently underexploited. According to the comparative research carried out with the six OECD countries, only Denmark and Sweden could provide concrete examples of how policy initiatives were in place to encourage the use of data to engage societal stakeholders. This means that Korea, Ireland, Portugal and the United Kingdom have not made this a priority.
This is unfortunate because the use of data can support the process of debating policy options with visualisations offering accessible ways of presenting detailed information about particular problems. Concepts that are hard to communicate verbally or dense sets of numbers or co-ordinates can be transformed into tools that facilitate valuable discussion and engagement exercises. In the context of generating public value, Morabito (2015[62]) argues that communicating how data have been used in accessible ways can have a positive effect on citizens’ sense of achievement and their satisfaction with government services.
In Denmark, the approach to property tax was redesigned in order to provide citizens with a more transparent view of the system based on better data and the use of improved statistical methods. In handling the transition from old to new, data visualisations were used to provide clarity for citizens. By prioritising transparency and openness in the change, citizens were not only able to understand the policy in general terms, but the government invested in the capabilities and data literacy of citizens to understand how it affected them specifically.
Responding to emergencies, crises and developing situations
The final area of opportunity for adding public value associated with the “delivery” phase of the DDPS is the way in which public sector organisations are able to respond to emergencies, crises and developing situations.
Emergencies and crises by their very nature cannot be predicted. While their impacts can be minimised, it is impossible to be prepared for every eventuality at all times. This underscores the importance of the “anticipation and planning” stages in terms of the design and foresight activities for thinking through what might be needed in the event something went wrong. Indeed, the OECD Recommendation of the Council on the Governance of Critical Risks emphasises the importance of building preparedness through foresight analysis, risk assessments and financing frameworks, to better anticipate complex and wide-ranging impacts (OECD, 2014[63]).
In Seoul, Korea, the mayor has invested a significant amount of money in developing a 3.5 metre wide dashboard on the wall of the office providing a real-time feed of interesting data about the health and vitality of the city and its inhabitants, including the cost of living, demand for housing and the real-time budget position. This is helpful operational insight that can shape the political priorities and ongoing service delivery in the city. However, the effort has been made to consider how this resource might add value in the event of an emergency. During an emergency, the dashboard comes into its own, providing a live feed of the situation unfolding and giving the mayor direct contact with those on the ground (Crawford, 2017[64]).
In Singapore, the challenges of overcrowded and ageing transport infrastructure coupled with the country’s “smart nation” ambitions prompted the development of the Fusion Analytics for Public Transport Emergency Response (FASTER) initiative. With FASTER, anonymised location-based information is collected and combined with fare card transactions and video feeds from stations to identify overcrowding. When crowds are detected, additional buses are deployed and messages are relayed to customers allowing them to plan accordingly. These data provide detailed models of how users move through the city, helping the government to understand traffic patterns, how the transport network is used and issues to address with the network.
Evaluation and monitoring
The third and final set of behaviours in the DDPS framework for applying data to generate public value is that of “evaluation and monitoring”. A DDPS recognises that ongoing evaluation and monitoring is enhanced through the application of relevant data. These activities focus on measuring and analysing activity that has already happened. While a reaction to this may take place in the short term, the purpose of this activity may also stand alone as a reflection on what has been achieved or grow in value after some time when it is used to inform a new purpose.
The evaluation of performance and monitoring of a real-time data society is closely tied to the “delivery” activities discussed in the previous section. The data generated in this phase inform the “anticipation and planning” of subsequent projects. This phase is critical in shaping the pace of decision making, targeting of investment and capacity to respond to change. Crucially, the perspective in this section is that data in the public sector lead to an understanding of performance, so that an iterative approach to either the ongoing refinement of activity or subsequent planning follows. This is not simply reporting for the sake of reporting.
A DDPS fosters an environment in which data about real-time policy interventions are available. Policy makers no longer have to wait for monthly or quarterly updates in areas such as migration, unemployment and demographics, because the data they need are becoming available, and accessible, at a higher frequency. Consequently, this provides better insights into the policy process and enables quick policy adjustments in the short term, resulting in increased accountability and continuous improvement in the mid- and long terms.
This highlights the interconnectedness between the different dimensions of the DDPS value framework and underscores how important it is that no “anticipation and planning” or “delivery” should take place without considering the question of how activity will be evaluated, performance monitored and impact measured. In light of that, this section will consider policy evaluation, operational performance, demonstrating return on investment, and accountability and transparency. The kind of data activities that will be discussed are those which look to allow the measurement of impact, the auditing of decisions and the monitoring of performance.
Policy evaluation
The first area in which the “evaluation and monitoring” of data can generate public value is in the process of evaluating the success, or otherwise, of policy interventions. In a well-functioning democratic society, the implementation of policy is scrutinised by a variety of actors. There are those who wish to ensure government resources have been effectively managed, those motivated by a desire to understand the impact of the intervention and those who may be looking for political opportunity to exploit. These actors have competing priorities, but the reporting of progress, particularly if done in public, offers an evidence-generating activity that can hold the tension of the spectrum between politically motivated and ideological claims at one end, and theoretically unbiased and rational evidence-based policy making at the other.
In this sense, the evaluation of policy after its implementation complements the use of evidence in the initial design and development of a policy intervention. The insights generated from evaluating policy are critical for iterating and developing new policy approaches and it is in responding to the evaluation of what has been done that governments can generate public value. Nevertheless, beyond the direct application of data in shaping government activity, “evaluation and monitoring” data serve an important role when shared in being used, and reused, to inform and equip politicians, journalists, academics and the wider public.
Increasing the amount of data associated with the outcome of a given policy allows for agile policy adjustments in the short term, but more importantly will generate better insights into the policy process in terms of accountability and learning in the mid- to long term. Those responsible for a given policy can establish whether their policies have had the desired effect or not and, if those data are published as OGD, so can other stakeholders. As a result, policy evaluation can turn into an open, inclusive and ongoing process rather than an internal, snapshot moment. The ability to reduce the lag between the design of a policy, its implementation and insights into its performance should not just have theoretical and conceptual value, but should provide the basis for rapidly informing “delivery” activity and remedying any unintended adverse effects (Höchtl, Parycek and Schöllhammer, 2016[47]). While the monitoring of performance might be prompted by a top-down desire for oversight and reporting on delivery, a DDPS is interested in how those insights can be analysed and, crucially, applied in improving performance based on a deeper understanding of the needs of the organisation and its users.
Carrying out retrospective evaluation and analysis is helpful in keeping an open mind as it encourages an ongoing learning from experience and stimulates efforts to adapt future policy as a result. Putting in place mechanisms to gather, and apply, new insights set an expectation that lessons will be learnt and new insights gained. Taking this approach enhances the ongoing quality of outcomes. The OECD/Bloomberg (2019[49]) report on Enhancing Innovation Capacity in Cities establishes that “those cities which evaluate … are better positioned to scale up innovative projects that improve operations, and less likely to engage in practices or projects that offer little return on investment”. Being open to the “evaluation and measurement” of impact is indicative of a more sophisticated appreciation for the role of data that will manifest itself throughout the policy and delivery life cycle.
It is therefore encouraging that Figure 3.7 shows five of the six researched countries (Korea, Denmark, Ireland, Portugal and the United Kingdom) implementing some steps to strengthen policy monitoring and evaluation throughout the government data value cycle. Denmark, Ireland, Korea and Portugal are particularly focused on how they might strengthen policy monitoring and evaluation by investing in the capacity to analyse the data. As discussed in Chapter 2 in the context of identifying the necessary conditions for successfully implementing the DDPS, the skills of public servants, and the public, are critical for maximising public value. All five of those countries have taken steps to make the sharing of data a focus, which as discussed at the beginning of this chapter is a critical factor in successfully creating a whole-of-government approach to generating public value through data.

Source: Based on information provided by six OECD countries in response to the Questionnaire on the State of the Data-driven Public Sector in OECD Countries, Question 16: “Has your country implemented policy initiatives at the central/federal level to strengthen policy monitoring and evaluation through better data management and use? (e.g. using data to enable continuous and/or automated policy monitoring and inform agile policy adjustments)”.
The previous section discussed the role of data in enhancing communication and engagement between the public sector and the public. Those examples discussed how the government to citizen relationship might be facilitated, but there are opportunities and possibilities for government to develop a greater understanding of the impact of policy on citizens. In a DDPS, organisations can analyse a wealth of input to evaluate policies from crowdsourcing initiatives, but they may also be able to gather these insights without necessarily asking for them directly, as discussed in Box 3.11. Similar to some of the practices mentioned in the earlier discussion on forecasting, data from a myriad of digital channels can be accessed and analysed, revealing the opinions and behaviours of citizens, and subsequently used to evaluate policy. When exploring these issues, governments must act with sensitivity and in ways that are informed by the framing of the debate in Chapter 4.
To monitor progress with Sustainable Development Goal (SDG) 16 on Peace, Justice and Strong Institutions, which has a key focus on corruption, the Tunisian National Statistics Institute and the United Nations Development Programme launched a pilot using social media to better understand citizens’ perceptions of government. Traditional methods (such as household surveys) were insufficient because of their infrequency and cost.
The pilot involved conducting a network analysis of web and social media (e.g. news, blogs and Twitter) to identify relevant content and determine whether its tone was positive or negative in order to gauge citizen perceptions of corruption. To help determine accuracy, the team compared the results of the social media analysis with the results of Tunisia’s Household Survey on Governance, Peace and Democracy, which contained questions on citizen perceptions of corruption. Over the same time frame, both the survey and social media provided the same perception on corruption, and the social media analysis had the additional benefit of being faster, more regular and less expensive. Tunisia has begun testing this approach with other targets from the same SDG, namely human rights and rule of law, and civic participation.
Source: OECD (2017[65]), Fostering Innovation in the Public Sector, https://dx.doi.org/10.1787/9789264270879-en.
Operational performance
A second area for considering the “evaluation and monitoring” activity of the DDPS is in how data can transform the operational performance of government, leading to both more productive and effective use of public resources and developing a culture of continuous performance improvement. Measuring performance is an “evaluation and monitoring” activity that has to happen retrospectively. Nevertheless, applying its insights, it is tightly coupled with the quality of government “delivery”. This relationship once again highlights how important it is for clarity about the purpose behind the application of any data.
Public value can be unlocked in terms of the direct impact it has on the activity of government, as discussed in the “delivery” section, but also in the more hidden, structural activities of government. For example, data about the real-time status of physical assets can be used to better plan maintenance with the least disturbance to service continuity as possible (OECD, 2016[66]). The complementary case study “Data-Driven Human Resource Management” focusing on public employment and management highlights how people analytics might change approaches to recruitment, retention and the ongoing performance management of staff, as well as understanding how to improve the environment in which they work to ensure their productivity and well-being.
While an increasing amount of our transactional relationships are moving on line, safeguarding the built environment and our material conditions continues to be an important function of government. The application of data can allow for targeting scarce resources, such as focusing policing on areas with high criminal activity (Höchtl, Parycek and Schöllhammer, 2016[47]).
In Korea and Portugal, entrants to competitions focused on the use of data have been encouraged to target improvements to the efficiency of government operations. One of the success stories from Korea is the development of a data model for identifying businesses most likely to present a risk. Twelve months after its introduction, there had been an increase in the proportion of inspected workplaces violating the Labour Standards Act from 40.9% to 77.7%, almost doubling the impact of inspection staff in terms of public value. A similar impact was achieved in the United States, where the city of New York’s Department of Buildings pooled data with 19 other city agencies. The outcome of that collaboration was a five-fold return on the value of an inspector’s time, with the rate of detecting high-risk property conditions increasing from 13% of inspections to above 70% (OECD, 2018[26]).
Demonstrating return on investment
Because public sector organisations are accountable for the money they spend and there are always more demands for funding than there are available resources, sophisticated investment and procurement processes have been developed. The OECD Recommendation of the Council on Public Procurement (2015[67]) promotes a strategic approach throughout the different sectors and levels of the public sector with guiding principles addressing the entire procurement life cycle. Specifically within the context of digital government, Recommendation 9 of the OECD Recommendation of the Council on Digital Government Strategies (2014[68]) emphasises the importance of business cases to reinforce digital policy. The ongoing work of the OECD Working Party of Senior Digital Government Officials (E-Leaders) has included a focus on developing business cases and transforming ICT commissioning.
This third aspect of “evaluation and monitoring” looks at the way in which a DDPS approach can support arguments for funding and measurement of the impact of that spend. Public value in this case is then much more closely aligned with financial accountability over spend, improved procurement decisions and the ability to describe the outcomes that were made possible. In Denmark, several initiatives within the national digitisation strategy are informed and supported by an analysis of the value of data sharing in the transformation of internal activities within government.
Demonstrating return on investment is another activity that relies strongly on the clarity of intent for any DDPS activity. Measuring the impact of a given set of activities requires setting a baseline and developing a methodology to understand costs and benefits. These need to be considered when a public sector organisation is deciding to invest money in tackling a problem or designing a policy intervention during the “anticipation and planning” stage. They then need to have been implemented during the “delivery” phase. This ensures that there is always recognition of the value of an investment, as the example in Box 3.12 shows.
In the context of data-related spending, and particularly OGD, the focus has sometimes been on measuring the act of publication as a policy outcome, resulting in the objective to increase the number of datasets available for public access. This can mean efforts are made to releasing data rather than for its reuse. While release is a prerequisite for creating value in the use of data, any measurement for calculating the public value returned through investment on data-related efforts needs to consider defining benchmarks for both the sharing, curating and publishing stage and the use and reuse stage of the government data value cycle.
The United Kingdom’s HM Revenue and Customs department has developed data models to help focus its compliance activities. The models help to identify people who may be most likely to be non-compliant on their taxes, such as by making errors in their tax returns or deliberately trying to evade taxes. The models take into account information such as taxpayers’ prior compliance and information from the tax return itself, such as income and occupation, in order to assign a risk probability of non-compliance. A wide range of data can be fed into these models to assist in calculating the risk probabilities, and as the amount of data grows, so does the ability to build on the models to improve their performance.
Oversight programmes such as this offer some of the easiest ways to earn returns on investment for government analytics projects, as the financial savings are often significant. The analytics model for targeting value-added tax evasion is estimated to bring in around GBP 200 million a year in additional revenue due to improved compliance-targeting efforts, doubling the amount of revenue collected for each compliance caseworker.
Source: OECD (2017[65]), Fostering Innovation in the Public Sector, https://dx.doi.org/10.1787/9789264270879-en.
Accountability through audit trails and transparency
This final area of the “evaluation and monitoring” activity within the DDPS concerns accountability, and in particular the role of data as a tool for providing access to government records and encouraging a culture of transparency. The role of integrity actors in government relies heavily on the successful implementation of the DDPS. The case study on “Data-Driven Integrity” highlights the opportunities that present themselves in an associated but different approach to accountability, namely the prevention of fraud and corruption.
The importance of auditing activities and the desire for transparency in government should not be underestimated as the basis for making the argument about increasing the profile of data-related activity within government. In the context of OGD, that agenda has been a significant driver in seeing data published in line with the OECD Recommendation of the Council on Open Government (OECD, 2017[59]; Ubaldi, 2013[4]).
More broadly, public sector organisations should be interested in exploring how the impact of a policy can be demonstrated in ways that build accountability and stimulate trust with the public. This echoes some of the discussion earlier in the chapter around the analysis of “delivery” activities. Box 3.13 presents the example of Japan, whose whole-of-government approach to evidencing the impact of policy comes from the very top of the government (supporting the importance of leadership and vision discussed in Chapter 2). Within that context, the analysis and evaluation of a policy intervention is not only seen as promoting greater accountability, but provides the underpinning to ensure that a particular policy intervention is having the desired effect. Adopting robust methods like these to measure, and publish, the evidence about the reality of a policy or service not only during a pilot or alpha but throughout, can form the basis of arguing for future funding and, over time, demonstrate return on investment as well as helping to create a culture of accountability.
Data governance
In Japan the Strategic Conference for the Advancement of Public and Private Data Utilization, chaired by the Prime Minister and comprising all ministers, government chief information officers and expert advisors, has had national oversight for the data agenda since 2017. Support is provided by the Council on Promoting Evidence-based Policymaking and the presence of a Director-General for Evidence-based Policymaking in each ministry.
During the policy life cycle, the Administrative Evaluation Bureau within the Ministry of Internal Affairs and Communications and the Administrative Reform Promotion Headquarters Secretariat assess every policy evaluation and project review to check that evidence and data are being used at every stage. The data in these reviews are openly available to the public and the process can be watched on line.
This accountability is not only valuable for increasing democratic governance, reliability, integrity and legitimacy, but also ensures there is a continuous empirical challenge to whether or not a policy intervention is achieving the intent that was originally envisioned.
Using randomised controlled trials to evaluate Internet of Things technologies
Japan’s ageing population means that it is a priority to identify ways in which technology can contribute to the provision of high-quality and effective care while reducing costs. One area of focus has been on the care for patients suffering from dementia and exploring whether Internet of Things (IoT) devices could help prevent the disease or reduce the costs associated with its treatment.
In the first case, dementia patients accommodated in nursing facilities were randomly divided into two groups. One group acted as the control group and had no change to their care while the other group underwent interventions using IoT services. The symptoms of dementia disappeared within four months for 34% of the control group and 74% of the intervention group.
In the second case, IoT devices were provided to patients and their activity logged and scored. Based on the data supplied to their medical teams, patients were rewarded with points. Those points could be used like cash. A baseline for healthcare costs was established for each of those who received the devices and those who formed part of the control. After a year, the increase in healthcare costs from that baseline was calculated. The data showed that on average the healthcare costs of those using IoT devices were 56% of those in the control group, a saving per patient of JPY 50 000. Among the most elderly patients, the saving was JPY 90 000.
Source: Advisor to the Ministry of Internal Affairs and Communications, Japan (2019), “Is evidence contributing to public accountability? Evidence from Japan”.
In Portugal, the Health Service Transparency Portal,3 and the justice transparency portal4 provide open access to performance data on a sectoral basis. Moreover, at the municipal level, data and dashboards are provided by the Municipal Transparency Portal,5 detailing the local use of public money and the performance of the services they provide. In Denmark, Statistics Denmark6 provides a common platform for reporting data relating to the performance of the country. These performance insights include the presentation of data about the effectiveness of policy. In the United Kingdom, all services are required to publish their performance data as part of the Service Standard, but this does not always identify the success, or otherwise, of a service in relation to its policy intent.
References
[39] Acquah, D., K. Lisek and S. Jacobzone (2019), “The role of evidence informed policy making in delivering on performance: Social investment in New Zealand”, OECD Journal on Budgeting, No. 19, OECD Publishing, Paris, https://dx.doi.org/10.1787/74fa8447-en.
[41] Arnold, T. (2014), “Inside the Convention on the Constitution”, The Irish Times, https://www.irishtimes.com/news/politics/inside-the-convention-on-the-constitution-1.1744924.
[25] ASEDIE (2019), 2019 Infomediary Sector, Asociación Multisectorial de la Información, http://www.asedie.es/assets/asedie.-infomediary-sector-report-2019.pdf.
[54] Bracken, M. (2019), “Argentina just made driving licences digital”, Public Digital, https://public.digital/2019/02/12/argentina-just-made-driving-licences-digital.
[40] Breckon, J., A. Hopkins and B. Rickey (2019), Evidence vs Democracy: How “Mini-publics” Can Traverse the Gap Between Citizens, Experts, and Evidence, Alliance for Useful Evidence, https://media.nesta.org.uk/documents/Evidence_vs_Democracy_Report_Final.pdf.
[50] Cabinet Office et al. (2013), Applying Behavioural Insights to Organ Donation: Preliminary Results from a Randomised Controlled Trial, Cabinet Office, London, https://assets.publishing.service.gov.uk/government/uploads/system/uploads/attachment_data/file/267100/Applying_Behavioural_Insights_to_Organ_Donation.pdf.
[28] ConsultingWhere Limited and ACIL Tasman (2013), Assessing the Value of OS OpenData™ to the Economy of Great Britain - Synopsis, Department for Business, Innovation & Skills, https://assets.publishing.service.gov.uk/government/uploads/system/uploads/attachment_data/file/207692/bis-13-950-assessing-value-of-opendata-to-economy-of-great-britain.pdf (accessed on 1 July 2019).
[64] Crawford, S. (2017), How South Korea is Building a Techno-Utopia in Seoul, https://www.wired.com/story/how-seoul-is-reinventing-itself-as-a-techno-utopia (accessed on 15 November 2018).
[35] Cresswell, A., G. Burke and T. Pardo (2006), Advancing Return on Investment Analysis for Government IT: A Public Value Framework, Center for Technology in Government, University at Albany State University of New York, https://www.ctg.albany.edu/media/pubs/pdfs/advancing_roi.pdf.
[57] Data Science for Social Good (n.d.), Enhancing the Distribution of Social Services in Mexico, https://dssg.uchicago.edu/project/enhancing-the-distribution-of-social-services-in-mexico.
[48] Deloitte (2016), Global Human Capital Trends 2016, Deloitte, http://www.deloitte.com/us/hctrends (accessed on 14 February 2019).
[2] Department of the Navy (2017), Strategy for Data and Analytics Optimization, US Department of the Navy, https://www.doncio.navy.mil/uploads/Final_DON%20Strategy%20for%20Data%20and%20Analytics%20Optimization.pdf.
[46] Dods, S. et al. (2013), Evidence-Driven Strategies for Meeting Hospital Performance Targets: The Value of Patient Flow Modelling, CSIRO, https://doi.org/10.4225/08/584c43f4df82b.
[56] European Union (n.d.), eIDAS: The Ecosystem, https://www.eid.as/home (accessed on 29 August 2018).
[9] Finansdepartementet S3 (1998), Förordning (1998:1234) om det statliga personadressregistret, https://www.riksdagen.se/sv/dokument-lagar/dokument/svensk-forfattningssamling/forordning-19981234-om-det-statliga_sfs-1998-1234 (accessed on 26 July 2019).
[43] Geovation (2019), Geovation website, https://geovation.uk (accessed on 4 July 2019).
[13] Godfrey, J. et al. (2010), Accounting Theory, John Wiley, https://www.wiley.com/en-au/Accounting+Theory,+7th+Edition-p-9780470818152.
[7] Government of Korea (2017), Electronic Government Act, http://www.law.go.kr/LSW/eng/engLsSc.do?menuId=1&query=%EC%A0%84%EC%9E%90%EC%A0%95%EB%B6%80%EB%B2%95&x=0&y=0#liBgcolor0.
[61] Hack for Sweden (n.d.), The Mission, https://hackforsweden.se/the-mission (accessed on 12 July 2019).
[14] Henderson, S. et al. (2017), Issues in Financial Accounting, 16th Edition, Pearson, https://pearson.com.au/products/H-J-Henderson-Scott-et-al/O-R-Peirson-Henderson-Herbohn-Artiach-How/Issues-in-Financial-Accounting/9781488611643?R=9781488611643.
[29] Hickling Arthurs Low Corporation (2015), Canadian Geomatics Environmental Scan and Value Study, Natural Resources Canada, http://giscourses.net/wp-content/uploads/2015/05/Canadian-Geomatics-Environmental-Scan-and-Value-Study.pdf?189db0.
[36] HM Treasury (2019), Public Value Framework, HM Treasury, London, https://www.gov.uk/government/publications/public-value-framework-and-supplementary-guidance.
[37] HM Treasury (2018), The Green Book: Central Government Guidance on Appraisal and Evaluation 2018, HM Treasury, London, https://assets.publishing.service.gov.uk/government/uploads/system/uploads/attachment_data/file/685903/The_Green_Book.pdf.
[47] Höchtl, J., P. Parycek and R. Schöllhammer (2016), “Big data in the policy cycle: Policy decision making in the digital era”, Journal of Organizational Computing and Electronic Commerce, Vol. 26/1-2, pp. 147-169, https://doi.org/10.1080/10919392.2015.1125187.
[12] Indeed Hiring Lab (2019), Data Scientist: A Hot Job That Pays Well, Indeed Hiring Lab, https://www.hiringlab.org/2019/01/17/data-scientist-job-outlook.
[53] Jueguen, F. (2019), “Lanzan la versión digital del registro de conducir que se podrá ’llevar’ en el celular”, La Nacion, https://www.lanacion.com.ar/economia/lanzan-version-digital-del-registro-conducir-se-nid2219177 (accessed on 29 March 2019).
[17] Ladley, J. (2010), Making Enterprise Information Management (EIM) Work for Business: A Guide to Understanding Information as an Asset, Morgan Kaufmann, https://doi.org/10.1016/C2009-0-61376-3.
[18] Laney, D. (2017), Infonomics: How to Monetize, Manage, and Measure Information as an Asset for Competitive Advantage, Routledge, New York, NY, https://doi.org/10.4324/9781315108650.
[11] Local Government Denmark (2012), Good Basic Data for Everyone: A Driver for Growth and Efficiency, Local Government Denmark, https://en.digst.dk/media/18773/good-basic-data-for-everyone-a-driver-for-growth-and-efficiency.pdf.
[33] Lund, S. et al. (2013), Game Changers: Five Opportunities for US Growth and Renewal, McKinsey & Company, https://www.mckinsey.com/featured-insights/americas/us-game-changers (accessed on 14 February 2019).
[32] Manyika, J. et al. (2011), Big Data: The Next Frontier for Innovation, Competition, and Productivity, McKinsey & Company, https://www.mckinsey.com/business-functions/mckinsey-digital/our-insights/big-data-the-next-frontier-for-innovation (accessed on 14 February 2019).
[34] McAfee, A. and E. Brynjolfsson (2012), Big Data: The Management Revolution, https://hbr.org/2012/10/big-data-the-management-revolution.
[23] Meynhardt, T. (2009), “Public value inside: What is public value creation?”, International Journal of Public Administration, Vol. 32/3-4, pp. 192-219, https://doi.org/10.1080/01900690902732632.
[16] Moody, D. and P. Walsh (1999), Measuring the Value of Information: An Asset Valuation Approach, European Conference on Information Systems, http://si.deis.unical.it/zumpano/2004-2005/PSI/lezione2/ValueOfInformation.pdf.
[22] Moore, M. (1997), Creating Public Value: Strategic Management in Government, Harvard University Press.
[62] Morabito, V. (2015), Big Data and Analytics, Springer International Publishing, Cham, https://doi.org/10.1007/978-3-319-10665-6.
[15] Nuffield Foundation (2019), Valuing Data: Foundations for Data Policy, Nuffield Foundation, London, https://www.nuffieldfoundation.org/valuing-data-foundations-data-policy (accessed on 10 July 2019).
[55] OECD (2019), Digital Government Review of Argentina: Accelerating the Digitalisation of the Public Sector, OECD Publishing, Paris, https://doi.org/10.1787/24131962.
[19] OECD (2019), Digital Government Review of Sweden: Towards a Data-driven Public Sector, OECD Publishing, Paris, https://doi.org/doi.org/10.1787/24131962.
[60] OECD (2019), Digital Government Review of Sweden: Towards a Data-driven Public Sector, OECD Publishing, Paris, https://doi.org/10.1787/4daf932b-en.
[26] OECD (2018), Open Government Data Report: Enhancing Policy Maturity for Sustainable Impact, OECD Digital Government Studies, OECD Publishing, Paris, https://dx.doi.org/10.1787/9789264305847-en.
[65] OECD (2017), Fostering Innovation in the Public Sector, OECD Publishing, Paris, https://dx.doi.org/10.1787/9789264270879-en.
[27] OECD (2017), Government at a Glance 2017, OECD Publishing, Paris, https://dx.doi.org/10.1787/gov_glance-2017-en.
[38] OECD (2017), How’s Life? 2017: Measuring Well-being, OECD Publishing, Paris, https://dx.doi.org/10.1787/how_life-2017-en.
[59] OECD (2017), Recommendation of the Council on Open Government, OECD, Paris, https://legalinstruments.oecd.org/en/instruments/OECD-LEGAL-0438.
[58] OECD (2017), Survey on the Organisation and Functions of the Centre of Government, OECD, Paris.
[45] OECD (2016), Open Government Data Review of Mexico: Data Reuse for Public Sector Impact and Innovation, OECD Publishing, Paris, https://doi.org/10.1787/24131962.
[66] OECD (2016), “The Internet of Things: Seizing the benefits and addressing the challenges”, OECD Digital Economy Papers, No. 252, OECD Publishing, Paris, https://doi.org/10.1787/5jlwvzz8td0n-en.
[5] OECD (2015), Data-Driven Innovation: Big Data for Growth and Well-Being, OECD Publishing, Paris, https://dx.doi.org/10.1787/9789264229358-en.
[52] OECD (2015), OECD Public Governance Reviews: Estonia and Finland: Fostering Strategic Capacity across Governments and Digital Services across Borders, OECD Public Governance Reviews, OECD Publishing, Paris, https://dx.doi.org/10.1787/9789264229334-en.
[67] OECD (2015), OECD Recommendation of the Council on Public Procurement, OECD, Paris, http://www.oecd.org/gov/public-procurement/recommendation.
[42] OECD (2015), Rebooting Public Service Delivery: How Can Open Government Data Help to Drive Innovation?, OECD, Paris, http://www.oecd.org/gov/Rebooting-Public-Service-Delivery-How-can-Open-Government-Data-help-to-drive-Innovation.pdf.
[68] OECD (2014), Recommendation of the Council on Digital Government Strategies, OECD, Paris, https://legalinstruments.oecd.org/en/instruments/OECD-LEGAL-0406.
[63] OECD (2014), Recommendation of the Council on the Governance of Critical Risks, OECD, Paris, https://legalinstruments.oecd.org/en/instruments/OECD-LEGAL-0405.
[10] OECD (2010), Denmark: Efficient e-Government for Smarter Public Service Delivery, OECD e-Government Studies, OECD Publishing, Paris, https://dx.doi.org/10.1787/9789264087118-en.
[44] OECD (forthcoming), Standards of Evaluation: A Review of International Perspectives, OECD, Paris, forthcoming.
[20] OECD Observatory of Public Sector Innovation (2019), “Hello, world: Artificial intelligence and its use in the public sector”, draft, OECD Observatory of Public Sector Innovation, Paris, https://oecd-opsi.org/projects/ai.
[49] OECD/Bloomberg (2019), Enhancing Innovation Capacity in Cities, OECD Publishing, Paris.
[30] Pollock, R. (2010), Welfare Gains from Opening Up Public Sector Information in the UK, University of Cambridge, http://www.rufuspollock.org/economics/papers.
[8] Presidência do Conselho de Ministros (2015), Resolution of the Council of Ministers No.42/2015, https://dre.pt/home/-/dre/67540636/details/maximized?p_auth=7PgkXEza.
[51] Ries, E. (2011), The Lean Startup: How Today’s Entrepreneurs Use Continuous Innovation to Create Radically Successful Businesses, Currency.
[24] Talbot, C. (2011), “Paradoxes and prospects of ‘public value’”, Public Money & Management, Vol. 31/1, pp. 27-34, https://doi.org/10.1080/09540962.2011.545544.
[4] Ubaldi, B. (2013), “Open government data: Towards empirical analysis of open government data initiatives”, OECD Working Papers on Public Governance, No. 22, OECD Publishing, Paris, https://dx.doi.org/10.1787/5k46bj4f03s7-en.
[21] Ubaldi, B. et al. (2019), “State of the art in the use of emerging technologies in the public sector”, OECD Working Papers on Public Governance, No. 31, OECD Publishing, Paris, https://doi.org/10.1787/932780bc-en.
[31] United States White House (2018), President’s Management Agenda, United States White House, https://www.whitehouse.gov/wp-content/uploads/2018/03/Presidents-Management-Agenda.pdf.
[1] US Department of Health & Human Services (2011), Improving Data for Decision Making: HHS Data Collection Strategies for a Transformed Health System, US Department for Health & Human Services, Washington, DC, https://aspe.hhs.gov/basic-report/improving-data-decision-making-hhs-data-collection-strategies-transformed-health-system.
[3] van Ooijen, C., B. Ubaldi and B. Welby (2019), “A data-driven public sector: Enabling the strategic use of data for productive, inclusive and trustworthy governance”, OECD Working Papers on Public Governance, No. 33, OECD Publishing, Paris, https://doi.org/10.1787/09ab162c-en.
[6] Welby, B. (2019), “The impact of digital government on citizen well-being”, OECD Working Papers on Public Governance, No. 32, OECD Publishing, Paris, https://doi.org/10.1787/24bac82f-en.
Notes
← 1. https://arkitektur.digst.dk/metoder/regler-begrebs-og-datamodellering.
← 2. https://oecd-opsi.org/search-toolkits/?_sft_discipline-or-practice=futures-and-foresight.
← 3. https://www.sns.gov.pt/transparencia.
← 4. https://partilha.justica.gov.pt.
This document, as well as any data and map included herein, are without prejudice to the status of or sovereignty over any territory, to the delimitation of international frontiers and boundaries and to the name of any territory, city or area. Extracts from publications may be subject to additional disclaimers, which are set out in the complete version of the publication, available at the link provided.
https://doi.org/10.1787/059814a7-en
© OECD 2019
The use of this work, whether digital or print, is governed by the Terms and Conditions to be found at http://www.oecd.org/termsandconditions.