
3. Cereals
This chapter describes recent market developments and highlights medium-term projections for world cereal markets for the period 2021-30. Price, production, consumption and trade developments for maize, rice, wheat and other coarse grains are discussed. The chapter concludes with a discussion of important risks and uncertainties that might affect world cereal markets over the next ten marketing years.
Cereal markets in the 2020/2021 marketing year were more dynamic than in previous years. While global stocks were high at the beginning of the season, lower harvests in some major producing countries combined with logistical bottlenecks, temporary export restrictions, and a substantial increase in feed grain demand by the People’s Republic of China (hereafter “China”) as its pork sector recovers from the outbreak of African Swine Fever (ASF), pushed cereal prices to levels not witnessed since 2013. The OECD-FAO Agricultural Outlook assumes this boost, largely driven by maize, will be a short-term phenomenon and that global supply and trade will return to past trends as of 2022.
Over the next ten years, a higher share of global cereal production will originate from yield growth as area expansion is expected to become more limited. Yield improvements are assumed to result from several factors: improved and more widely accessible seed varieties; efficiency gains in the use of inputs; and better agricultural practices. However, certain factors such as increased environmental concerns, limited access to new technologies, and a lack of investment could constrain output growth. Globally, average cereal yield growth is projected to be about 1% p.a.
Over the next decade, cereal production is expected to increase by 336 Mt, reflecting gains made primarily in major grain-producing countries. More than 50% of the global production increase in wheat will come from India, the Russian Federation (hereafter “Russia”), and Ukraine. For maize, the United States, China, and Brazil will account for more than half of the expected production increase. For other coarse grains (barley, oats, rye, sorghum, millets, and other cereals), Russia, Ukraine, Ethiopia, and India are the key producers expected to increase production, while India, China, and Thailand are expected to be the main contributors to the global production increase in rice.
Over the medium term, cereal demand growth should be moderate compared to the previous decade for three reasons. First, growth in feed demand is projected to slow down; second, the increase in cereal demand for biofuels and other industrial uses is projected to level off over the coming decade; and third, direct human per capita consumption of most cereals has reached saturation levels in many countries. Nevertheless, population growth will increase global cereal food consumption in some regions; wheat and rice in particular are expected to remain important components of diets in Asia, while millet, sorghum and white maize will remain staple food commodities in Africa. Rice will play an increasingly important role in African diets.
Globally, about 17% of cereal production is traded internationally, with shares for single commodities ranging from 9% for rice to 25% for wheat. The share for total cereals is projected to increase to 18% by 2030, largely due to increased trade in rice. Rice will nevertheless remain a thinly traded commodity. In volume terms, net cereal surplus and deficits show a clear regional pattern (Figure 3.1). However, these patterns differ for single commodities. For example, Asian countries have a larger surplus in rice, and Latin America exports larger shares of maize but imports more wheat.
World cereal trade is projected to increase by 21% to reach 542 Mt by 2030. Russia surpassed the European Union in 2016 to become the largest wheat exporter and is expected to increase its lead throughout the outlook period, accounting for 22% of global exports by 2030. Concerning maize, the United States will remain the leading exporter, followed by Brazil, Ukraine, Argentina, and Russia. The European Union, Australia, and the Black Sea region are expected to continue to be the main exporters of other coarse grains. India, Viet Nam and Thailand will continue to lead global rice trade, but Cambodia and Myanmar are expected to play an increasingly important role in global rice exports, whilst exports by China will remain above the levels observed between 2010 and 2016.
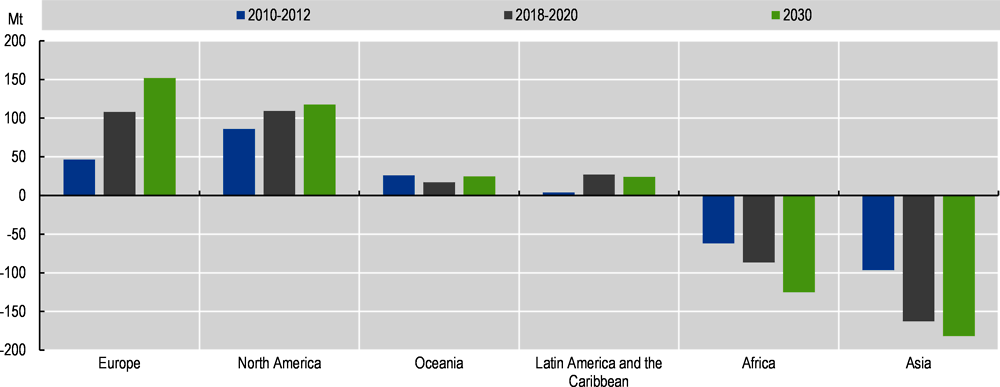
Note: Europe includes the Russia, Ukraine and Kazakhstan
Source: OECD/FAO (2021), ''OECD-FAO Agricultural Outlook OECD Agriculture statistics (database)'', https://doi.org/10.1787/agr-outl-data-en.
Under the current Outlook assumptions, all cereal prices are expected to decrease from current levels for the next two marketing years. Thereafter, they will resume their long-term trend, a decrease in real terms, over the outlook period. The responsiveness of cereal prices to recent trade disruptions, animal diseases, production variability, and economic crises has shown their potential for volatility and countries are preparing various strategies to prepare for future disruptions. For example, some are building stocks or regulating exports, which could alter the trajectory of prices over the next two years. China’s feed demand will remain an important element for future cereal markets. While this Outlook assumes maize imports to return to levels defined by the tariff rate quota (TRQ) over the outlook period, any change in this assumption would shift grain markets. Grain prices could also become more volatile given the increasing participation in global grain markets of the Black Sea region, where production tends to be more volatile.
Over the past seven years cereal prices have been relatively stable, but they increased significantly in 2020/2021. The impact of the COVID-19 pandemic, however, on cereal markets was relatively modest, as the few cases of restrictions placed on labour or the slowdown in transportation were outweighed by a generally resilient supply chain and an upswing of direct human consumption of staples.
Grain prices increased sharply towards the end of the 2020 calendar year and continued to rise during the marketing season. The main driver of this increase was the large maize import volumes by China which could reach record levels in 2020/2021 for several reasons: the gradual rebuilding of pig herds following the outbreak of ASF, improved trade relations with the United States, and stagnant domestic maize production.
This price increase was further accentuated as global production did not increase as much as in previous years. Wheat production in the European Union was, for example, the lowest in ten years and decreased in Argentina for the first time in five years.
The surge in grain prices contributed to higher food price inflation in many countries, especially those where the negative economic impacts of the pandemic were already more pronounced.
The world wheat price, as measured by the benchmark US wheat No. 2 Hard Red Winter (fob), was USD 245/t in 2020, the highest since 2014. Over the outlook period, wheat prices are projected to increase to USD 253/t by 2030 due to average harvest expectations and moderate growth in exports and food use.
The world maize price, as measured by the benchmark US maize No. 2 Yellow (fob), averaged USD 199/t in 2020, the highest level in six years; however prices are expected to revert back to trend over the next three years to USD 169/t by 2023. Over the medium term, declining stocks combined with strong global feed demand will support maize prices, reaching nearly USD 200/t by 2030 in nominal terms.
The average world market price for other coarse grains, as measured by the price for feed barley (fob. Rouen) was USD 214/t in 2020, slightly below the historical peak of 2018. By 2022, the world market price for other coarse grains should decrease to USD 197/t, thereafter recovering to reach USD 232/t by 2030. The medium term recovery is expected to be sustained by growing import demand, mainly from China.
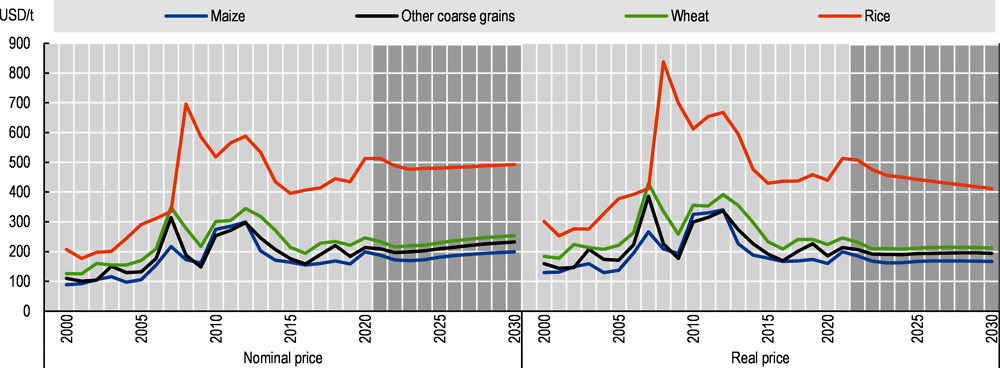
Note: Wheat: US wheat, No.2 Hard Red Winter, fob Gulf; maize: US Maize, No.2 Yellow, fob Gulf; other coarse grains: France, feed barley, fob Rouen; rice: Thailand, 2nd grade milled 100%, fob Bangkok. Real prices are nominal world prices deflated by the US GDP deflator (2020=1).
Source: OECD/FAO (2021), ''OECD-FAO Agricultural Outlook OECD Agriculture statistics (database)'', https://doi.org/10.1787/agr-outl-data-en.
The reference export price used for rice (milled, 100% B, fob Bangkok) in the 2020 calendar year was USD 512/t, the highest level since 2013. However, this upward trajectory could reverse and by 2023 the price could be USD 476/t. Over the medium term, growing demand from countries in Asia, Africa, and the Middle East will support an increase in nominal terms, although large supplies are expected to limit gains with prices at USD 492/t by 2030.
In real terms, prices for wheat, maize, other coarse grains and rice are expected to decline over the ten-year horizon.
The global area harvested to cereals is expected to grow by 14 Mha between the base period (2018-20) and 2030. Harvested area in developed countries is expected to increase by 4 Mha owing to gains in Russia, Ukraine, and Australia, and in developing countries by about 10 Mha, due mainly to gains in Asia and Latin America. Global wheat and maize areas are projected to increase by 3% and 4%, while other coarse grains and rice areas are expected to remain stagnant. Decreasing harvested areas of rice in China, Viet Nam and Brazil will be offset by gains in African and Asian countries. With land expansion limited by restricted land availability as compared to the previous decade, the result of constraints placed on converting forest or pasture into arable land, as well as ongoing urbanisation, increased global production is expected to be largely driven by intensification. Growth in yields, due to improving technology and cultivation practices in developing countries in particular, is expected to sustain future cereals production. Global yields are expected to grow between the base period and 2030 by about 9% for wheat and other coarse grains, 10% for maize, and 12% for rice.
Global wheat production is expected to increase by 87 Mt to 840 Mt by 2030, a moderate pace in relative terms compared to the last decade. Developed countries are set to increase their production by 47 Mt by 2030, and developing countries are expected to add 40 Mt to global output, thus increasing their share of global production (Figure 3.3). India, the world’s third largest wheat producer, is expected to provide the largest share of the additional wheat supply, increasing its wheat production by 18 Mt by 2030, driven by yield improvements and area expansion in response to national policies to improve self-sufficiency in wheat. There will be significant production increases in Russia (14.5 Mt), Ukraine (9.8 Mt), Australia (5.9 Mt), and Pakistan (5.1 Mt). In the Black Sea region, Russia, Ukraine, and Kazakhstan, additional areas planted with wheat will account for more than 60% of the global net area gains; although traditionally considered as a winter wheat production region, spring wheat is expected to also contribute to area expansion. As currently, China is projected to be the largest producer of wheat by 2030 (Figure 3.4)
Source: OECD/FAO (2021), ''OECD-FAO Agricultural Outlook OECD Agriculture statistics (database)'', https://doi.org/10.1787/agr-outl-data-en.
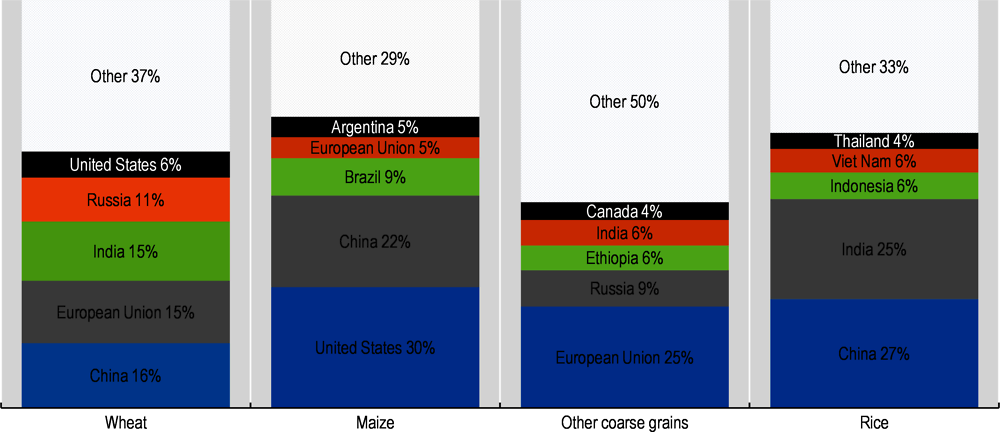
Note: Presented numbers refer to shares in world totals of the respective variable
Source: OECD/FAO (2021), ''OECD-FAO Agricultural Outlook OECD Agriculture statistics (database)'', https://doi.org/10.1787/agr-outl-data-en.
Global maize production is expected to grow by 160 Mt to 1.3 bln t over the next decade, with the largest increases in China (35 Mt), followed by the United States (32 Mt), Brazil (18 Mt), Ukraine (10 Mt), and Argentina (7 Mt). Increased production in Brazil will be driven by higher second-crop maize following the soybean harvest. Production growth in the United States is expected to slow to 0.6% p.a. over the next ten years, compared to 2% p.a. the previous decade, due to slower growth in domestic demand, particularly for ethanol. Slow production growth in the United States will be supported by higher yields as planted area is expected to decline because of area competition with soybeans. Production in Ukraine will continue to increase due to exceptional soil fertility conditions and increasing integration of maize into the crop rotation.
In Sub-Saharan Africa, total maize output is projected to increase by 22.5 Mt, of which white maize – a major staple crop in the region – will account for the largest share. Increases in maize production are expected to stem primarily from yield improvements.
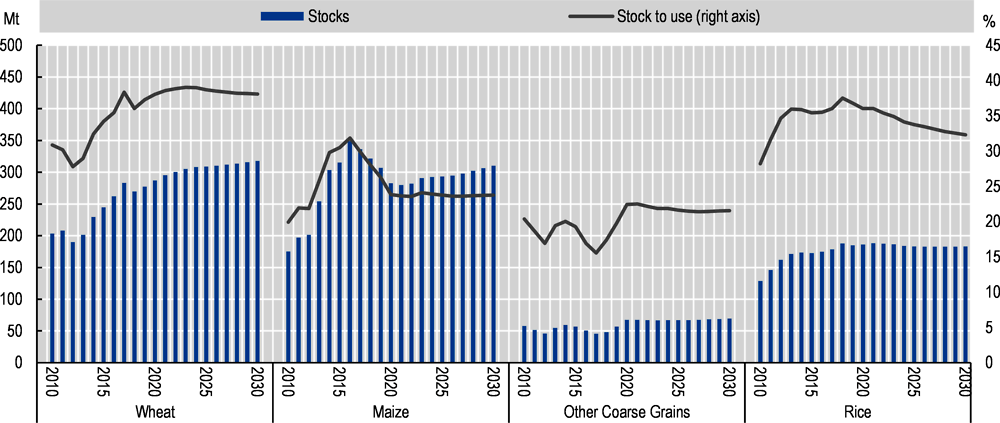
Maize production in China decreased between 2015 and 2018 due to policy changes in 2016 which reduced price supports in order to end stock piling; these were replaced with market-oriented purchasing combined with direct subsidies to farmers. Production also fell because of the release of accumulated stocks. In 2015, the stock-to-use ratio of maize was estimated at almost 80%, falling to about 47% in 2020, which is very close to the ratio estimated for the period 2007 to 2009 before stocks started to pile up. This Outlook assumes no significant further decrease in stock levels in the coming years, to reach a stock-to-use ratio of 44%. It is assumed that Chinese farmers will have adapted to the new policy in place and as such feed demand is projected to strengthen at 3% p.a. over the next ten years; maize production should therefore gain in competitiveness in the years to come. Indeed, China is projected to contribute the most (33%) to increases in global maize output, mainly by expected increases in yields and from increased cultivation of maize.
Source: OECD/FAO (2021), ''OECD-FAO Agricultural Outlook OECD Agriculture statistics (database)'', https://doi.org/10.1787/agr-outl-data-en.
Global production of other coarse grains – sorghum, barley, millets, rye, and oats ‒ is projected to reach 330 Mt by 2030, up 29 Mt from the base period. Developing countries will contribute the most, with 21 Mt from African countries. Africa has the fastest growing population and also relies on other coarse grains, such as millet and sorghum, mainly for food. Nearly half of the global production increase of other coarse grains is expected to come from African countries. Ethiopia will contribute the most, adding 6 Mt to reach 20 Mt by 2030. Output in most developed countries, however, will stagnate due to slower growth in feed demand and changes in feed composition in favour of maize as opposed to barley. In the United States, for example, production will remain stagnant over the outlook period. After historical harvests in 2020, other coarse grain production in the European Union is projected at 80 Mt in 2021 under normal weather expectations, and at 82 Mt by 2030 over the medium term. The Black Sea region will contribute one-fifth to the increase in global production, mainly via barley and oats, with higher production in Russia (+3.4 Mt) and Ukraine (+2 Mt).
Global rice production is expected to grow by 58 Mt to reach 567 Mt by 2030. While production in developed countries is projected to stagnate, production in developing countries, which account for the bulk of global rice output, is expected to be robust, increasing by nearly 59 Mt to 550 Mt by 2030. Asia contributes the majority of the additional global production, accounting for 52 Mt of the increase during the outlook period. The highest growth is expected in India (+20 Mt), followed by LDC Asian region (+13 Mt), China (+6 Mt), Viet Nam (+4.5 Mt), and Thailand (+2.5Mt). India will remain a major producer of Indica and basmati rice. Viet Nam is expected to increase production mainly through yield improvements, while harvested area is expected to decline, assuming government efforts to shift to alternative crops are effective. China, the world’s largest rice producer, is expected to increase production at a slower pace than during the last ten years. Area planted to rice in China is expected to decline despite government policies to maintain production through its minimum purchase price. Production in developed markets, such as Korea, Japan, and the European Union, is projected to fall slightly below the base period’s production level. Production in the United States and Australia will expand by about 0.8% and 2% p.a. respectively.
Global consumption of cereals is less concentrated than production. Nonetheless, between 48% and 65% of global consumption occurs in the top 5 consumer countries of each commodity (Figure 3.6). Global use of cereals is projected to increase from 2.7 bln t in the base period to 3 bln t by 2030, driven mainly by higher feed use (+163 Mt), followed by food use (+146 Mt). Developing countries will account for almost 90% of the projected demand increase. Absolute growth in food use (+140 Mt) in developing countries will also exceed growth in feed use (+124 Mt).
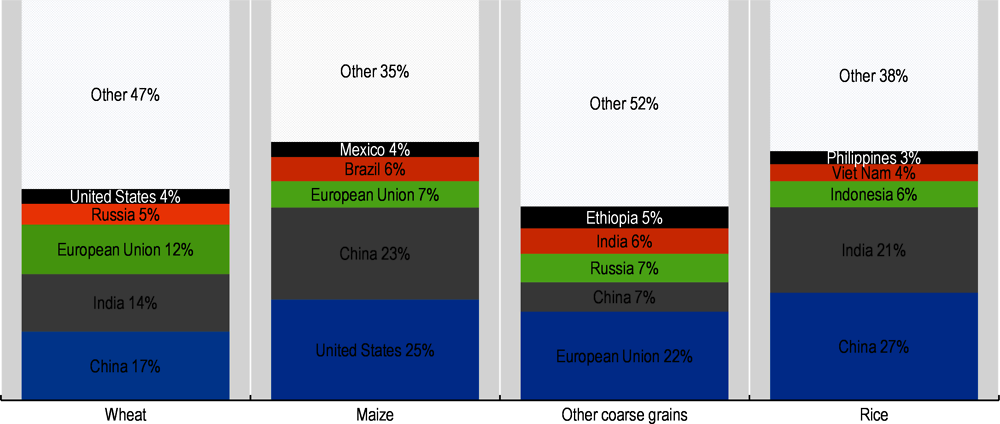
Note: Presented numbers refer to shares in world totals of the respective variable.
Source: OECD/FAO (2021), ''OECD-FAO Agricultural Outlook OECD Agriculture statistics (database)'', https://doi.org/10.1787/agr-outl-data-en.
Global feed consumption of cereals is expected to increase the most for maize (1.4% p.a.), and more modestly for wheat (1.1% p.a.) and other coarse grains (0.8% p.a.) over the next ten years. Per capita consumption of cereals for food is expected to increase at a slower rate compared to the previous decade.
Wheat consumption is expected to increase by 12% by 2030 compared to the base period. Four countries account for nearly half of this increase: India (+18 Mt), China (+15 Mt), Pakistan (+6 Mt), and Egypt (+4 Mt). Global use of wheat for food is projected to increase by 58 Mt but to remain stable at about 70% of total consumption; growth will be slower compared to the previous decade as the world population increases at a more moderate pace. Feed use is expected to increase by 22 Mt compared to the base period (Figure 3.7).
Globally, the projected increase in wheat for food use is more than three times larger than the increase in feed use. Food use is expected to expand especially in Asia where there is increasing demand for processed cereal-food products, such as pastries and noodles. These products call for higher quality and higher protein wheat, which is produced in the United States, Canada, Australia, to a lesser extent in the European Union, and potentially in Russia and Ukraine. Countries in the Middle East, such as Egypt, Algeria, and the Islamic Republic of Iran, will remain major consumers of wheat with high levels of per capita consumption. Global production of wheat-based ethanol is not expected to increase significantly as changing biofuel policies in the European Union – the major user of wheat in ethanol processing – have led to reduced support to first generation biofuels.
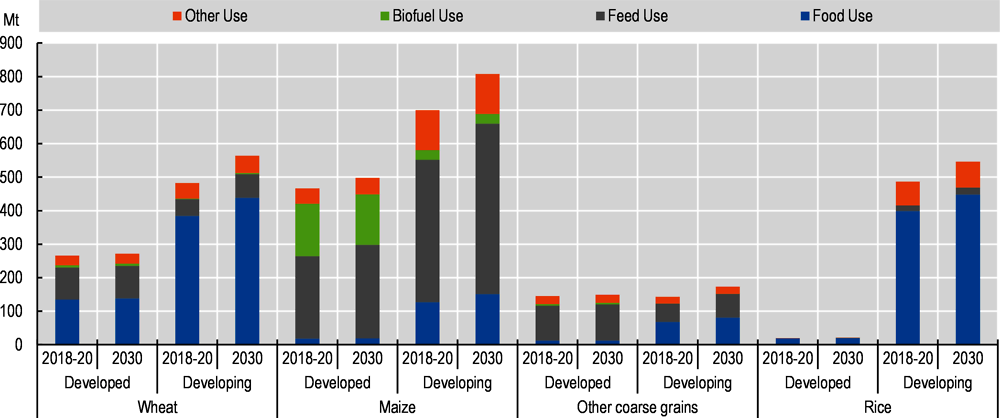
Source: OECD/FAO (2021), ''OECD-FAO Agricultural Outlook OECD Agriculture statistics (database)'', https://doi.org/10.1787/agr-outl-data-en.
Global maize consumption is projected to increase by 1.1% p.a. over the projection period, a slower pace compared to 3.2% p.a. in the previous decade. This increase is principally driven by higher incomes that translate into higher feed demand, which holds the largest share of total utilisation, rising from 58% in the base period to around 60% by 2030. Developing countries account for over three-quarters of the increase in feed consumption due to fast expanding livestock and poultry sectors. Feed demand is expected to rise by 116 Mt to 787 Mt, with the major countries accounting for the increase being the United States (+26 Mt), China (+24 Mt), Argentina (+6 Mt), Viet Nam (+5 Mt), India (+5 Mt), and Indonesia (+4 Mt). Production in South-East Asia in particular will increase due to its fast-expanding poultry industry.
The use of maize as food is expected to increase primarily in Sub-Saharan Africa where population growth is strong. Maize, white maize in particular, will remain an important staple, accounting for about a quarter of total caloric intake. Overall, growth in maize consumption as food is strongest in African countries amongst all developing countries at about 2.5% p.a.
Maize use for biofuel production more than doubled between 2007 and 2020. During the outlook period, however, biofuel consumption is expected to decrease by 0.5% annually as the international ethanol market is restrained by biofuel policies (Figure 3.7). Although maize-based ethanol use will increase in Brazil, bioethanol consumption will decrease given the decline in gasoline use in the United States.
World utilisation of other coarse grains is projected to increase by 35 Mt, or 0.8% p.a., over the next ten years, a faster pace than the 0.6% p.a. of the previous decade. This acceleration is driven by developing countries (+31 Mt) as consumption is expected to remain stable in developed countries. The food share of total consumption is projected to increase from about 28% in the base period to 29% by 2030 as a result of increased food demand in Africa (+10 Mt) and Asia (+2 Mt). Sub-Saharan African countries, Ethiopia in particular, rely heavily on millet as a source of calories.
Rice is primarily a foodstuff and continues to be a major food staple in Asia, Latin America and the Caribbean, and increasingly in Africa. World rice consumption is expected to increase by 0.9% p.a. over the next ten years, compared with 1.1% p.a. in the last decade. Asian countries account for 65% of the projected increase in global rice consumption, largely due to population increases rather than per capita gains (Table 3.1). On a per capita basis, food intake of rice is projected to make notable increases in Africa, with all other regions seeing smaller gains or losses. At the global level, the average per capita food use of rice is projected to maintain a similar level as in the base period at around 55 kg per year.
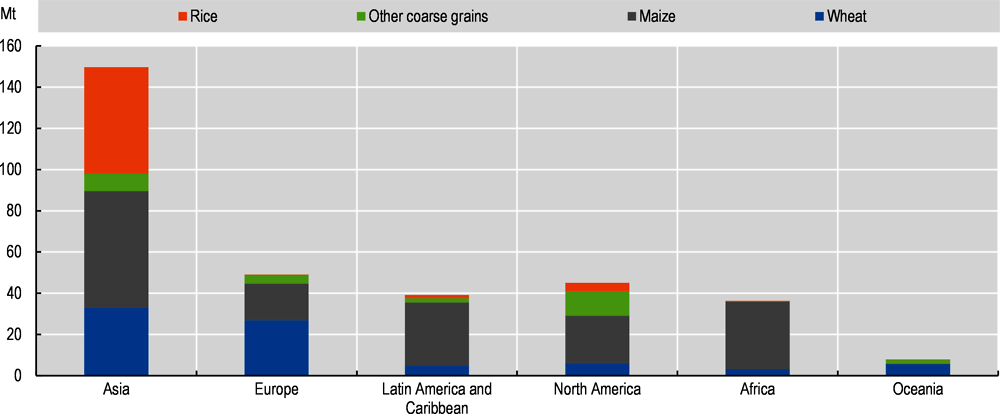
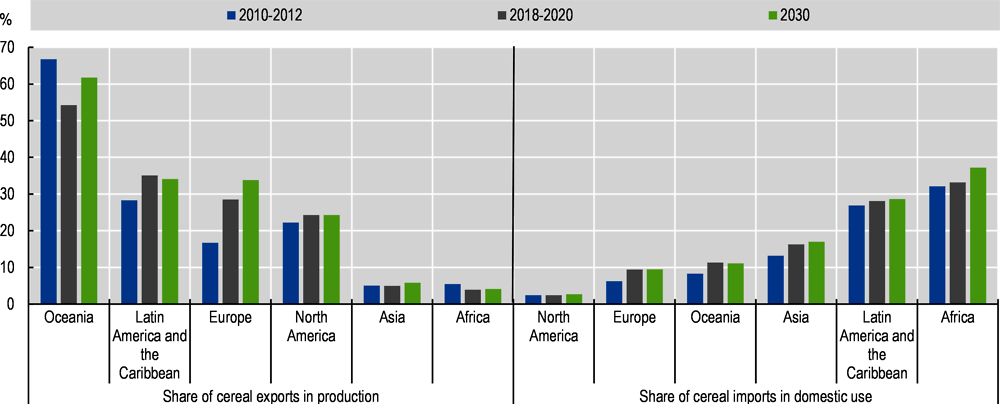
Trade in cereals presently accounts for about 17% of global consumption and is projected to reach 18% by 2030. It is an important source of food and feed for importing countries. Traditionally, the Americas and Europe supply cereal to Asia and Africa (Figure 3.1), where growing food demand from rising populations and higher feed demand from expanding livestock sectors means that demand will expand faster than domestic production. This situation is expected to continue over the next decade and exports of cereals should increase by 21% by 2030. Figure 3.8 illustrates how important cereal trade is relative to production and consumption. The absolute net trade of cereals shown in Figure 3.1 might be low for Latin America and the Caribbean and Oceania, but the share of cereal exports in domestic production is the highest among the regions. In Latin America and the Caribbean, cereal imports are as important as exports and will represent almost 30% of domestic consumption by 2030. Amongst all the continents, it is Africa where imports of cereals are the most important for domestic consumption and by 2030 almost 40% of domestic cereal use in Africa will originate from non-African countries.
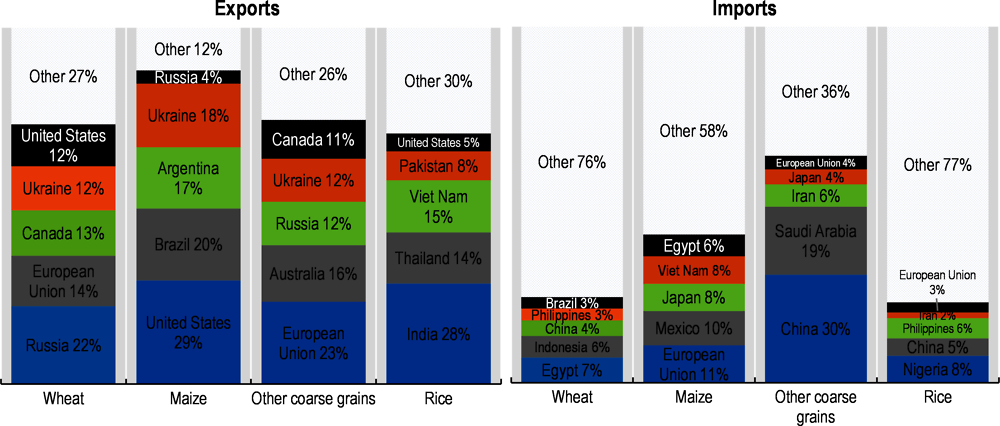
Wheat exports are expected to grow by 36 Mt to 220 Mt by 2030. Russia surpassed the European Union as the top exporter in 2016 and it is expected to maintain this position, accounting for 22% of global wheat exports by 2030. Production in the major wheat-producing countries of the Black Sea region – Russia, Kazakhstan and Ukraine – has been volatile over the past decade (Table 3.2) due mainly to yield fluctuations. Nonetheless, recent production growth has on average outpaced consumption growth, so further increases of wheat exports are expected.
By 2030, the European Union, the second largest wheat exporter, will account for 14% of global trade, although wheat exports are projected to stay below the record volumes of 2019. The third largest exporter is expected to be Canada, followed by Ukraine; both are projected to surpass US exports, traditionally the third largest exporter (Figure 3.9). Although the traditional wheat exporters ‒ the United States, Canada, and European Union ‒ may lose their overall export share, they are expected to retain the higher quality and higher protein wheat markets, particularly in Asia. Russia and Ukraine may play a role in these higher quality markets, but will be more competitive in other soft wheat markets, such as the Middle East and Central Asia, for reasons of proximity. Wheat imports by the North African and the Middle East regions will maintain a stable share of 28% of total trade over the next ten-year horizon.
Note: These estimates include intra-regional trade except for the European Union.
Source: OECD/FAO (2021), ''OECD-FAO Agricultural Outlook OECD Agriculture statistics (database)'', https://doi.org/10.1787/agr-outl-data-en.
Maize exports are expected to grow by 29 Mt to 207 Mt by 2030. The export share of the top five exporters – the United States, Brazil, Ukraine, Argentina, and Russia – accounts for almost 90% of total trade over the projection period. The United States is projected to remain the top maize exporter, although exports should remain below the base year peak and the corresponding export share will drop one percentage point to 29%. Stable export shares are expected for Brazil (20%) as production of second-crop maize following soybeans increases. Ukraine and Russia will increase their export market shares from 16% and 2% in the base period, to 18% and 4% in 2030 respectively. Shipments from Argentina, which used to be the third largest exporter, will grow slower than in other countries; Ukraine will take third position by 2030. The LDC Sub-Saharan African region will continue to play a major role supplying white maize for food consumption in the region. South Africa will remain a regional supplier, but expansion will be limited as they produce GMO varieties that face restrictions in neighbouring countries.
The top five maize importers during the base period – the European Union, Japan, Mexico, Viet Nam, and Korea – account for 41% of world imports during the outlook period and this share is expected to remain stable in the coming decade. However, Egypt is expected to surpass Korea and become the fifth largest importer of maize by 2030 (Figure 3.9).
The international trade volume of other coarse grains, dominated by barley and sorghum, is much smaller than for maize or wheat. Other coarse grain exports are expected to increase by 10 Mt to 53 Mt by 2030. The top five exporters – the European Union, Australia, Russia, Ukraine, and Canada – had an export share of 73% of global trade during the base period, and this share is expected to increase to 74% by 2030 as lower export growth in Canada will be offset by stronger growth in Australia, Russia, and Ukraine. In contrast to maize and wheat markets, imports of other coarse grains are much less widespread among countries. The five major importers – China, Saudi Arabia, Japan, the Islamic Republic of Iran, and the European Union – absorb almost 65% of global trade, with China accounting for 30% by 2030.
Note: Presented numbers refer to shares in world totals of the respective variable
Source: OECD/FAO (2021), ''OECD-FAO Agricultural Outlook OECD Agriculture statistics (database)'', https://doi.org/10.1787/agr-outl-data-en.
As mentioned above, it is assumed that maize production in China will increase more dynamically than in the past decade so that the net-feed deficit of 2020/2021 will decrease over the medium term. Maize imports are assumed to return to the TRQ level (7.25 Mt), while imports of sorghum and barley are projected to increase to 14 Mt.
During the past ten years, rice trade grew at 1.5% p.a. This expansion is expected to speed up to about 2.6% p.a., with overall export volumes rising by 16 Mt to reach 62 Mt by 2030. The export share of the top five major rice exporters – India, Thailand, Viet Nam, Pakistan, and the United States – is expected to fall from 74% to 70%. Ongoing changes in the varietal make up of production and the increased focus in cultivating higher quality strains will certainly help Viet Nam to reduce its dependence on China. Thailand is projected to continue playing an important export role, but is expected to face more competition.
The group of the five largest exporters will lose market shares to countries in the less developed countries (LDC) in Asia, particularly Cambodia and Myanmar, as these countries becomes more competitive internationally. Shipments from the LDC Asia region will more than double from 4 Mt in the base period to 10 Mt by 2030, amid expectations that large exportable supplies will allow these countries to capture a greater share of Asian and African markets. Historically, Indica rice has accounted for the bulk of rice traded internationally; however, demand for other varieties is expected to continue to grow over the next ten years.
Imports by China, the largest importer of rice during the base period, are expected to grow by 1% p.a. Larger import growth will occur in African countries where demand growth is expected to outpace production growth. Nigeria is projected to become the largest importer of rice, increasing imports by 3 Mt, with imports accounting for 50% of domestic consumption by 2030. Overall, imports by African countries are expected to increase from 16 Mt in the base period to 33 Mt by 2030, increasing Africa’s share of world imports from 36% to 50%. In addition to China and Nigeria, the group of five major importers in 2030 will include the Philippines, the Islamic Republic of Iran, and the European Union. This group is expected to account for 22% of global rice imports by 2030, compared to 23% in the base period.
While normal assumptions for weather lead to positive production prospects for the main grain-producing regions, extreme weather events accentuated by climate change may cause higher volatility in cereal yields, thereby affecting global supplies and prices. Wheat and maize yields are particularly volatile in some large exporting countries such as Russia, Ukraine, Brazil, and Argentina, compared to Canada, the United States, and the European Union (Table 3.2).
The increasing participation in global markets of regions – such as the Black Sea region ‒ with larger yield fluctuations increases the probability of crop shortages due to harvest failures or of surpluses due to bumper crops. These factors could contribute to greater volatility in grain prices.
The macroeconomic environment is another source of uncertainty. Cereal prices could be affected by a potential slowdown in economic growth due to a decrease in investment, in particular in fast-growing economies. Global cereals markets remain uncertain due to inflationary pressure and real exchange rate movements, especially in exporting countries, which could stimulate or discourage production. Moreover, energy prices could directly affect input prices, e.g. fertilizers and agrochemicals.
The policy environment will be important. The reinforcement of food security and the focus on increased sustainability in coming reforms (e.g. in the European Union) as well as the design of biofuel policies (in the European Union, Brazil, and the United States) will impact the demand for cereals. China’s domestic policies, which influence their import demand for feed, are also crucial for future developments in the cereal markets. Trade restrictions could provoke market reactions and changes in trade flows that are not reflected in the current projections. Russia, for example, has applied export taxes to grains in the past and planned to implement a new floating permanent tax in 2021 in order to avoid strong domestic food price inflation. However, when the Outlook was prepared, this policy was not yet official but its implementation would impact international grain – notably wheat – trade.
Crop pests, crop diseases, and animal diseases remain factors that could disrupt cereal supply and demand. On the supply side, this is relevant in regions with limited resources to mitigate the impacts of such events. Examples are the recent locust and fall army worm outbreaks, which have undermined food security in the affected regions. Animal diseases could affect feed demand negatively, as seen recently with the effects of the ASF outbreak on South East Asia.
Indica and Japonica are the two major types of rice traded on the global market. Despite their different market structures in terms of production zones, consumer preferences and policies, most agricultural models do not distinguish between the two varieties. This study projects future global Indica and Japonica rice markets over the medium and long term. To incorporate the impact of climate change, a new partial equilibrium model, the Rice Economy Climate Change (RECC), was developed. This model covers Indica and Japonica rice markets in 24 countries and regions (Thailand, Viet Nam, Indonesia, Malaysia, the Philippines, Cambodia, Lao PDR, Myanmar, China, Japan, Korea, India, United States, European Union including United Kingdom, Bangladesh, Sri Lanka, Nepal, Pakistan, Brazil, Côte d'Ivoire, Egypt, Madagascar, Nigeria, and the rest of the world), as well as the global rice market.
The results of the baseline projections and scenario simulations of the RECC model show that climate change is expected to impact Indica and Japonica production.1 More specifically, the international Japonica rice price is projected to be more volatile than for Indica rice. The model also examined how future agricultural investments would impact world Indica and Japonica rice markets, including the stability of their prices on the international market, based on scenarios of future climate change over the mid- to long-term. The baseline is compared with six scenarios, which assume zero growth in a specific type of agricultural investments (agricultural knowledge and innovation system, or development and maintenance of infrastructure) in individual countries (Viet Nam, the Philippines, and China). Investment in agricultural knowledge and innovation system in Viet Nam (Scenario 1) and China (Scenario 5) will play a significant role in stabilising international Indica and Japonica rice prices, respectively, in the mid- to long-term, as rice production is increasingly affected by climate change (Table 3.3).