
ODA as a collective effort: latest trends
Since the OECD first began collecting aid statistics from 17 countries in 1961, the international landscape has changed dramatically, including how development co-operation efforts are measured. Today, the OECD is recognised as a global hub for development finance statistics, collecting data from 121 providers in 2020 (including official providers, private philanthropic providers and multilateral organisations). This chapter examines latest trends on the volume and allocation of official development finance, especially flows that qualify as official development assistance (ODA), around the world. It includes flows from members of the OECD Development Assistance Committee (DAC) and from all the largest providers of development co-operation beyond the DAC membership, OECD key partners and accession countries. It highlights the performance of individual providers and where they choose to concentrate their development co-operation efforts – whether this be through bilateral, multilateral or other delivery channels – as well as some of the most significant geographic and thematic variations in allocations over recent years.
Of the total 58 official providers analysed in this chapter, 29 are members of the OECD DAC and report their efforts according to the DAC directives on ODA.1 In addition, 19 providers, beyond the membership of the DAC (hereafter referred to as “other official providers”) also report their ODA flows at varying levels of detail.2 A further ten development co-operation providers do not report development finance statistics to the DAC, but are consulted in the process of compiling estimate data on their assistance.3 Within these providers beyond the DAC, many participate directly in the work of the DAC and its subsidiary bodies as participants or invitees, while others are involved in knowledge and data exchange, and other forms of co-operation, including through triangular partnerships.4 For the purposes of this analysis, it should be noted that total ODA data to describe headline/global trends is based on combined data from both DAC countries and other official providers that report to the OECD, followed by an explanation of what this means for DAC countries and other official providers respectively.
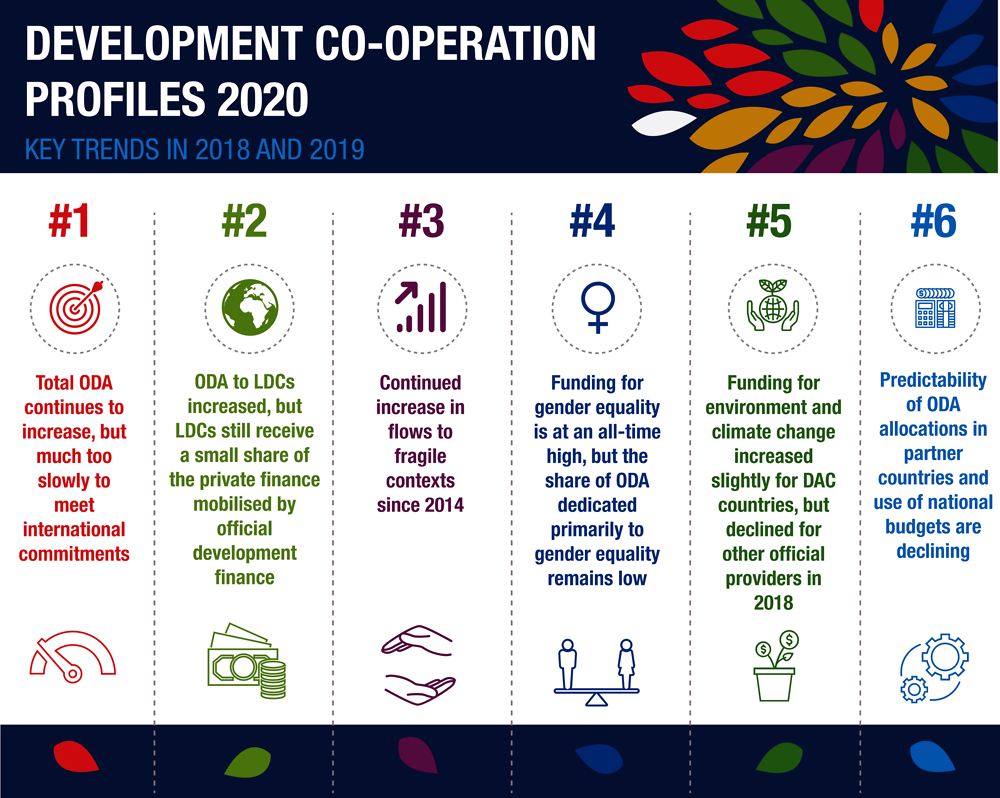
Total ODA continues to increase, but much too slowly to meet international commitments
Preliminary data for 2019 show a total ODA of USD 169.2 billion from DAC countries and other official providers.5 DAC countries’ total ODA on a grant-equivalent basis increased by 1.4% in real terms compared to the previous year, to reach USD 152.8 billion, equivalent to 0.3% of gross national income (GNI) (ODA was stable on a flow basis).6 Within DAC countries’ gross ODA portfolio in 2019, 87% was provided in the form of grants and 13% in the form of non-grants.7 While Denmark, Luxembourg, Norway, Sweden, and the United Kingdom contribute at least 0.7% of GNI as ODA, current levels of ODA by DAC countries do not match the collective ambition of 0.7% ODA to GNI reiterated in the 2030 Agenda for Sustainable Development or the international commitments set out in the Addis Ababa Action Agenda. Had DAC countries met this target in 2019, they would have provided USD 354.3 billion in ODA – USD 201.5 billion more than was provided. Given the particular role that ODA plays in addressing humanitarian needs, promoting peace and stability, building healthy, productive populations and sowing the seeds of global markets of the future, the case for sustained increases in ODA remains strong (OECD, n.d.[1]).
Of the other official providers that report to the DAC, 12 reported USD 16.45 billion of ODA in 2019. This trend was led by the three largest providers that report to the DAC: Saudi Arabia, Turkey, and the United Arab Emirates, which together provided USD 15.3 billion in ODA. There was an 8% decrease from 2018 due to a fall in bilateral loans from the United Arab Emirates to developing countries. Within other official providers’ gross ODA portfolio in 2018, 84% was provided in the form of grants and 16% in the form of non-grants. Turkey contributed the equivalent of 1.15% of its GNI as ODA. According to OECD estimates, contributions of other major providers of development co-operation not reporting their efforts to the OECD are on the rise. Overall, these contributions have increased by 17% over the last five years, reaching USD 7.2 billion in 2018. See the methodological notes for details on definitions and statistical methodologies applied.
ODA to LDCs increased, but LDCs still receive a small share of the private finance mobilised by official development finance
Net bilateral ODA from DAC countries to the group of least developed countries (LDCs) rebounded in 2019, after a drop in 2018, to reach USD 32.8 billion or 20.3% of gross bilateral ODA (preliminary data), representing an increase of 2.6% in real terms. Yet, total ODA (bilateral plus imputed multilateral ODA) to LDCs as a share of GNI has not changed since 2017, remaining at 0.09% of GNI – well below the ODA commitment of 0.15-0.20% of GNI reiterated in the 2030 Agenda for Sustainable Development, Addis Ababa Action Agenda, and the Istanbul Programme of Action. In 2018, five DAC countries (Denmark, Luxembourg, Norway, Sweden, and the United Kingdom) provided at least 0.20% of GNI as ODA to LDCs, in line with their commitments. In spite of the specific need for ODA in LDCs, the overall proportion of ODA targeting LDCs has declined over the past ten years, so the upward shift in 2018-19 is very welcome.
In 2018, other official providers supported LDCs to the tune of 34.4% of gross bilateral ODA (USD 7.2 billion), and increased the share of GNI provided as ODA to LDCs to 0.13% GNI in 2018 on average, with the United Arab Emirates providing 0.67% of GNI as ODA to LDCs.
Several factors leave LDCs with few external financing alternatives to ODA – they received only 4% of other official flows in 2017, and global investment and weak economic performance make it challenging for LDCs to raise finance through other means (UNCTAD, 2019[2]).
Furthermore, only 13% of finance mobilised by DAC countries from the private sector in 2017-18, which was channelled to specific countries, targeted LDCs, while 85% targeted middle-income countries. Eight DAC countries (Finland, Ireland, Korea, Luxembourg, Norway, Portugal, the Slovak Republic, and Sweden) bucked the trend by finding ways to manage higher risk thresholds and use other incentives to mobilise over one-third of this finance from the private sector for LDCs. Transparency on these activities is also key to build private investors’ confidence and stimulate the mobilisation effect of development finance interventions in countries most in need.
Continued increase in flows to fragile contexts since 2014
Support to fragile contexts, which include 58 countries and territories, accounted for 35.2% of DAC countries’ gross bilateral ODA (USD 42.1 billion) and 76.5% of other official providers’ gross bilateral ODA (USD 16.1 billion) in 2018, while support from multilateral organisations accounted for an additional USD 30.6 billion. The 15 extremely fragile countries received 41.4% of DAC countries’ total amount to fragile contexts, and 82.7% of other official providers’ total allocations to fragile contexts due, mainly, to a significant increase in humanitarian aid. The Syrian Arab Republic (Syria), Yemen, Ethiopia, Afghanistan, and Nigeria were the top recipients in 2018, together accounting for 37% of the total support to fragile contexts from DAC countries and other official providers. In contrast, Equatorial Guinea, Eritrea, Comoros, Kingdom of Eswatini, and the Democratic People’s Republic of Korea together received the least support to fragile contexts, consisting of 0.5% of total support. Learn more about support to fragile contexts on the States of Fragility platform.
The continued shift of support towards fragile contexts is positive in many ways, with more providers willing and able to engage in the most challenging contexts. The 2019 DAC Recommendation on the Humanitarian-Development-Peace nexus is already building momentum among providers and examples of good practice are emerging: OECD-DAC peer reviews capture efforts by many providers to adapt programme design and instruments, re-calibrate their risk appetites and ensure that their systems, processes, and people work together effectively and efficiently in crisis contexts.
Funding for gender equality is at an all-time high, but the share of ODA dedicated primarily to gender equality remains low
In 2018, DAC countries committed 42.1% of bilateral allocable aid (USD 53.1 billion) to gender equality and women’s empowerment as either a principal (dedicated) or significant objective (integrated/mainstreamed), up from 36.2% in 2017.8 However, only 4% of commitments had gender equality as a principal objective, with no increase in recent years. Australia, Canada, Spain and Sweden supported gender equality and women’s empowerment as a principal objective more than any other provider.
In 2018, other official providers committed 17.1% of bilateral allocable aid (USD 225 million) to gender equality and women’s empowerment as either a principal or significant objective (up from 14.8% in 2017). Only 1% of bilateral allocable aid was committed to gender equality and women’s empowerment as a principal objective. The United Arab Emirates provided the highest volume and share among other official providers.
The 2030 Agenda aims for a world in which every woman and girl enjoys full gender equality and all legal, social and economic barriers to their empowerment have been removed. There is compelling evidence that doing so will accelerate progress on all the Sustainable Development Goals (SDGs). Putting finance to work for gender equality and women's empowerment (OECD, 2020[3]) highlights clear potential to invest more ODA in gender equality and women’s empowerment and identifies broader opportunities for other sources of finance to support gender equality, proposing draft principles to guide future efforts. Learn more about ODA focused on gender equality, the DAC Network on Gender Equality, and the DAC recommendation on ending sexual exploitation, abuse, and harassment in development and humanitarian assistance.
Funding for environment and climate change increased slightly for DAC countries, but declined for other official providers in 2018
In 2018, DAC countries slightly increased ODA in support of the environment and climate change. They committed 33% of their bilateral allocable aid (USD 34.2 billion) in support of the environment as either a principal or significant objective (stable compared to 2017), while 11% focused on environmental issues as a principal objective only. Twenty-six per cent of bilateral allocable ODA (USD 27.5 billion) focused on climate change as either a principal or significant objective, a small increase from 25% in 2017. DAC countries had a greater focus on mitigation (20% in 2018) than adaptation (12%).
In 2018, other official providers’ support for the environment decreased. They committed 2% of their bilateral allocable aid (USD 23 million) in support of the environment as either a principal or significant objective, down from 11% in 2017. Two per cent of their bilateral allocable aid (USD 20.3 million) focused on climate change as either a principal or significant objective, also down from 11% in 2017, and almost exclusively on mitigation. Learn more about climate-related development finance.
The impact of environmental degradation and climate change is felt most acutely in developing countries and within those countries, among the poorest and most vulnerable people. In spite of much public engagement and high level political commitments, these data confirm that a relatively low proportion of ODA programmes take this into account. The Only Way Forward (OECD, 2019[4]) calls for a structured approach for development co-operation to rise to the challenge of aligning to international climate agreements while Greening Development Co-operation (OECD, 2019[5]) pulls together good practice from DAC members on how environmental considerations can be systematically integrated into policies, systems and programmes, including through "green" triangular co-operation (OECD, 2019[6]).
Data analysis for the OECD initiative Sustainable Oceans for All shows that DAC countries committed USD 1.4 billion in support of the conservation and sustainable use of the ocean in 2018, amounting to 1.1% of their bilateral allocable aid. Learn more about ODA focused on the ocean economy.
Predictability of ODA allocations in partner countries and use of national budgets are declining
Even before the uncertainty around the economic implications of the current COVID-19 pandemic, partner country governments had forward visibility and could start medium-term planning on only 65% of development co-operation funding they expected to receive from DAC members three years ahead (in 2021), compared to 69% in the 2016 monitoring round. Reduced visibility on future flows has a negative impact on partnerships, trust, and medium-term planning, particularly in the most aid-dependent partner countries. The share of DAC members’ funding recorded in partner countries’ national budgets also continued to decline, which can serve to undermine the normal accountability function of legislative bodies in holding governments and their partners accountable. Taking the time to establish longer-term partnerships can go a long way in improving the use of country systems and providing more certainty around future development finance levels (OECD/UNDP, 2019[7]). Read more in the 2019 Progress Report of the Global Partnership.
Collective performance against international commitments |
|---|
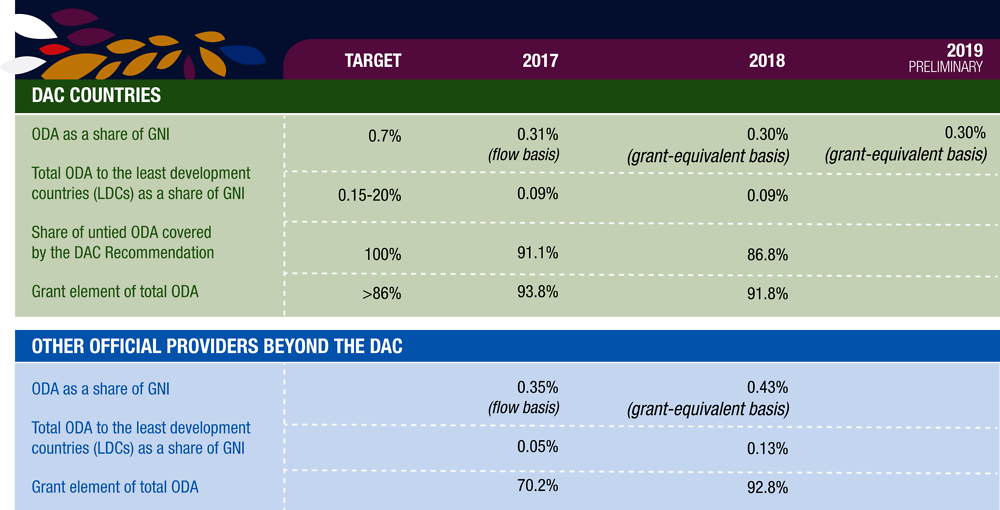 |
Note: See the methodological notes for further details on untying ODA and the grant element of ODA. |
Most ODA goes through the bilateral channel
In 2018, most ODA was provided bilaterally. Together, DAC countries disbursed 73% of total ODA bilaterally, of which 20% was channelled through multilateral organisations (earmarked contributions). Core multilateral contributions represented 27% of total ODA. Eighteen countries provided a higher share of bilateral ODA, whereas 11 countries (all EU member states) provided a higher share of multilateral ODA.
In terms of volume, other official providers disbursed 95% of total ODA bilaterally and 5% of ODA multilaterally; however, eleven other official providers (over half of those that report to the DAC, and including five EU member states) provided over half of their development finance as multilateral ODA.
A closer look at multilateral allocations
In 2018, total collective support (core and earmarked contributions) to multilateral organisations increased 3.0% to USD 71.9 billion. DAC countries provided USD 69.2 billion of gross ODA to the multilateral system (USD 45.2 billion as core multilateral ODA and the rest as earmarked contributions for a specific country, region, theme or purpose), an increase of 2.4% in real terms from 2017. Other official providers provided USD 2.7 billion of gross ODA to the multilateral system (USD 1.2 billion as core multilateral ODA and the rest as earmarked contributions), an increase of 20.1% in real terms from 2017.
Of DAC countries’ non-core contributions, 73% was softly earmarked for pooled funds and specific-purpose programmes and funds while the remaining 27% was more tightly earmarked to specific projects. Non-core contributions of other official providers supported pooled funds and specific programmes and funds.
In 2018, the highest share of multilateral contributions went to United Nations (UN) organisations, followed by EU institutions, and the World Bank Group. For 15 DAC countries and 8 other official providers – all members of the European Union (EU) – the largest share of multilateral spend was allocated to EU institutions, but this was not the case for 5 EU DAC countries. The UN system as a whole received 35% of total multilateral contributions (USD 25.2 billion), primarily via earmarked contributions. The World Bank Group was the third most important beneficiary of multilateral spend for DAC countries, whereas regional development banks were the third largest group of multilateral beneficiaries for other official providers. Learn more about multilateral development finance.
A closer look at bilateral allocations
In 2018, the total volume of DAC countries’ bilateral ODA decreased by 3.7% from 2017. Together, DAC countries provided USD 119.6 billion as gross bilateral ODA (including earmarked contributions to multilateral organisations). Looking at individual trends, 15 out of 29 DAC countries increased their bilateral ODA in 2018. The volume of in-donor refugee costs decreased significantly in DAC countries (-27.4% in real terms from 2017), representing 7.2% of their total net ODA in 2018.
Other official providers significantly increased bilateral spending (28.9% in real terms) between 2017 and 2018. They disbursed USD 21.0 billion as gross bilateral ODA (including earmarked contributions to multilateral organisations). Turkey and Malta were the main contributors to an increase of in-donor refugee costs for other official providers (+40.6% in real terms from 2017), although this represented only 0.2% of their aggregate total net ODA.
In 2018, DAC countries channelled bilateral ODA mainly through the public sector (50%), multilateral organisations as earmarked funding (20%) and non-governmental organisations (NGOs) (15%), while other official providers channelled 88% of bilateral ODA through the public sector.
Between 2017 and 2018, core and earmarked contributions to civil society organisations (CSOs) as a share of bilateral ODA remained stable for DAC countries and increased from 1.6% to 4.7% for other official providers. In 2018, DAC countries provided USD 18.4 billion of gross bilateral ODA to CSOs, one third of which came from the United States. Spain and Ireland channelled the highest shares of bilateral ODA through CSOs and Ireland also provided the highest share of core contributions to CSOs, followed by Belgium. The United Arab Emirates provided over 90% of other official providers’ gross allocations to CSOs in 2018 (USD 986 million in total), almost entirely channelled as earmarked funding (i.e. to implement projects initiated by the provider). Developing country-based CSOs continued to receive the lowest share of support among all categories of CSOs (5.3% in 2017-18). Recognising the importance of CSOs for development, the study DAC Members and Civil Society (OECD, 2020[8]) calls for greater efforts to provide and promote enabling environments for CSOs, and to fill gaps in CSOs’ effectiveness and accountability – all to better leverage their contribution to Agenda 2030. Learn more about ODA allocations to and through CSOs and civil society engagement in development co-operation.
Geographic focus
In 2018, DAC countries’ bilateral ODA focused almost evenly on both Asia (USD 34.8 billion) and Africa (USD 33.3 billion). Japan and Germany were the top DAC providers in Asia, while the United States alone provided one third of all DAC countries’ bilateral ODA to Africa. In relation to their overall bilateral portfolio, Japan disbursed the highest share of its gross bilateral ODA to Asia (64%), while Portugal allocated the highest share of its bilateral portfolio to Africa (66%). Thirty-two per cent of DAC countries’ gross bilateral ODA was unspecified by region in 2018.
In 2018, other official providers’ bilateral ODA focused mainly on Asia (USD 15.4 billion), with a focus on the Middle East. Turkey, the United Arab Emirates and Saudi Arabia provided 94% of this amount. Kuwait provided almost half of other official providers’ gross bilateral ODA to Africa. Seven per cent of their gross bilateral ODA was unspecified by region in 2018.
In 2018, the top five partner countries for DAC countries collectively were India, Indonesia, Afghanistan, Syria and Bangladesh. The top five partner countries for other official providers were Syria, Yemen, Egypt, Cuba and Serbia.
DAC countries allocated 2.4% of gross bilateral ODA to small island developing states (USD 2.8 billion), with Australia allocating the highest volume and New Zealand the highest share of gross bilateral ODA among them. Other official providers allocated 2.9% of their gross bilateral ODA to SIDS in 2018 (USD 606 million), with the Russian Federation allocating the highest volume as well as the highest share of gross bilateral ODA.
Thematic focus
In 2018, DAC countries committed 37% of their bilateral ODA to social infrastructure and services (USD 46.3 billion). Austria, Hungary, Poland, Portugal and Slovenia allocated at least 50% of their bilateral ODA to social infrastructure. Within this broad sector, DAC countries focused mostly on support to government and civil society (USD 16.3 billion) and health (USD 14.3 billion). DAC countries’ bilateral humanitarian aid amounted to USD 14.7 billion (12% of bilateral ODA). DAC countries’ earmarked contributions to multilateral organisations focused primarily on humanitarian aid and on social sectors and governance.
In 2018, other official providers collectively committed most of their bilateral ODA to humanitarian aid (USD 8.3 billion), with an emphasis on emergency response. Driven by Turkey’s large volume of humanitarian aid with an emphasis on emergency response, this amount accounted for 63% of their total bilateral ODA commitments. Other official providers' earmarked contributions to multilateral organisations also focused on humanitarian aid.
In 2018, DAC countries committed USD 275 million (0.3% of bilateral allocable aid) and other official providers committed USD 0.7 million to the mobilisation of domestic resources in developing countries. Finland, Norway, the Slovak Republic and Sweden committed at least 1% of bilateral allocable aid to domestic resource mobilisation.
DAC countries committed USD 30.6 billion (29.3% of bilateral allocable aid) and other official providers committed USD 1.0 billion (9.1% of bilateral allocable aid) to promote aid for trade and improve developing countries’ trade performance and integration into the world economy in 2018. Japan and Korea committed more than 50% of their bilateral allocable aid to promote aid for trade.
In 2018, DAC countries’ development finance institutions, development agencies and other institutions working with the private sector mobilised USD 10.3 billion of private finance mainly through guarantees, direct investment in companies or project finance special purpose vehicles (SPVs), shares in collective investment vehicles and credit lines.
In 2017-18, private finance mobilised by DAC countries mainly related to activities in the banking and financial services (43%), energy (18%), industry, mining and construction (12%), and agriculture, forestry and fishing (5%). Learn more about the amounts mobilised from the private sector for development.
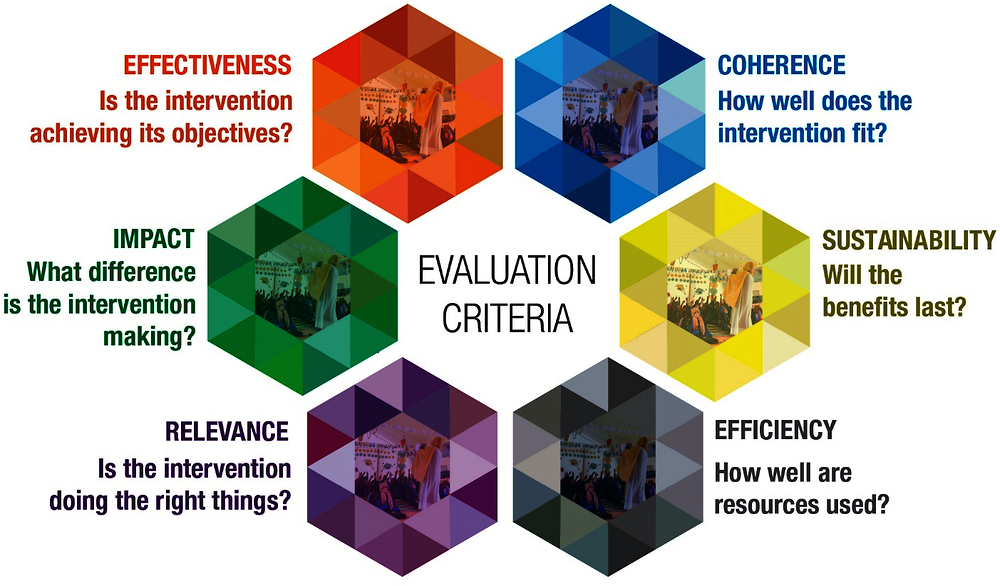
In 1991, the OECD Development Assistance Committee Network on Development Evaluation (EvalNet) first developed a set of criteria for evaluating international development co-operation. These criteria have since become a cornerstone of evaluation practice and are very widely used, including across public policy and beyond the OECD. These criteria were refined in 2019 to improve the quality and usefulness of evaluation and strengthen the contribution of evaluation to sustainable development. They are now six evaluation criteria – relevance, coherence, effectiveness, efficiency, impact, and sustainability – and two principles for their use.
All DAC members have agreed to these new criteria and are now working to integrate them into their evaluation policies and systems. The purpose of the evaluation criteria is linked to the purpose of evaluation: to enable the determination of the merit, worth, or significance of an intervention (the policy, project, programme, strategy, institution, or other activity being evaluated). The criteria are used to identify evaluation questions, with each criterion providing a different perspective on the intervention, its implementation, and its results. Together they describe the desired attributes of interventions: all interventions should be relevant to the context, coherent with other interventions, achieve their objectives, efficiently deliver results, and have positive impacts that last.
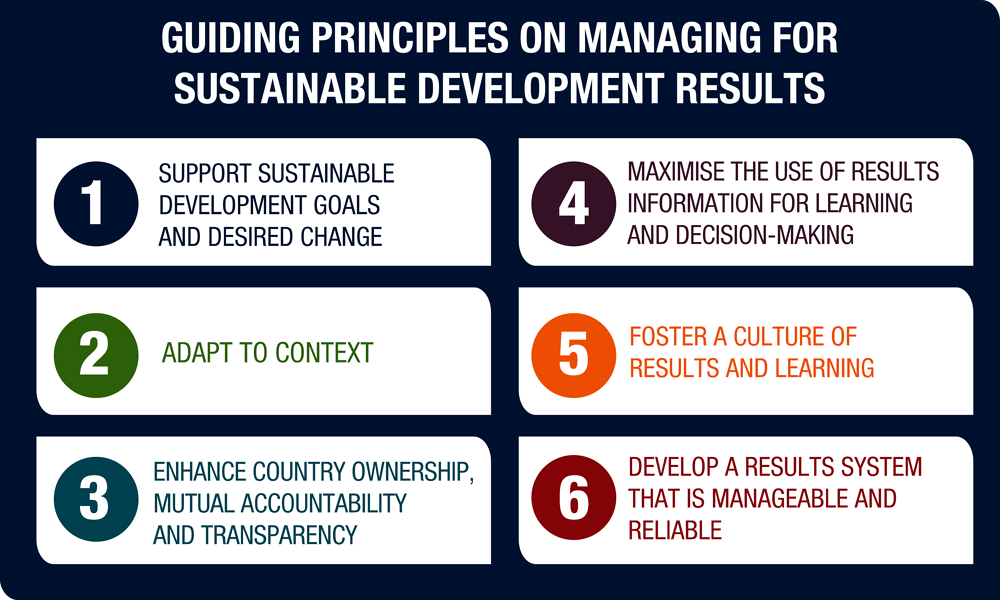
In July 2019, the DAC adopted new Guiding Principles on Managing for Sustainable Development Results. Their purpose is to help DAC members and other development actors navigate complex development challenges to reach their expected results and support sustainable development effectively – including through using results information not only for accountability but also for strategic decision-making and learning.
DAC members are starting to implement these Principles. According to a survey completed by 30 organisations in November 2019, it seems easier to align to principles two (adaptation) and four (learning and decision-making) than to principles three (country ownership, mutual accountability and transparency), five (culture of results and learning) and six (manageable and reliable results system). DAC members see the lack of an institutional culture of results, limited staff incentives, and weak IT systems as top constraints. Meanwhile, DAC members can capitalise on policy frameworks with a strong results orientation, solid results methodologies and quality assurance mechanisms, and the increasing demand for showing results.
In May 2020, the Global Partnership for Effective Development Co-operation launched a new Work Programme for 2020-2022. This new programme builds on the success of the Global Partnership’s Senior-Level Meeting, held in July 2019 in the margins of the High-Level Political Forum on Sustainable Development. At this meeting participants reaffirmed a vision of effectiveness as an essential driver for sustainable development. New evidence and tools to support partners to learn from good practices, identify progress and shortcomings, and propel new solutions to achieve the SDGs were also launched at the meeting. For example, the 2019 Global Progress Report and 86 country profiles, a Compendium of Good Practices, and the Kampala Principles for effective private sector engagement through development co-operation. These principles provide guidance for governments, development partners, businesses and civil society to make private sector partnerships at country level more effective
In February 2020, the DAC – a committed constituency of the Global Partnership – established an informal reference group on effective development co-operation, which will support the delivery of a modernised understanding of development co-operation effectiveness for DAC members, as a means to strengthen the contribution of development co-operation to achieving the SDGs.
DAC countries’ results from the 2019 Global Partnership monitoring round reflect some improvements and highlight persistent challenges. Since 2016, both DAC countries and other official providers increased the use of partner countries’ public financial management systems and the annual predictability of their development co-operation. The share of untied ODA improved on average for DAC members. However, they need to improve the use of results frameworks that reflect partner countries’ development priorities, as this declined in 2018. Similarly, the visibility of bilateral development co-operation has worsened, as medium-term predictability and the share of development co-operation finance recorded on partner countries’ budgets declined since 2016.
Explore the Monitoring Dashboard of the Global Partnership for Effective Development Co-operation.
The methodological notes provide further detail on the definitions and statistical methodologies applied, including the grant-equivalent methodology, core and earmarked contributions to multilateral organisations, country programmable aid, channels of delivery, bilateral ODA unspecified/unallocated, bilateral allocable aid, the gender equality policy marker, and the environment markers.
References
[10] Battersby, B., W. Lam and E. Ture (2020), Tracking the $9 Trillion Global Fiscal Support to Fight COVID-19, International Monetary Fund, Washington, DC, https://blogs.imf.org/2020/05/20/tracking-the-9-trillion-global-fiscal-support-to-fight-covid-19.
[24] DAC CSO Reference Group (2020), COVID-19 Calls for Effective Aid and Development Cooperation More Than Ever, https://concordeurope.org/wp-content/uploads/2020/04/Joint-Statement-on-Covid-19_with-additional-signatories-13Apr2020.pdf.
[45] Deutsche Welle (2020), Germany’s President Calls for Patience. Solidarity, In Face of Pandemic, Deutsche Welle, https://www.dw.com/en/germanys-president-calls-for-patience-solidarity-in-face-of-pandemic/a-53095804.
[37] Devereux, S. and P. White (2010), “Social protection in Africa: Evidence, politics and rights”, Poverty & Public Policy, Vol. 2/3, pp. 516-540, https://doi.org/10.2202/1944-2858.1078.
[44] European Commission (2020), Coronavirus Global Response: EU Launches Pledging Effort, European Commission, https://ec.europa.eu/commission/presscorner/detail/en/ip_20_710.
[47] European Commission (2020), Questions and Answers: The EU Budget for External Action in the Next Multiannual Financial Framework, European Commission, Brussels, https://ec.europa.eu/commission/presscorner/detail/en/QANDA_20_988.
[49] Federal Ministry of Finance, Germany (2020), Fiscal Package, Federal Ministry of Finance, https://www.bundesfinanzministerium.de/Content/EN/Standardartikel/Topics/Public-Finances/Articles/2020-06-04-fiscal-package.html.
[46] Financial Times (2020), Macron: Coronavirus Is Europe’s “Moment of Truth”, Financial Times, https://www.ft.com/video/96240572-7e35-4fcd-aecb-8f503d529354.
[54] G20 (2020), G20 Leader’s Statement: Extraordinary G20 Leaders’ Summit Statement on COVID-19, G20, https://g20.org/en/media/Documents/G20_Extraordinary%20G20%20Leaders%E2%80%99%20Summit_Statement_EN%20(3).pdf.
[23] G77 (2020), Statement by the Group of 77 and China on the COVID-19 Pandemic, UN General Assembly, https://www.g77.org/statement/getstatement.php?id=200403.
[43] GAVI, the Vaccine Alliance (2020), World Leaders Make Historic Commitments to Provide Equal Access to Vaccines for All, GAVI, the Vaccine Alliance, https://www.gavi.org/news/media-room/world-leaders-make-historic-commitments-provide-equal-access-vaccines-all (accessed on 12 June 2020).
[34] Gentilini, U. et al. (2020), “Social protection and jobs responses to COVID-19: A real-time review of country measures”, “Living Paper” version 7, http://documents.worldbank.org/curated/en/883501588611600156/pdf/Social-Protection-and-Jobs-Responses-to-COVID-19-A-Real-Time-Review-of-Country-Measures-May-1-2020.pdf (accessed on 7 May 2020).
[12] Gerszon, D. et al. (2020), Updated Estimates of the Impact of COVID-19 on Global Poverty, World Bank Blogs, World Bank, https://blogs.worldbank.org/opendata/updated-estimates-impact-covid-19-global-poverty.
[50] Government of Norway (2020), Norway’s Development Aid Budget Is Adjusted to Meet Needs Created by the Coronavirus Pandemic, Government of Norway, https://www.regjeringen.no/en/aktuelt/budget_adjusted/id2702016.
[55] GPEDC (2020), COVID-19 Global Pandemic and New GPEDC Work Programme, Global Partnership for Effective Development Co-operation, http://effectivecooperation.org/wp-content/uploads/2020/05/COVID-19_Pandemic_and_New_Work_Programme-GPEDC_Co-Chairs_Statement-ENG.pdf.
[57] GT Walker, P. et al. (2020), The Global Impact of COVID-19 and Strategies for Mitigation and Suppression, Imperial College, London, https://doi.org/10.25561/77735.
[30] IHME (2019), Financing Global Health 2018: Countries and Programs in Transition, Institute for Health Metrics and Evaluation, Seattle, WA, http://www.healthdata.org/sites/default/files/files/policy_report/FGH/2019/FGH_2018_full-report.pdf (accessed on 10 May 2020).
[35] IHME (2012), Financing Global Health 2012: The End of a Golden Age?, Institute for Health Metrics and Evaluation, Seattle, WA, http://www.healthdata.org/sites/default/files/files/policy_report/2012/FGH/IHME_FGH2012_FullReport_MedResolution.pdf (accessed on 10 May 2020).
[33] ILO (2017), World Social Protection Report 2017-19: Universal Social Protection to Achieve the Sustainable Development Goals, International Labour Office, Geneva, https://www.ilo.org/wcmsp5/groups/public/---dgreports/---dcomm/---publ/documents/publication/wcms_604882.pdf (accessed on 4 June 2020).
[42] IMF (2020), Serving Member Counties: Emergency Financing and Debt Relief, International Monetary Fund, Washington, DC, https://www.imf.org/en/Topics/imf-and-covid19/COVID-Lending-Tracker.
[19] IMF (2020), World Economic Outlook, April 2020: The Great Lockdown, International Monetary Fund, Washington, DC, https://www.imf.org/en/Publications/WEO/Issues/2020/04/14/weo-april-2020.
[52] ISPA (n.d.), About Inter Agency Social Protection Assessments, Inter Agency Social Protection Assessments, https://ispatools.org/about-ispa (accessed on 7 May 2020).
[56] Kim, J., M. Kessler and K. Poensgen (2020), Financing Transition in the Health Sector – What Can DAC Providers Do?, OECD, Paris.
[38] Mccord, A. (2017), “The role of public works in addressing poverty: Lessons from recent developments in public works programming”, https://doi.org/10.3362/9781780448435.009.
[39] Moore, M. et al. (2016), Identifying Future Disease Hot Spots: Infectious Disease Vulnerability Index, RAND Corporation, https://doi.org/10.7249/rr1605.
[51] OECD (2020), A “Debt Standstill” for the Poorest Countries: How Much Is At Stake?, OECD, Paris, https://read.oecd-ilibrary.org/view/?ref=132_132874-inojmef893&title=A-debt-standstill-for-the-poorest-countries-How-much-is-at-stake.
[29] OECD (2020), COVID-19 Global Pandemic: Joint Statement by the OECD Development Assistance Committee, OECD, Paris, http://www.oecd.org/dac/development-assistance-committee/dac-covid-19-statement.htm (accessed on 11 June 2020).
[40] OECD (2020), Covid-19, Crises and Fragility, OECD, Paris, https://read.oecd-ilibrary.org/view/?ref=131_131938-b9ys3suiav&title=COVID-19-Crises-and-Fragility (accessed on 11 May 2020).
[8] OECD (2020), Development Assistance Committee Members and Civil Society, https://doi.org/10.1787/51eb6df1-en.
[22] OECD (2020), Joint Statement by the OECD Development Assistance Committee on the COVID-19 Crisis, OECD, Paris, http://www.oecd.org/development/joint-statement-by-the-oecd-development-assistance-committee-on-the-covid-19-crisis.htm.
[9] OECD (2020), OECD Economic Outlook, Volume 2020 Issue 1: Preliminary Version, OECD Publishing, Paris, https://doi.org/10.1787/0d1d1e2e-en.
[28] OECD (2020), Official Development Assistance (ODA), OECD, Paris, https://www.oecd.org/dac/financing-sustainable-development/development-finance-standards/official-development-assistance.htm.
[3] OECD (2020), “Putting finance to work for gender equality and women’s empowerment: The way forward”, OECD Development Policy Papers, No. 25, OECD Publishing, Paris, https://doi.org/10.1787/f0fa4d91-en.
[26] OECD (2020), The 0.7% ODA/GNI Target - A History, OECD, Paris, https://www.oecd.org/dac/stats/the07odagnitarget-ahistory.htm.
[4] OECD (2019), Aligning Development Co-operation and Climate Action: The Only Way Forward, The Development Dimension, https://doi.org/10.1787/5099ad91-en.
[59] OECD (2019), Development Co-operation Report 2019: A Fairer, Greener, Safer Tomorrow, OECD Publishing, Paris, https://doi.org/10.1787/9a58c83f-en.
[6] OECD (2019), Green triangular co-operation: An accelerator to sustainable development, https://doi.org/10.1787/d81d884a-en.
[5] OECD (2019), Greening Development Co-operation: Lessons from the OECD Development Assistance Committee, The Development Dimension, https://doi.org/10.1787/62cc4634-en.
[25] OECD (2018), Global Outlook on Financing for Sustainable Development in 2019: Time to Face the Challenge, OECD Publishing, https://doi.org/10.1787/9789264307995-en.
[62] OECD (2018), States of Fragility 2018, OECD Publishing, Paris, https://doi.org/10.1787/9789264302075-en.
[61] OECD (2014), Society at a Glance: Asia/Pacific 2014, OECD Publishing, Paris, https://doi.org/10.1787/9789264220553-en.
[1] OECD (n.d.), Development Co-operation Report, OECD Publishing, Paris, https://doi.org/10.1787/20747721.
[15] OECD (forthcoming), The Impact of the Coronavirus (COVID-19) Crisis on Development Finance, OECD, Paris, https://www.oecd.org/coronavirus/en.
[7] OECD/UNDP (2019), Making Development Co-operation More Effective: 2019 Progress Report, OECD Publishing, Paris, https://doi.org/10.1787/26f2638f-en.
[36] Omilola, B. and S. Kaniki (2014), Social Protection in Africa: A Review of Potential Contribution and Impact on Poverty Reduction, United Nations Development Programme, https://www.undp.org/content/dam/south_africa/docs/mdgs/Social%20Protection%20in%20%20Africa-A%20Review%20of%20Potential%20Contribution%20and%20Impact%20on%20Poverty%20Reduction1.pdf (accessed on 28 May 2020).
[60] Piemonte, C. et al. (2019), “Transition finance: Introducing a new concept”, OECD Development Co-operation Working Papers, No. 54, OECD Publishing, Paris, https://doi.org/10.1787/2dad64fb-en.
[16] Ratha, D. et al. (2020), “COVID-19 through a migration lens”, Migration and Development Brief, No. 32, World Bank, Washington, DC, http://documents.worldbank.org/curated/en/989721587512418006/COVID-19-Crisis-Through-a-Migration-Lens.
[31] Ravallion, M. (2020), Pandemic Policies in Poor Places, Center for Global Development, https://www.cgdev.org/sites/default/files/pandemics-in-poor-places.pdf (accessed on 19 May 2020).
[13] Sumner, A., C. Hoy and E. and Ortiz-Juarez (2020), “Estimates of the impact of COVID-19 on global poverty”, WIDER Working Paper 43/2020, United Nations University, UNU-WIDER, https://www.wider.unu.edu/publication/estimates-impact-covid-19-global-poverty.
[21] UNCTAD (2020), Coronavirus Outbreak Has Cost Global Value Chains $50 Billion in Exports, United Nations Conference on Trade and Development, https://unctad.org/en/pages/newsdetails.aspx?OriginalVersionID=2297.
[17] UNCTAD (2020), “Impact of the COVID-19 pandemic on global FDI and GVCs: Updated analysis”, Investment Trends Monitor, https://unctad.org/en/PublicationsLibrary/diaeiainf2020d3_en.pdf.
[2] UNCTAD (2019), Least Developed Countries Report, https://unctad.org/en/PublicationChapters/ldcr2019_ch2_en.pdf.
[11] UNDP (2020), COVID-19 and Human Development: Assessing the Crisis, Envisioning the Recovery, 2020 Human Development Perspectives, United Nations Development Programme, New York, NY, http://hdr.undp.org/sites/default/files/covid-19_and_human_development_0.pdf.
[32] UNDP (2019), The State of Social Assistance in Africa, United Nations Development Programme, https://reliefweb.int/sites/reliefweb.int/files/resources/The%20State%20of%20Social%20Assistance%20in%20Africa%20Report-compressed.pdf (accessed on 3 June 2020).
[27] United Nations (2015), Addis Ababa Action Agenda of the Third International Conference on Financing for Development, United Nations, New York, NY, https://sustainabledevelopment.un.org/index.php?page=view&type=400&nr=2051&menu=35.
[58] United Nations Economic and Social Council (2020), Progress towards the Sustainable Development Goals: Report of the Secretary General, United Nations, New York, NY, https://sustainabledevelopment.un.org/content/documents/26158Final_SG_SDG_Progress_Report_14052020.pdf.
[41] UNOCHA (2020), UN Issues $2 Billion Appeal to Combat COVID-19, United Nations Office for the Coordination of Humanitarian Affairs, https://www.unocha.org/story/un-issues-2-billion-appeal-combat-covid-19.
[48] USAID (2020), COVID-19 Funding Requests and Unsolicited Proposals, United States Agency for International Development, https://www.usaid.gov/coronavirus/funding-requests-unsolicited-proposals.
[14] WFP (2020), COVID-19 Will Double Number of People Facing Food Crises Unless Swift Action Is Taken, press release, World Food Programme, https://www.wfp.org/news/covid-19-will-double-number-people-facing-food-crises-unless-swift-action-taken (accessed on 19 May 2020).
[53] WHO (2018), Universal Health Coverage, World Health Organization, https://www.who.int/healthsystems/universal_health_coverage/en (accessed on 7 May 2020).
[20] World Bank (2020), The Economy in the Time of COVID-19, World Bank, https://openknowledge.worldbank.org/bitstream/handle/10986/33555/9781464815706.pdf?sequence=5&isAllowed=y.
[18] Zeufack, A. et al. (2020), Assessing the Economic Impact of COVID-19 and Policy Responses in Sub-Saharan Africa, World Bank Group, https://openknowledge.worldbank.org/handle/10986/33541.
Notes
← 1. Though a member of the DAC, the European Union institutions’ ODA efforts are excluded from analysis of total ODA flows, as they are considered as multilateral flows. Current DAC member countries comprise: Australia, Austria, Belgium, Canada, the Czech Republic, Denmark, Finland, France, Germany, Greece, Hungary, Iceland, Ireland, Italy, Japan, Korea, Luxembourg, the Netherlands, New Zealand, Norway, Poland, Portugal, the Slovak Republic, Slovenia, Spain, Sweden, Switzerland, the United Kingdom and the United States.
← 2. Five of these providers – Estonia, Israel, Latvia, Lithuania and Turkey – are members of the OECD but not of the DAC, with all but Israel reporting at detailed activity level. The remainder are: Azerbaijan, Croatia, Cyprus, Kazakhstan, Kuwait, Romania and Saudi Arabia (activity level), and Bulgaria, Chinese Taipei, Thailand, Liechtenstein, Malta and the Russian Federation (aggregate level).
← 3. Of these providers, three (Chile, Colombia and Mexico) are members of the OECD but not members of the DAC. Costa Rica is an accession country to the OECD and not a member of the DAC. Of the remainder, five (Brazil, People’s Republic of China, India, Indonesia and South Africa) are key partners of the OECD, and Qatar is a DAC participant. The OECD estimates the volume of their programmes, based on official contributions to multilateral organisations and government reports, in an internationally comparable manner.
← 4. See DAC Global Relations Strategy updated in 2018.
← 5. Fourteen of the nineteen other official providers that report their ODA statistics to the OECD provided preliminary 2019 data. These include: Bulgaria, Croatia, Cyprus, Estonia, Israel, Latvia, Lithuania, Malta, Romania, the Russian Federation, Saudi Arabia, Chinese Taipei, Turkey, and United Arab Emirates.
← 6. The video OECD ODA Statistics: introducing the grant equivalent explains the difference between the two measures.
← 7. All 2019 statistics are expressed in current prices. Non-grants include sovereign loans, multilateral loans, equity investment and loans to the private sector.
← 8. The use of the recommended minimum criteria for the marker by some members in recent years can result in lower levels of aid reported as being focused on gender equality.